Taking advantage of a unique institutional feature of the early Romanian privatization design, when a group of companies was explicitly excluded from any privatization, we test how politicians select companies for privatization programs. The simulations show that politicians expected a 5.2 percent decline in employment among the non-privatizable group as a result of privatization. Indeed, our data reveal the importance of the ex ante separation between privatizable and non-privatizable companies: only a quarter of the privatizable group was actually privatized at the end of the political cycle we study.3.
The institutional setting of early Romanian privatization thus helps us to determine the importance of the expected effect of privatization on firm efficiency, employment and wages in the goals of politicians, and the results are not to a large extent contaminated by the exclusion of others goals, which we cannot measure. 2003) provides a country-wide analysis of the factors influencing the privatization decision. To test for reputational issues, information on the privatization price is also needed since both the quality of the company and the price asked for it determine the probability of privatization. 1996 is the end of the first political cycle, so it is a natural choice for the end of the period we are studying.
SELECTION OF FIRMS INTO THE PRIVATIZATION PROGRAM
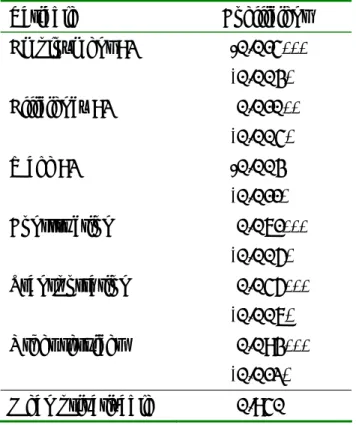
In 1992, the first year in the data, the average employment size of non-privatized firms in our sample is 1,402, while that of privatizable firms is 457. Average wages (total firm wage bill divided by number of employees) were very similar in both groups of firms. The unconditional mean comparison of pre-privatization performance and employment size suggests that pre-privatization employment and efficiency played a role in the selection of firms for privatization, while wages did not.
This means that the firm at the 10th percentile of the employment distribution has a 1.6 percent chance of being in the non-privatizable group, while this is 5.9 percent of the firm at the 90th percentile (the other variables are fixed at their mean level). ). The firm occupying the 10th percentile in the pre-privatization efficiency distribution has a 4.5 percent chance of being a non-privatizable group; this share is only two percent for the company that is at the 90th percentile. Wages do not appear to have played a role in the selection of firms eligible for privatization as the estimated coefficient is small and insignificant.
9 The 75th percentile of the employment distribution of privatizable firms is greater than the employment size of the median non-privatizable firm, and the 25th percentile of the non-privatizable employment distribution is smaller than the median privatizable firm's employment. The result that wages are not a decisive factor in the selection of companies for privatization also contradicts Dinc and Gupta (2007) and Liu et al. In our sample, only 12 firms were privatized by the end of 1992, the first year under study, showing that data from the first year of the analysis are contaminated by privatization effects to a very small degree.11 The overwhelming majority of privatizations in 1996 were MEBOs.
In the sample used in this study, over 90 percent of the firms were sold using this method. With this criterion, 683 firms from the sample were privatized, which constitutes 26 percent of privatizable firms.
EMPIRICAL METHOD
The efficiency result is similar to Dinc and Gupta's (2007) finding, but they find that larger firms are more likely to be privatized in India. Although the Privatization Law was passed in mid-1991, the privatization of enterprises gained momentum only in 1993-94. We consider a firm privatized in 1996 if it became majority private in 1995 or earlier to allow privatization to take effect in firm behavior.
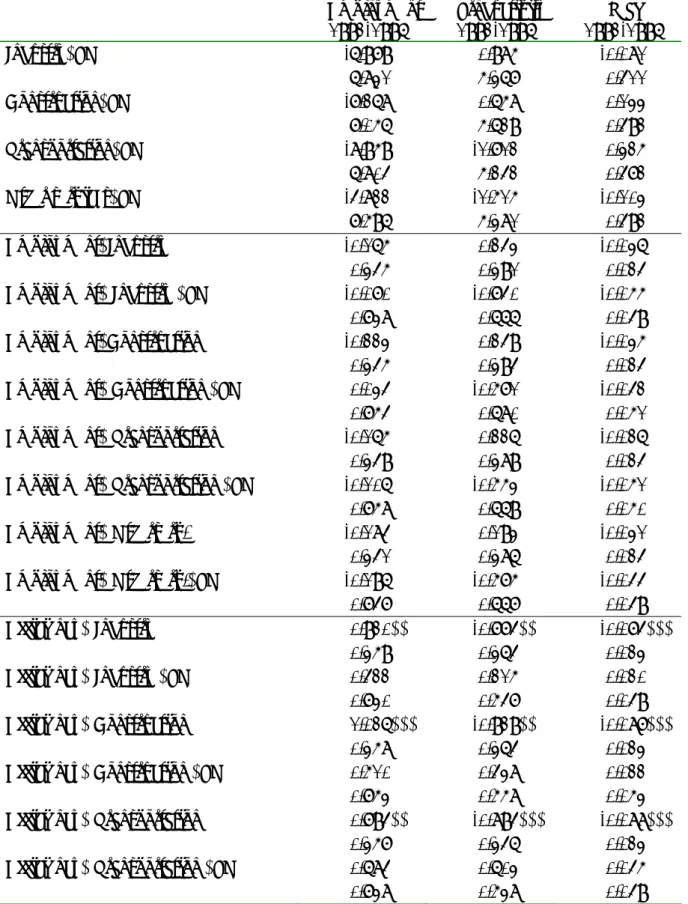
PO = 1 if the firm was majority privatized at the end of 1995, and zero otherwise, X92,i is a vector of firm i's characteristics from 1992, and εi is the residual product. To have enough non-privatizable and privatized firms in each industry for estimation, we define four dummies: industry, construction, transport and other services. The omitted category is industry, and we include interactions between PO and all four industry dummies (and do not include PO alone).
In order to enable a more flexible functional form between pre-privatization firm characteristics and the effect of privatization, we also include in X92 interactions between pre-privatization employment efficiency, wage efficiency, as well as interactions between employment, efficiency and wages with all four industrial dummies (and do not include those that interact with PO alone). This statistic shows the difference in the hypothetical effects of privatization between the two groups, and we use it to assess the motivations of decision makers. 12 Regression with fixed effects will provide estimates of either the average growth of the dependent variable over the years when the firm was already private (if the dependent variable is defined in levels) or the change in its growth rate (if defined as growth) .
For example, if Δ2emp<0 and Δ2eff>0 were would have to deal with. ownership change, even if these companies would have become more efficient as a result of privatization.
RESULTS
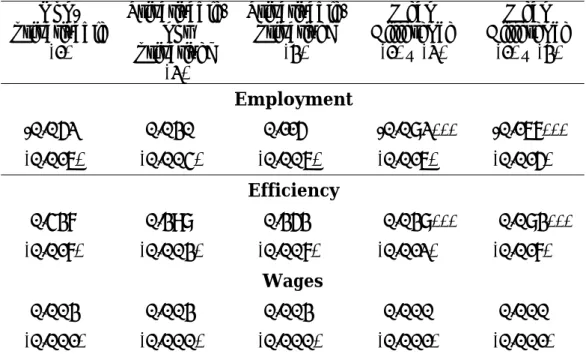
On the contrary, the employment level of the non-privatizable firms would have fallen by 5.5 percent as a result of privatization. The diverse privatization effect on employment is further underlined by the high statistical significance of the mean difference between the two groups.13. The simulated effect of privatization on the growth rate of this variable is only 0.3 percent in both non-privatizable and privatizable firms.
13 The reduction in employment in companies that cannot be privatized may not seem very large, but it is not negligible. If the expected effect of privatization on employment is applied to the entire group, the number of jobs lost would be 56,000, or about eight percent of the number of registered unemployed in 1996 (Romanian Statistical Yearbook, 1997, p. 148). The expected efficiency effects of privatization are very similar for both groups, but the effect is slightly larger for the non-privatizing group.
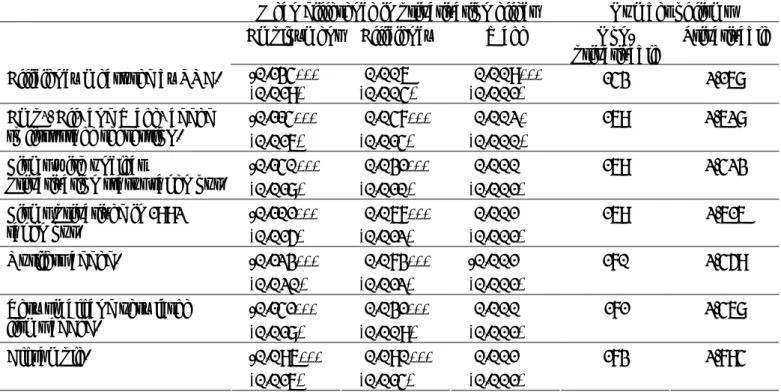
The simulated effect of privatization on wages is increased for the non-privatizing group, and the mean difference between the non-privatizing groups is significantly different from zero. The difference in the simulated effect of privatization between non-privatizable and privatizable firms is shown in the first row of Table 5 , where we also present this statistic for several other robustness checks. For example, since most of the new owners in privatized companies in Romania are employees of the company, it is possible that they bought those companies for which it was easy to maintain employment levels.
The simulated privatization effects of the two privatizable groups are always employment growth and the efficiency effects are always smaller than the measured effect for the non-privatizable group. The expected effects of the two privatizable groups are very similar in terms of efficiency gains and wage increases, but the employment effect of privatized firms is larger than that of the privatized but not yet privatized group.
CONCLUSIONS
In this case, the difference in the simulated privatization effects may arise not between the privatizable and non-privatizable firms, but between the privatized and non-privatized ones. Nevertheless, we cannot be sure that unmeasured characteristics of firms in the privatizable and non-privatizable groups are similar. If they possessed the same information that we use, our results hold regardless of differences in unobserved characteristics of non-privatizable and privatizable firms.
Indeed, it is likely that the behavior of a company under the control of management and employees differs from that of an outsider. Therefore, it is a priori unclear what the effects of privatization are in the case of sales to external owners and how these compare to MEBO privatizations.17 But if decision makers anticipated that privatizations will mainly be MEBOs, our results remain valid and there are indications that the Romanian program was prepared to be largely MEBO, at least in the initial phase. In a pilot privatization program launched in 1992, of the 22 companies ultimately privatized, 15 were exclusively and 4 were partially MEBOs (Earle and Telegdy, 1998).
Finally, we do not control for unobservable firm-specific effects in the first-stage regressions, and thus the estimated coefficients that we use to simulate the effect of privatization may be biased. 17 Earle and Telegdy (2002) find that Romanian MEBO privatization increased firms' productivity compared to state ownership, but the effect is smaller than that of privatization by outsiders. 1999) conclude that insider privatization does not improve productivity, while outsider privatization does, and that there is only weak evidence that employment levels are different among firms under the two ownership structures. The analysis is consistent with previous research and provides further evidence that privatization is a political process and that efficiency gains are only one of the factors that influence politicians' decisions when selecting companies for privatization programs.
In Romania, where jobs were destroyed and employment fell across the country, politicians felt the huge political costs of further job destruction; their main concern was not to increase the efficiency of firms, but to preserve employment at all costs. The average difference represents the difference between the average value of non-privatizable and privatizable firms.
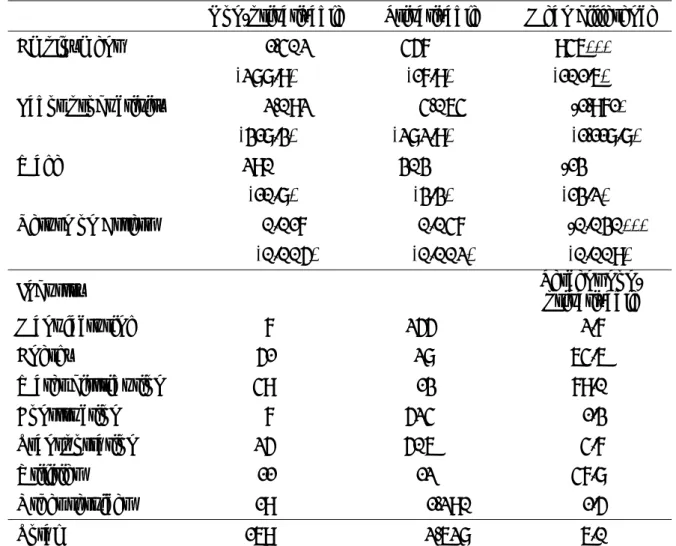
0.003) Efficiency 92 0.010**
0.004) Wage 92 -0.003
0.011) Construction 0.061***
0.005) Transportation 0.045***
0.006) Other services 0.093***
0.012) Mean privatizable 0.940
173 2,794 Note: The table presents the mean difference of the simulated effect of privatization between non-privatizable and privatizable firms (standard errors in parentheses).
LACKÓ Mária: A rejtett gazdaság és a munkaerőpiac néhány látható szegmense közötti összefüggések. VALENTINY Pál: Energetikai szolgáltatások helyi és országos szinten az átmeneti időszakban Magyarországon. LACKÓ Mária - SEMJÉN András: A rejtett gazdaság, a rejtett foglalkoztatás és az ezek csökkentését célzó kormányzati politika - irodalmi áttekintés.
SEMJÉN András - TÓTH István János - FAZEKAS Mihály: Alkalmi munkavállalók tartalék foglalkoztatása munkáltatói és munkavállalói interjúk tükrében. SEMJÉN András - TÓTH István János - MAKÓ Ágnes: A könyves alkalmazottak alkalmi foglalkoztatása és a rejtett gazdaság kapcsolata (Elemzés a könyves alkalmazottak kérdőíves felmérése alapján AM).