The original goal of our labor market yearbooks is an annual overview of the main events in the Hungarian labor market and an in-depth analysis of selected issues. Five years ago, the 2002 book Hungarian Labor Market focused on wage developments during the post-communist transformation. Previously, Labor Market Magazines focused on annual changes in the legal and institutional environment of the Hungarian labor market.
This year's study, however, is different: it is a summary of current legislation and rules, with a focus on unemployment benefits and active labor market policies.
IN HUNGARY
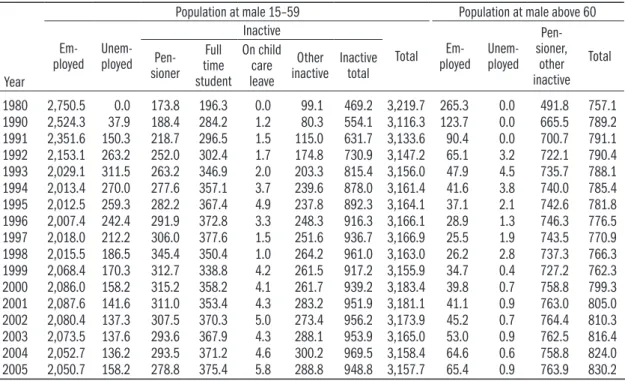
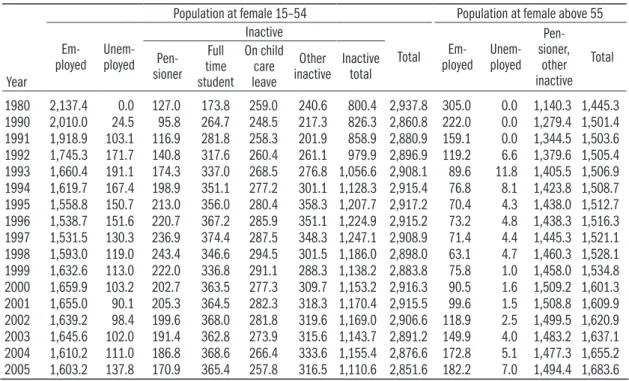
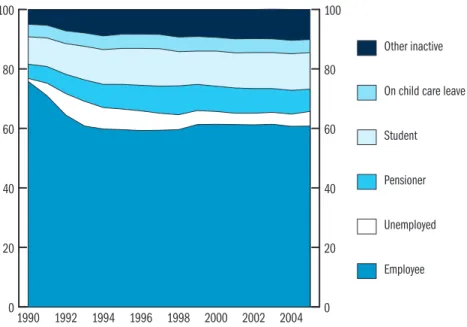
- EMPLOYMENT, INACTIVITY
- UNEMPLOYMENT 2
- WAGES
- REGIONAL DIFFERENCES IN EMPLOYMENT, UNEMPLOYMENT AND WAGES
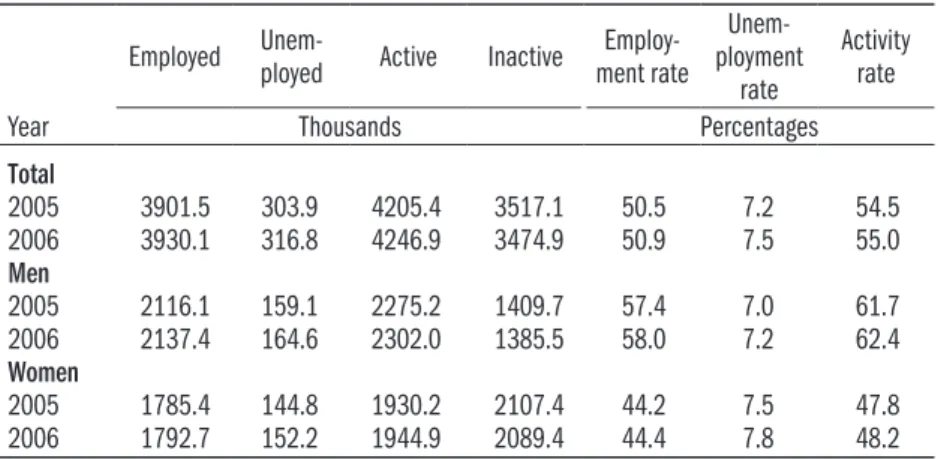
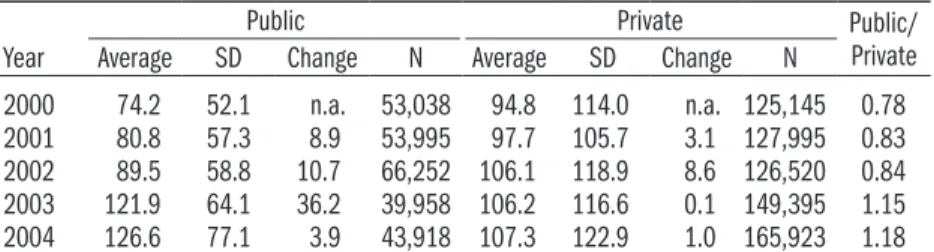
We present the levels of employment and activity, and we devote a longer discussion to the growth of the number of unemployed. Wages were 8.1 percent higher than a year earlier, as shown in Table 6. Wages increased in both the private and public sectors, but the magnitude of the change varied.
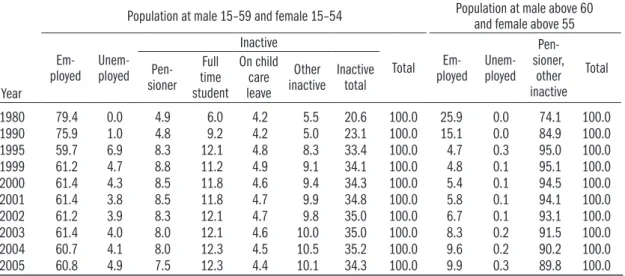
The ratio between the highest and lowest labor participation has been constant in recent years.
WAGES: NEW DEVELOPMENTS
IN-KIND BENEFITS IN HUNGARY
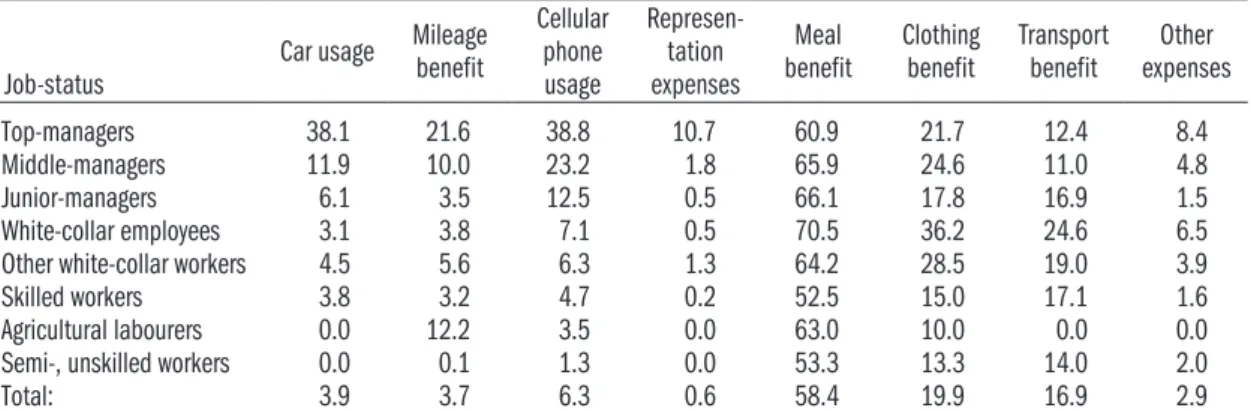
This study examines the role of in-kind benefits in total labor income in Hungary. The survey also has data, although without monetary equivalent, on different types of benefits in kind. There is a significant positive relationship between wages and the likelihood of receiving benefits in kind.
Recall from Table 1.1 that the share of benefits in kind within the total labor income is quite small.

DYNAMICS OF INTER-FIRM WAGE DIFFERENTIALS Gábor Kőrösi
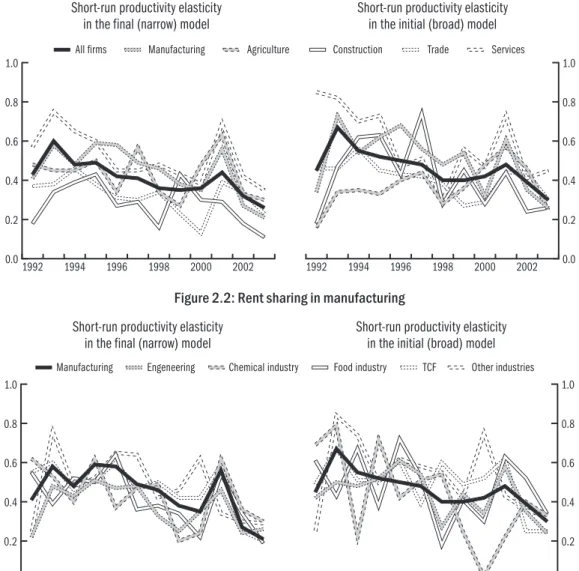
Several alternative theoretical explanations have been proposed in the literature to explain differences in wage setting across firms. They suggest that differences in regional unemployment rates strongly influence wage determination in the corporate sector. According to the logic of the rent-sharing model, they analyzed the effect of changes in productivity on wages.
And it is insignificant in most cases, just like all other ownership variables.
THE EFFECT OF THE PUBLIC SECTOR WAGE INCREASE ON THE PUBLIC-PRIVATE RELATIVE WAGES
In this case, we compare the salaries of employees of the same gender, education, work experience and profession in the public and private sector. 23. And at the end of the period wages are only 8.4 percent higher in the public sector (versus 18 percent). Consequently, the average salary in the public sector exceeded that of the corporate sector by 18 percent.
Where the scope of the latter is greater in the public sector, we have underestimated the scope of the premium.
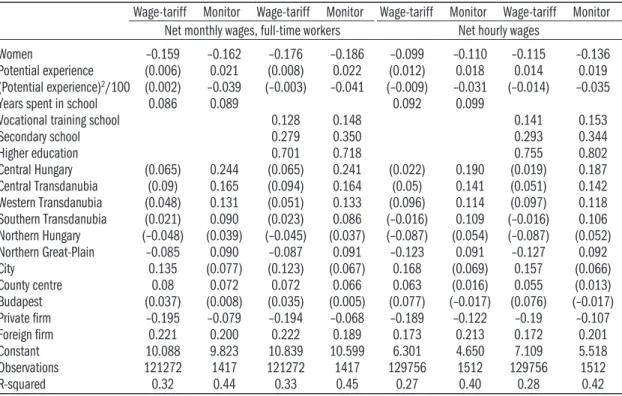
REGIONAL DIFFERENTIALS IN EARNINGS AND LABOUR COSTS Péter András Szabó
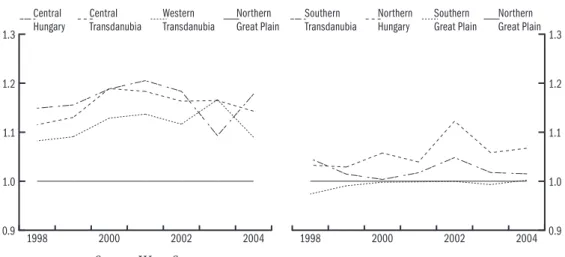
At the end of the period a one percent increase in the unemployment rate resulted in a 5 percent drop in income and a 6 percent drop in labor costs. However, in the case of Budapest, there is a notable difference: adjusted productivity differences fall below 5 percent. Figures 4.6 and 4.7 show the trend of net and gross wages in the three most developed regions (Central Hungary, Central and Western Transdanubia) compared to the Great Northern Plain.
As shown in Figures 4.1 and 4.2, gross income differences between the less developed regions are modest and become negligible when individual and individual regions are negligible. 29 In the standard Mincer equation (lnw=b0+b1S+b2X+b3X2, where S indicates the number of years in school and X the number of years working), the parameter becomes b1. This, together with the increase in the number of overqualified workers, can be interpreted as the first sign of the excessive production of higher education with a negative impact on returns.
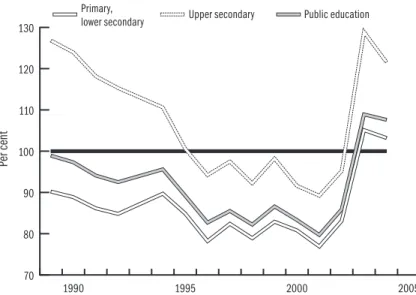
The relative earnings of graduates in the graduate occupations of the stable age group have increased significantly in recent years. 36 The graphs clearly show the consequences of the general wage increase in the public sector in 2002. In conclusion, it can be said that the profit advantage - clearly enormous in international comparison - in the rapidly rejuvenating professions of business and the administrative sector -administrative sectors have decreased .
The position of recent graduates in the public sector has improved significantly with the 2002 wage increase. Despite the subsequent decline, their relative earnings are still higher than in the period before the expansion of higher education.
CHANGES OF RELATIVE WAGES AND THE COMPOSITION OF THOSE EMPLOYED IN PUBLIC EDUCATIONOF THOSE EMPLOYED IN PUBLIC EDUCATION
The results of the first model, which describes the choice of teacher training, are reported in Table 6.4. The second half of the nineties brought considerable positive change in terms of gender differences in the occupational distribution, even though there was no further improvement in the relative wages of women. Second, the negative payoffs to working in a female occupation also declined in the second half of the nineties.
We used a modified version of the three-digit occupation codes (FEOR), which results in 125 dier-. Therefore, the length of their possible experience in the labor market changes at the time of the second observation, so it would be better to analyze their income mobility separately. Information about the average net (after tax) monthly salary and its standard deviation at the time of the first and second observation are reported in Table 8.1.
Two-thirds of persons who were in the first quintile at the time of the first observation can improve their earnings position, and the same applies to 43, 31 and 18 percent of them. Regarding their additional educational attainment, approximately half of the young graduates obtained another higher education degree between the two observations. The first column of the second panel of the table (wages at the time of the second observation) shows the grades obtained and their order.
We consider first matching and earnings at the time of the first observation, then take a look at the effect of matching mobility on second observation earnings. For those with one degree at the time of the second observation, law, informatics, or business/economics provides a statistically significant wage premium. Of the three dummies representing labor market experience (duration of being unemployed, full-time student and on childcare benefit), only unemployment appears to affect income (Panel F).
Regarding the first element, we have a dummy for the first observation (university =1, college=0) and a series of combinations of higher education degrees obtained at the time of the first and second observations.
OF THE HUNGARIAN LABOUR MARKET
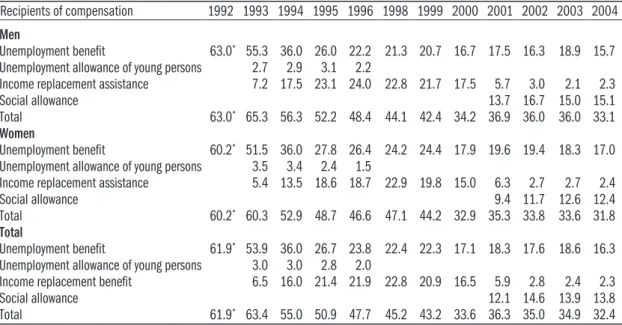
INCOME REPLACEMENT ASSISTANCE OF THE UNEMPLOYED
In 2004, two-thirds of the unemployed who were actively looking for work did not receive any unemployment-related financial assistance. Moreover, the contradictions of the old benefit system (for example the loss of the value of the benefits) were also strong arguments for change. As qualification for one benefit day requires five days spent in employment, the shortest payout period of the job search benefit will be 73 days (previously the shortest peri-.
The active inclusion and participation of the individual in the search for employment is crucial to the extent that, in case of non-fulfilment, the benefit is terminated. The introduction of the job search incentive from 1 July 2003 was intended to encourage longer and closer cooperation with the employment office. In the new system, actively looking for a job is one of the main conditions for eligibility.
People receiving jobseeker's benefit - likewise the recipients of the previous unemployment benefit - are not allowed to take up work, with the exception of casual work. Therefore, short-term employment is allowed with the casual employee log, and – unlike in the case of jobseeker's benefit – with no consequences for the amount of the allowance. The registration is initiated by the customer by submitting the appropriate registration form in the local office of the work center.
Progress and compliance with the content of the job search agreement is evaluated on a regular basis at personal meetings jointly by the individual and the designated staff member of the local office of the job center. Moreover, the positive impact of the job search agreement, namely any improvement in the employment indicators, remains imperceptible.

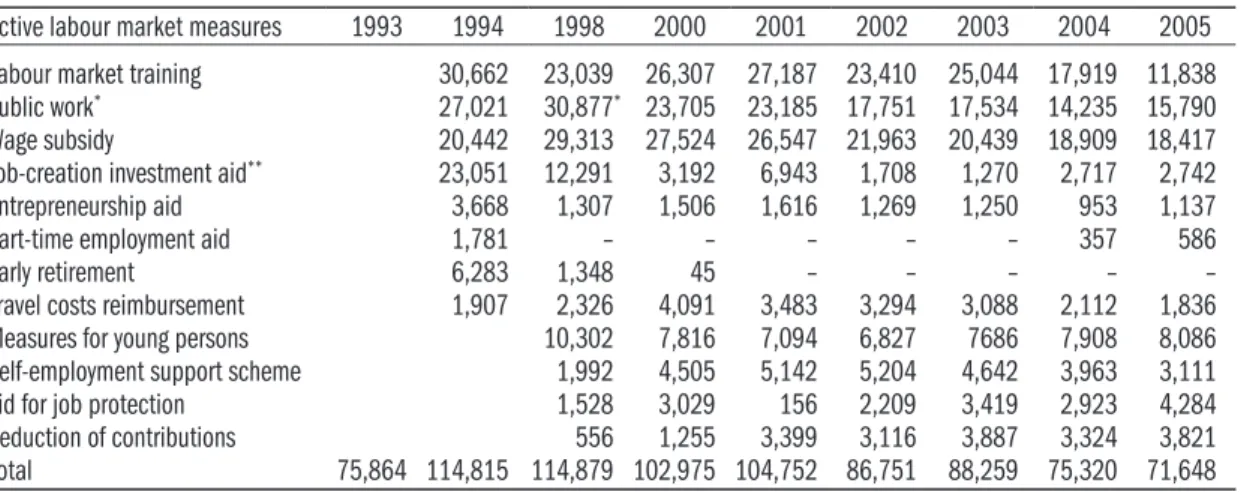
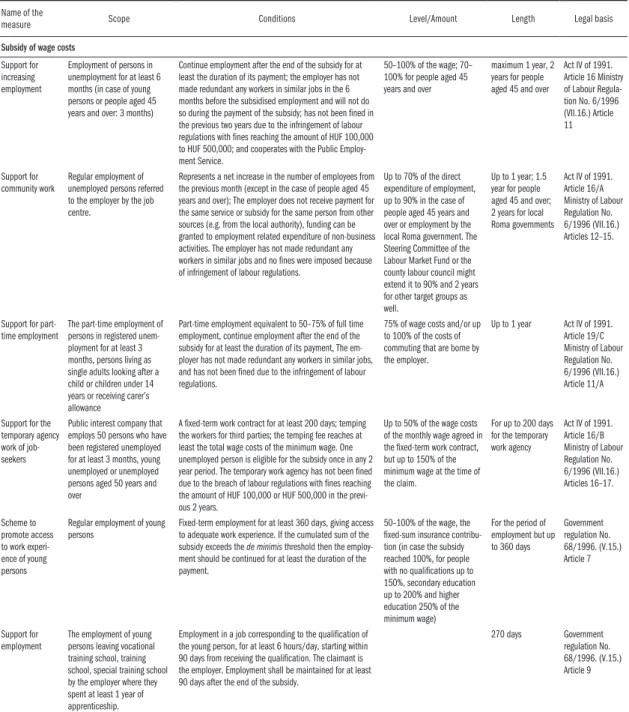
ACTIVE LABOUR MARKET POLICIES
The purpose of the wage subsidy is to promote the employment of disadvantaged persons. Employers are entitled to a wage subsidy of up to 50% of the wage cost, in the case of workers with disabilities up to 60%, for a period of 12 months. 19. According to the legislative proposal, from the current 60% of the minimum wage will increase to 100%.
Up to 70% of direct employment spending, up to 90% in the case of people aged 45 and over or employment by the local Roma government. 75% of wage costs and/or up to 100% of the cost of commuting borne by the employer. 50–100% of the wage, the fixed amount insurance contribution (if the subsidy reaches 100%, for people with no qualifications up to 150%, secondary education up to 200% and higher education 250% of the minimum wage).
Continued employment after the end of the subsidy for at least the duration of its payment. Income Replenishment or Income Replacement Assistance and up to 100% of training costs. The aid is equal to the amount of the jobseeker's benefit (if the person is not entitled to the jobseeker's benefit, then the minimum amount of the benefit), up to 50%.
The application must be submitted prior to the notification to the employees of their dismissal. Other (support services and programs) Completely or partially. financing the design and implementation of labor market programs. A combination of employment support and services for employers, employees and the target group of the program.
The percentages refer to the total number of registered unemployed and program participants.