The objectives of my thesis were to evaluate the direct and indirect effects of CT-assisted selection on growth, slaughter and reproductive traits. Furthermore, my objective was to evaluate the genetic parameters and trends of various growth, slaughter and reproduction traits. Experiments were performed at the Kaposvár University rabbit farm using Pannon White rabbits.
The full generation equivalent in the known family tree is the number of the sum of (1/2)n, where. During the data manipulation, the different methods of the SAS program were applied for descriptive and simple statistical analysis. The rabbits were scanned between the ilium (os ilium) and the entire knee joint with an overlapping slice thickness of 10 mm (11 to 12 scans), to determine the pixel frequency of the conductive muscle density.
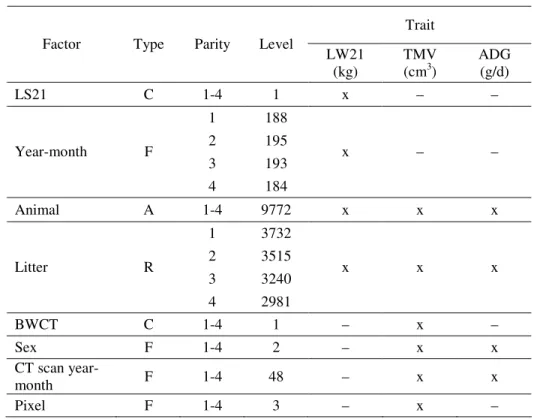
Estimation of h2 values of ADG and TGV was performed using data from all young rabbits born from 2003 to 2009. Postmortem determinations of hot carcass mass (which included head, liver, kidneys, heart + lungs, kidneys and surrounding fatty tissue). Continuous collection of data on litter weight at 21 days of age (LW21) since 1992 has made it possible to assess the heritability of this trait and the effect of selection (for ADG and TMV) on growth performance (e.g. weight of litter in 21 days. by age).
The assessment of genetic parameters and breeding values for litter weight at 21 days of age was completed using the same methods (linear model used) and software described in section 2.2.1.

Inbreeding depression
Stability of genetic parameters and of the breeding values
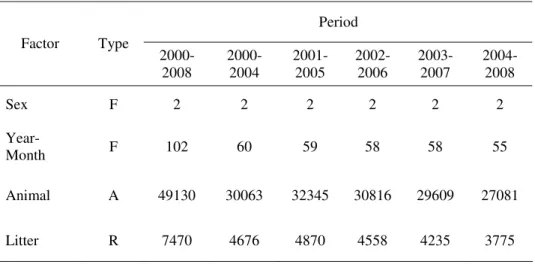
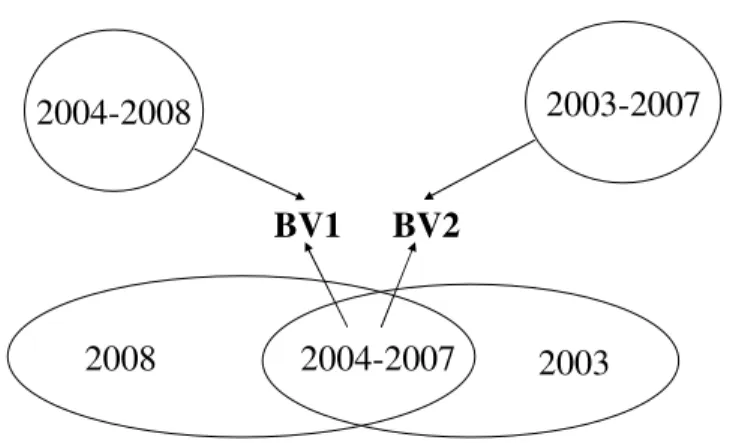
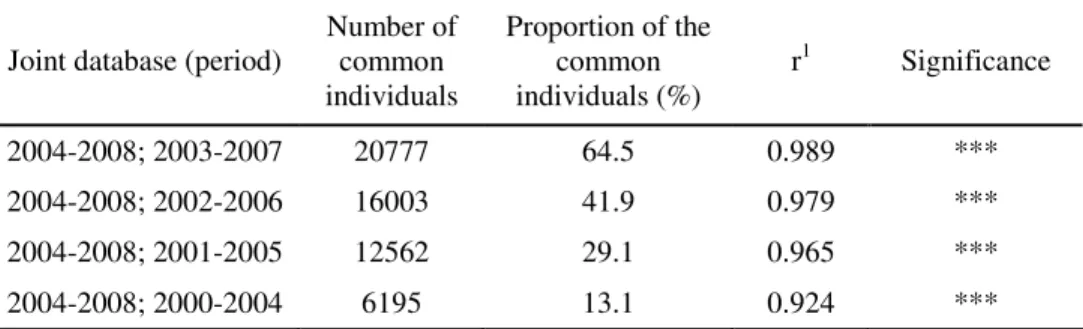
In the joint database, each rabbit has two breeding values (BV1, BV2) for the GDT, which were based on two separate 5-year periods. Based on the last part database and current part database (per period of 5 years) the Spearman's rank correlation between the breeding value estimates (BV1, BV2) was calculated using the SAS software package. Breeding values of the rabbits (born between 2004 and 2007) based on breeding value estimates (BV1 and BV2) from different databases.
RESULTS
Pedigree analysis
Descriptive statistics of intergenerational intervals (in years) in Pannon White rabbits for the estimated period. Complete pedigree information of the 2007 reference population was above 90% by the ninth generation, resulting in a large complete population generation equivalent (Figure 4). The number of founders contributing to inbreeding of the 2007 reference population ranged between 70 and 128, with a mean of 103.
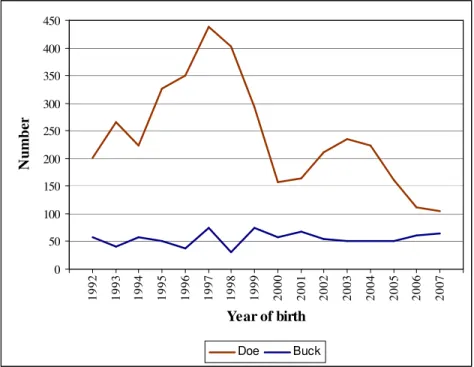
Distribution of partial inbreeding coefficients (pFi) for the 30 founders with the highest inbreeding contribution in Pannonian White rabbits born in 2007. The number of Pannonian Whites grew steadily until 1997, when the census size was over 500. In the reference population in 2007, the effective population size varied between 37.19 and 91.08, depending on the chosen calculation method.
This estimation method was also unreliable in cases where the family tree was not informative enough, but after the stabilization of the total family tree information (2002) gives a well-understood result (Figure 7). Trends of the effective number of founders, the effective number of ancestors and the founder genome equivalents are shown in Figure 8. In the first few years of the studied period, a drastic reduction occurred in the effective number of founders (fv) - and non-ancestors (fa), although this was not significant.
For the Pannon white breed, the applied mating system has been successful in the effective rate of inbreeding and the rate of loss of genetic variance. These findings support the need for continuous monitoring of accumulated genetic load and losses of genetic variance. In Pannon white rabbits, the disproportionate use of ancestors was evident from their genetic contribution.
Although the number of founders in the 2007 population was 581, the genetic contributions of the 10 most influential ancestors to the genetic variance were very high for the Pannon white rabbits born in 2007 (Table 10). In the Pannon white breed, the applied mating system was successful in the inbreeding rate and the extent of genetic variance loss, although the population size decreased in 2006, which significantly reduced the genetic variation. These findings support the need for continuous monitoring of the accumulated genetic load and genetic variance losses.
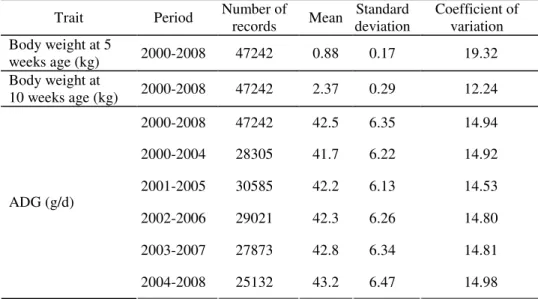
Genetic parameters and trends
- Average daily gain (ADG), thigh muscle volume (TMV), hind part percentage (HPP) and dressing out percentage (DoP)
- Litter weight at 21-days of age
- Number of kits born alive and dead
- Inbreeding depression
The genetic associations between mean daily gain (ADG), thigh muscle volume (TMV), hindquarter percentage (HPP) and dressing percentage (DoP) (standard errors in parentheses). The following table (Table 13) shows the estimated annual genetic and phenotypic trends for the analyzed traits. The estimated annual phenotypic and genetic progress in average daily gain (ADG), thigh muscle volume (TMV).
It was not possible to compare the progress in TMV and HPP with other authors' results. The litter weight at 21 days of age (LW21) showed the highest h2 values at the fourth parity (Table 14). Random litter effects were very low for LW21 (Table 14), that's why only a very small part of the maternal effect explains the total phenotypic variation of the litter weight at the age of 21 days.
A weak positive correlation was found between mean daily growth and thigh muscle volume and between mean daily growth and litter weight at 21 days of age (Table 15). A strong negative correlation was estimated between thigh muscle volume and litter weight at 21 days of age at the third and fourth parities, indicating that the applied CT selection can reduce LW21. The results suggest that litter weight of the Pannon White breed at 21 days of age (based on parity), the estimated genetic trend, was significantly greater than previously reported values.
It should be noted that this trait showed no phenotypic change in recent years, and this is estimated. The estimated annual phenotypic and genetic gain in litter weight at 21 days of age (LW21) by parity and in average daily gain (ADG). The h2 values of the number of live and stillborn young in characteristics are shown in Tables 17.
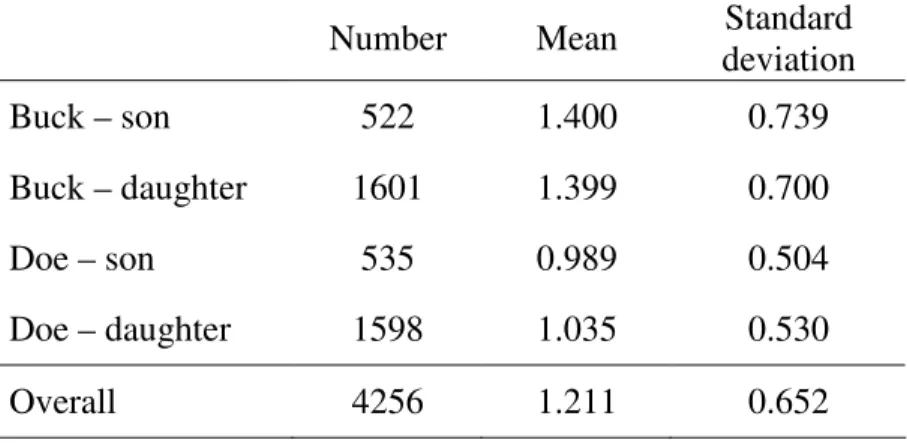
The estimated annual phenotypic and genetic trends in the number of live and dead kittens born. Because there was no selection for litter size in this breed, the observed progress in the number of kits born alive was surprising. The expected depressions for the number of sets born alive and stillborn were calculated separately for the maternal and litter inbreeding.
Effects of inbreeding of dams and litters (per 10%) on the number of live and stillborn kittens. As expected, inbreeding increased the number of dead young born, but the magnitude of the increase was not substantial.

Stability of genetic parameters and breeding values
Rank correlation of the breeding values in the average daily increase that describes the stability of the breeding values. Breeding value stability of the common individuals in section database The top breeding value individuals. The average breeding value differences in the general individuals of the share database in the top 100 and 1000 individuals.
Thus, the best-ranked rabbits evaluated in different databases showed significant differences in their average genetic value (Table 23).
CONCLUSIONS
NEW RESEARCH RESULTS
SUGGESTIONS
PUBLISHED IN THE SUBJECT OF THE DISSERTATION
2009): Genetic parameters of carcass traits in the Pannon White rabbit population 21st Hungarian Conference on Rabbit Production. Genetic parameters of CT-based in vivo growth and slaughter traits in Pannon white rabbits. Genetic parameters of in vivo growth based on Computed Tomography and reproductive traits in Pannon white rabbits.