Rusting Away?
The Ukrainian Iron and Steel Industry in Transition
VLAD MYKHNENKO
C P S I N T E R N A T I O N A L P O L I C Y F E L L O W S H I P P R O G R A M
2003/2004
Rusting Away?
The Ukrainian Iron and Steel Industry in Transition
The views in this report are the author's own and do not necessarily reflect those of the Center for Policy Studies, Central European University or the Open Society Institute. We have included the reports in the form they were submitted by the authors. No additional copyediting or typesetting has been done to them.
Rusting Away?
The Ukrainian Iron & Steel Industry in Transition
R
ESEARCHP
APERA
PRIL2004
Vlad Mykhnenko
OSI International Policy Fellow
*2003-2004 IPF Project: The Post-Communist State and Politics of Steel E-mail: [email protected]
* This publication was sponsored by the International Policy Fellowship Programme affiliated with the Central European University Centre for Policy Studies and the Open Society Institute – Budapest. I wish to express my gratitude to the IPF Staff as well as to the Open Society Institute- Budapest on the whole for their generous support. I also would like to thank Dr. David Lane (Cambridge) for his critical comments on the earlier version of this paper.
© Vladlen Mykhnenko, all rights reserved
INTRODUCTION
The main objectives of this paper are (a) to overview the Ukrainian ferrous metals sector, (b) to examine the performance of Ukraine’s iron and steel industry during the post- communist transformation, (c) to discover major challenges the industry has been faced with since the beginning of the 1990s, and (d) to evaluate corporate and public policy responses vis-à-vis the challenging environment of transformation and globalisation. This paper proceeds in four sections. The first part sets the stage by introducing the Ukrainian ferrous metals industry and its major enterprises. The second section examines the economic outcomes generated by the Ukrainian iron and steel industry under post- communism. The third section establishes and identifies a number of basic short-term problems and fundamental long-term challenges of the Ukrainian steel industry with regard to technological advancement, market access and development, resource base, and ownership transformation. Finally, this paper analyses the industry’s current corporate and public policy environment in Ukraine.
The project’s overall methodological framework is developed along the lines of the study of comparative economic systems with its appropriate adaptation and simplification for the study of separate industries or sectors. The methodology is based on the works of John Elliot (1973), Andrew Zimbalist (1984), Morris Bornstein (1985), Stephen Gardner (1998), Paul Gregory and Robert Stuart (1999). It identifies the economic outcomes of the iron and steel industry as the dependent variable to be analysed though three basic criteria such as output and sales growth, efficiency, and stability. The independent variables are the resource base of the industry (=natural resources and raw materials, labour, and capital) and the economic system (=ownership arrangements and co-ordination mechanisms). Exogenous influences that affect the industry’s performance – the environment – are regarded as an intervening variable. In addition, possible reform attempts and policies that the decision-makers choose to implement are considered to be the second intervening variable. Figure 1 provides an illustration of the present methodological framework.
Figure 1. Forces influencing economic outcomes
Environment
Reform
Policy
Source: Compiled on the basis of Ruud Knaack, ‘Dynamic Comparative Economics:
Lessons from Socialist Planning’, in Andrew Zimbalist, ed., Comparative Economic Systems: Present Views (Boston: Kluwer-Nijhoff Publishing, 1984), pp. 109-132; H.
Stephen Gardner, Comparative Economic Systems, 2nd edn (Fort Worth, TX: The Dryden Press, 1998); and Paul R. Gregory and Robert C. Stuart, Comparative Economic Systems, 6th edn (Boston: Houghton Mifflin, 1999).
INDUSTRY OVERVIEW
Prior to discussing the performance and challenges of the Ukrainian iron and steel industry under post-communism, one should overview the central characteristics of the ferrous metals sector. What was the magnitude of Ukraine’s ferrous metals production within the Soviet Union and on the world scale? Where are the industrial capacities situated within the country? What are the industry’s core products and major producers?
How is the technological cycle organised? This section responds to the questions above.
During its 130 year-long history, the Ukrainian iron and steel industry has developed into a fully-grown manufacturing sector. It involves the entire technological cycle of economic activities designed for the production of iron, steel, and a large number of semi- and fully-finished metal products. The Ukrainian ferrous metals capacities include: (1) the extraction, processing and agglomeration of iron, manganese and chromic iron ores; (2) the extraction and processing of fire-clay, refractory and complementary materials; (3) the production of coal coke; (4) the production of cast iron, blast furnace ferroalloys, crude steel, rolled metals, steel tubes, electric ferroalloys, and special metal materials for mechanical engineering; (5) the recycling of scrap metal. The Ukrainian iron and steel industry also incorporates a large number of non-metallic raw material deposits, mining,
Resources
Economic System
Performance
(Economic) Growth Efficiency
Stability
quarrying, and processing capacities, which produce flux, fire-clays, kaolin, dolomite, and metallurgical limestone.
The industry’s historical development has been spatially located around huge iron ore and coal deposits, water resources, and electric power facilities of the Donbas-Dnieper Bend in the east of Ukraine. Beginning in the 1870s, the Ukrainian iron and steel industry provided the basis for the industrial expansion of the Imperial Russia. Subsequently, Ukraine’s iron and steel works became a vital element in the Soviet Union’s industrialisation drive under Stalin in the 1930s. Table 1 indicates that Ukraine’s ferrous metals sector has maintained its significance for the Soviet economy throughout the entire historical period.
Table 1. Ukraine’s ferrous metals sector within the USSR, 1986
As % of total Soviet Union’s output
Iron ore 48
Manganese ore 72
Pig iron 43
Crude steel 35
Finished rolled ferrous metals 35
Steel tubes 35
As % of total Soviet Union’s size
Ukraine’s territory 2.7
Ukraine’s population 18.2
Source: Author’s calculations on the basis of USSR State Statistics Committee, Narodnoe khoziaistvo SSSR za 70 let (Moscow: Finansy i statistika, 1987); Ukrainian SSR State Statistics Committee, Ukrainskaia SSR v tsifrakh v 1988 godu (Kyiv: Tekhnika,1988).
Since the end of WWII, the overwhelming importance of the Ukrainian iron and steel industry for the economic development of the USSR had been gradually eroded by the development of new ferrous metals hubs in Central Russia and Siberia. Map 1 shows the wider geographical distribution of the Soviet metals sector achieved by the early 1980s.
Map 1. The geography of ferrous and non-ferrous metals centres in the USSR, 1982. Source: http://www.1uptravel.com/worldmaps/russia54.html
Ukraine’s production of iron ore and crude steel was amongst the top 3 to 4 largest in the world.
Table 2. Ukraine’s ferrous metals industry within the world, 1985-1986
Rank Country Crude steel
million tonnes (% of world output)
Rank Country Iron ore
million tonnes 1. USSR
of which, Ukraine
161 (22) 56.6 (8)
1. USSR of which, Ukraine
250 120
2. Japan 98 (14) 2. China 151
3. United States 75 (10) 3. Australia 91
4. China 52.5 (7) 4. Brazil 70
5. West Germany 38 (5) 5. United States 49
6. Italy 23 (3) 6. India 42
7. Brazil 20.5 (3) 7. Canada 40
8. Poland 17.1 (2) 8. South Africa 24.5
9. Czechoslovakia 15.1 (2) 9. Sweden 20.6
10. United Kingdom 14.7 (2) 10. Liberia 15
Source: Author’s calculations on the basis of USSR State Statistics Committee, Narodnoe khoziaistvo SSSR za 70 let (Moscow: Finansy i statistika, 1987); Ukrainian SSR State Statistics Committee, Ukrainskaia SSR v tsifrakh v 1988 godu (Kyiv: Tekhnika,1988);
International Iron and Steel Institute, World Steel in Figures: 2003 Edition (Brussels:
IISI, 2003).
In 1990, there were thirty two iron and steel works functioning in Ukraine. The Ukrainian iron and steel industry has long been characterised by one of the world’s highest levels of industrial establishment concentration: 98 per cent of pig iron and 97 per cent of crude steel are produced by steel works with an annual crude steel output of over one million tonne per year.† One of the most common forms of the organisation of production in the Ukrainian ferrous metals industry has been kombinat – a combine of integrated complementary industrial factories processing iron ore materials, coking coal, casting iron, smelting and rolling steel, and manufacturing finished metal products. In addition to the complete production cycle enterprises, there has been a large number of iron and steel works with an exclusive specialisation in producing pig iron and crude steel.
Reprocessing metallurgy has been concentrated on the electric furnace production of
† However, establishment (or plant-) concentration in a given market is usually much lower than firm- concentration. For instance, in 2002, the average annual crude steel output of the world’s largest 80 steel producing companies was 7.7 million tonnes. The biggest Ukrainian steel company – Kryvorizhstal – produced 6.9 million tonnes that year.
finished rolled metals, special steels and ferroalloys. Apart from the large iron and steel works, ‘small metallurgy’ has also been present in the country. Small steel mills typically function within large heavy engineering companies and produce metal products for machine-building purposes. However, under post-communism, different foundries, rolling shops, and mills within several large steel combines have been divided into independent mini-mills or finished metals firms.
Geographically, the Ukrainian iron and steel works are concentrated in the Donbas- Dnieper Bend within three ferrous metals areas. A half of Ukraine’s steel works are located in the Donbas (Donets Coal Basin) – around the coal fuel resources – and at the coastal plain around the Sea of Azov – a natural commercial gate-way and transportation route. Another half of the iron and steel works are situated in the lower Dnieper River region – around the deposits of iron and manganese ores and vast water reservoirs. Thus, according to Ukraine’s current administrative division, almost the entire iron and steel industry is located in four neighbouring south-eastern provinces - Dnipropetrovsk, Zaporizhzhia, Donetsk, and Luhansk oblasti (see Map 2).
Fourteen iron and steel works are grouped around the lower Dnieper River region. The Dnipropetrovsk industrial hub includes ferrous metals enterprises located in the cities of Dnipropetrovsk (four), Dniprodzerzhynsk, and Novomoskovsk, which produce pig-iron, crude steel, rolled ferrous metals, steel tubes, railway wheels, bridge construction elements, and metal alloys. The Zaporizhzhia industrial hub includes three ferrous metals companies which produce pig-iron, thin hot- and cold-rolled slab steel, moulded steel, transformer steel, white plates, bent rolled metal profiles, cold rolled sheet steel for the motor-car industry, and special steels for the heavy engineering industry. The Kryvyi Rih industrial hub covers one of the world largest iron and manganese ore deposits, open-cast mines, Ukraine’s currently largest iron and steel complex of Kryvyi Rih, a number of ore mining and processing combines and agglomeration plants (Southern, Central, Northern, Kryvyi Rih, Sukha Balka, and Inhulets factories), as well as a tube-rolling plant and a ferroalloys factory, both at the town of Nikopol. Two manganese ore mining and processing combines – at Marhanets and Ordzhenikidze – also operate in the surrounding area of Dnipropetrovsk oblast. In addition, the lower Dnieper River ferrous metals region includes the Kremenchuk iron ore deposits with its Poltava Ore Mining and Processing Combine.
The Donbas ferrous metals area includes thirteen iron and steel works, and the thirteen of Ukraine’s eighteen coal coking plants. The Donetsk-Makiivka industrial hub consists of four ferrous metals works (two in each city respectively), a number of coal coking plants, tube-rolling mills, and fire-clay factories. A modernised iron and steel works and a new mini-mill are situated at the Yenakieve industrial hub. The Alchevsk industrial hub includes one of the largest iron and steel combines and a ferroalloys factory. The Khartsyzsk industrial hub includes three ferrous metals producing enterprises (one steel works, one tube mill, and one steel wire factory). There are also several independent iron and steel works in the Donbas cities of Kramatorsk and Kostiantynivka. Small steel mills function at almost each of Ukraine’s largest heavy engineering factories. The ferrous metals area around the Sea of Azov includes the country’s second and third largest steel- producing combines in Mariupol as well as a small iron and steel factory at Kerch and the iron ore deposits around the city of Kerch on the Crimean peninsula. The two iron and steel works in Mariupol produce iron, steel, and a wide range of rolled metals, consuming the raw materials from the Kerch and, partially, Kryvyi Rih iron ore deposits. The ferrous metals industry of this area is closely related to local heavy engineering factories, coal coking plants, as well as the companies that produce chemicals, fertilizers, and construction materials (for an historical overview of the Ukrainian metals sector see Chumachenko 1977: 90-117; Zastavnyi 1990: 113-116; Petryha 1999).
By the turn of the century, the majority of the Ukrainian steel works have been operating within a complete technological cycle of production, casting from 1 to 7 million tonnes of crude steel per year. Since the beginning of privatisation in 1992, the overwhelming majority of the steel works have been commercialised and either fully privatised or placed under the private corporate management control. In terms of the existing steel-making capacity‡, Ukraine’s largest steel producing companies are as follows: the Azovstal Iron and Steel Combine (Mariupol, (formerly Zhdanov), Donetsk oblast; 1999 reported capacity: 8.3 million tonnes of crude steel); the Mariupol Illich Iron and Steel Combine (Mariupol Donetsk oblast; 7.200 mln.); the Dniprospetsstal Dnieper Special Steel Works
‡ The steel-producing capacity figures are of 1999 as reported by the OECD 2001.
(Zaporizhzhia; 5.800 mln.); the Kryvorizhstal State Iron and Steel Combine (Kryvyi Rih, Dnipropetrovsk oblast; 5.050 mln.)§; the Makiivka Kirov Iron and Steel Works (Makiivka, Donetsk oblast; 4.050 mln.); the Dniprovsky Dzerzhinsky Iron and Steel Combine (Dniprodzerzhynsk; 3.850 mln.); the Zaporizhstal Iron and Steel Combine (Zaporizhzhia; 3.600 mln); the Alchevsk Iron and Steel Combine (Alchevsk (formerly Komunarsk), Luhansk oblast; 3.290 mln.); the Yenakieve Iron and Steel Works (Yenakieve, Donetsk oblast; 3.000 mln.); the Dnipropetrovsk Petrovsky Iron and Steel Works (Dnipropetrovsk; 1.000 mln.); the Kostiantynivka Iron and Steel Works (Kostiantynivka, Donetsk oblast; 1.000 mln.); the Donetsk Iron and Steel Works (Donetsk; 0.840 mln.); the ISTIL-Donetsk Iron and Steel Mini-Mill (Donetsk; 0.840 mln.); the Dnieper Special Steel Electrometallurgical Mill (Zaporizhzhia; 0.750 mln.); the Kramatorsk Iron and Steel Works (Kramatorsk, Donetsk oblast; 0.700 mln.); the Energomashspetsstal Energy Machine-Building Special Steel Mill (Kramatorsk, Donetsk oblast; 0.600 mln.). In terms of sales turnover, the current ranking order of the Ukrainian steel producers is different to some extent. Figure 2 assesses the size of Ukraine’s ferrous metals companies by their latest annual sales figures reported. Between 1999 and 2002, the biggest five steel producers – Kryvorizhstal, Mariupol Illich, Azovstal, Zaporizhstal, and Alchevsk – had been making on average the two-thirds of industry sales, while over fifteen other companies accounted for another one-third of industry revenue turnover.
Figure 2. Ukraine’s steel companies by average annual revenue share, 1999-2002
Kryvorizhstal 17.8%
Mariupol Illich 17.3%
Azovstal 12.8%
Alchevsk 6.8%
Dnipropetro vsk Petrovsky
3.0% Donetsk Iron and Steel
Works 3.3%
Dnieper Special Steels
2.9%
Others*
13.6%
Dniprodzerz hynsk
6.6%
Nikopol Ferroalloys
5.0%
Zaporizhstal 11.0%
§ Since 1999, Kryvorizhstal has been substantially increasing its production capacity to become the largest steel producer in Ukraine. It is the only fully state-owned Ukrainian steel producer.
Note: Others include the following ferrous metals-producing companies (by total sales revenues): Donetskstal Iron and Steel Works**, Zaporizhzhia Ferroalloys, Metalen Yenakieve**, Makiivka Iron and Steel Works, Donetsk Metal-Rolling Works**, ISTIL- DMZ**, Yenakieve Iron and Steel Works, Silur Khartsyzsk**, Stakhanov Ferroalloys, Kremenchuk Steel Works, Zaporizhzhia Abrasive Plant, Energomashspetsstal
Kramatorsk. **Business start-ups.
Source: Author’s calculations on the basis of Ukrainian Investment Gazette, Top 100:
Reiting luchshykh kompanii Ukrainy 2001 (Kyiv: Ukrainskaia Investitsionnaia Gazeta, May 2001); Ukrainian Investment Gazette, Top 100: Reiting luchshykh kompanii Ukrainy 2002 (Kyiv: Ukrainskaia Investitsionnaia Gazeta, June 2002); Ukrainian Investment Gazette, Top 100: Reiting luchshykh kompanii Ukrainy (Kyiv: Ukrainskaia
Investitsionnaia Gazeta, June 2003).
Given the specific market position of the tube-rolling branch of the Ukrainian iron and steel industry, companies which manufacture steel tubes are separated statistically from the rest of the ferrous metals producers. Figure 3 shows the average market sales shares of the Ukrainian tube-rolling mills. By contrast with the crude steel production, the tube branch of the ferrous metals sector has been much more heavily concentrated: a single producing company – the Nyzhniodniprovsk Tube-Rolling Works – controls over 55 per cent of the tube sales, while the combined share of the largest four tube-rolling enterprises (including the Niko Tube Nikopol Seamless Tube Works, the Novomoskovsk Tube Works, and the Khartsyzsk Tube Works) amounts to over 80 per cent of the total reported product sales.
Figure 3. Ukraine’s tube mills by average annual revenue share, 1999-2002
Nyzhnio- dniprovsk Tube-Rolling
Works 55.6%
Nikopol Niko Tube
7.6%
Others*
14.6%
Novomosko vsk Tube
Works 9.5%
Khartsyzsk Tube Works
8.8%
Nikopol Stainless Tube
Works 3.8%
*Note: Others include Nikopol Pivdennyi Tube Mill, Dnipropetrovsk Comintern Iron and Steel Works, Nikopol UTIST Steel Tube Mill, Dnipropetrovsk Tube Mill, Sumy Frunze Weighted Boring Tube Works, Luhansk Tube Works.
Source: Author’s calculations on the basis of Ukrainian Investment Gazette, Top 100:
Reiting luchshykh kompanii Ukrainy 2001 (Kyiv: Ukrainskaia Investitsionnaia Gazeta, May 2001); Ukrainian Investment Gazette, Top 100: Reiting luchshykh kompanii Ukrainy 2002 (Kyiv: Ukrainskaia Investitsionnaia Gazeta, June 2002); Ukrainian Investment Gazette, Top 100: Reiting luchshykh kompanii Ukrainy (Kyiv: Ukrainskaia
Investitsionnaia Gazeta, June 2003).
This overview of the Ukrainian iron and steel industry is concluded with an assessment of the key element of the industry’s market structure - its concentration. I have aggregated the annual gross revenue data of the Ukrainian ferrous metal-producing companies to examine whether the industry is dominated by a small number of large firms or made up of many small firms and what is the present degree of industrial concentration? Figure 4 covers Ukraine’s iron and steel- producing companies and excludes iron and manganese ore mines, coal coking plants, and other raw materials firms. It shows that the Ukrainian ferrous metals sector has been characterised by a low level of industrial enterprise concentration. In 2002, the largest five steel companies accounted for 59 per cent of the total steel sales, while the gross revenue share of the top ten firms was 80 per cent of Ukraine’s crude steel production.
Figure 4. The industrial concentration of the Ukrainian ferrous metals production, 2002
Top five companies
59.2%
Top ten companies
80.1%
The remainder
19.9%
0%
25%
50%
75%
100%
domestic production share
The second five:
Alchevsk,
Donetskstal, Nikopol Ferroalloys,
Nyzhniodniprovsk Tube Works, Donetsk Iron and
The first five:
Kryvorizhstal, Mariupol Illich, Azovstal, Zaporizhstal, Dniprodzerzhynsk
Source: Author’s calculations on the basis of Ukrainian Investment Gazette, Top 100:
Reiting luchshykh kompanii Ukrainy (Kyiv: Ukrainskaia Investitsionnaia Gazeta, June 2003).
The overall number of functioning iron and steel works, tube mills, ferroalloys factories, and other ferrous metal-producing enterprises – big enough to have an impact on the market – currently exceeds thirty. Moreover, during the post-communist transformation, Ukraine’s ferrous metals sector on the whole has experienced some fragmentation, which was accompanied by a massive wave of newly-established iron and steel businesses, primarily in the field of steel products marketing and export facilitation. By the end of 2002, there were 2538 small firms** and 600 large companies registered in Ukraine as commercial entities under the institutional classification section of ‘manufacture of basic metals and metal products’ (author’s calculations on the basis of Ukrainian State Statistics Committee 2003: Tables 7.4 and 14.37).
PERFORMANCE
Having overviewed the general characteristics of the Ukrainian ferrous metals industry, this paper turns now towards examining the economic performance of the sector during the post-communist transformation. There are three core issues that this section is focused on. Firstly, it examines the growth trajectory of the Ukrainian ferrous metals output and market sales. Secondly, the corporate and export performance of the Ukrainian iron and steel producers is explored. Consequently, the section turns to the efficiency, productivity, and profitability patterns of the Ukrainian iron and steel industry. Finally, the issue of the industry’s stability is discussed.
INDUSTRIAL GROWTH
The post-communist transformation has made an enormous impact on the Ukrainian iron and steel industry. Figure 5 shows that within the first five years of Ukraine’s newly- gained independence, the production of ferrous metals plummeted by almost 60 per cent.
This sharp output decline affected the entire range of the ferrous metals produced in the country, extending from pig iron, crude steel and rolled metals, to steel strips and tubes.
The output collapse was the most dramatic in the tube-rolling branch of the industry, where the steel tube production suffered an almost 80 per cent decline (see Figure 6).
** According to the Ukrainian legislation, small firms are those which employ less than 50 employees and have the total annual turnover of less than 0.5 million euro.
Figure 5. Ukraine’s ferrous metals production, absolute volume, 1985-2003
0 5 10 15 20 25 30 35 40 45 50 55 60
1985 90 91 92 93 94 95 96 97 98 99
2000 01 02 03
million tonnes
Pig iron Crude steel Finished rolled ferrous metals Source: Ukrainian State Statistics Committee, Statystychnyi shchorichnyk Ukrainy za 1995 rik (Kyiv: Technical, 1996); Ukrainian State Statistics Committee, Statystychnyi shchorichnyk Ukrainy za 2000 rik (Kyiv: Technical, 2001); Ukrainian State Statistics Committee, Statystychnyi shchorichnyk Ukrainy za 2002 rik (Kyiv: Technical, 2003); and author’s calculations on the basis of Ukrainian State Statistics Committee, Vyrobnytstvo osnovnykh vydiv promyslovoi produktsii po misiatsiakh 2003 roku; available at
http://www.ukrstat.gov.ua/operativ/operativ2003/pr/ovp/ovp_u/arh_ovp.html.
In the second half of the 1990s, the Ukrainian iron and steel industry began to show some visible signs of recovery. Since 1996, all major ferrous metal products manufactured in Ukraine, especially finished steel products, have been indicating strong output growth trends in absolute volume terms. Moreover, Figure 5 shows that the revival of Ukraine’s ferrous metals output has only been mildly affected by the subsequent Asian and Russian economic crises of 1997-1998. Since Russia’s gas and oil giants remain the key consumers of Ukrainian steel tubes, Ukraine’s tube-rolling mills have appeared to be the main victim of the Russian financial turmoil of 1998. However, as Figure 6 shows, the problematic environment of the world markets notwithstanding, the Ukrainian production of steel tubes has recently recovered to one-third of its pre-transition output level.
Figure 6. Ukraine’s steel tube production, 1985-2003
0 0.5 1 1.5 2 2.5 3 3.5 4 4.5 5 5.5 6 6.5 7 7.5
1985 90 91 92 93 94 95 96 97 98 99
2000 01 02 03
million tonnes
Steel tubes
Source: Ukrainian State Statistics Committee, Statystychnyi shchorichnyk Ukrainy za 1995 rik (Kyiv: Technical, 1996); Ukrainian State Statistics Committee, Statystychnyi shchorichnyk Ukrainy za 2000 rik (Kyiv: Technical, 2001); Ukrainian State Statistics Committee, Statystychnyi shchorichnyk Ukrainy za 2002 rik (Kyiv: Technical, 2003); and author’s calculations on the basis of Ukrainian State Statistics Committee, Vyrobnytstvo osnovnykh vydiv promyslovoi produktsii po misiatsiakh 2003 roku; available at
http://www.ukrstat.gov.ua/operativ/operativ2003/pr/ovp/ovp_u/arh_ovp.html.
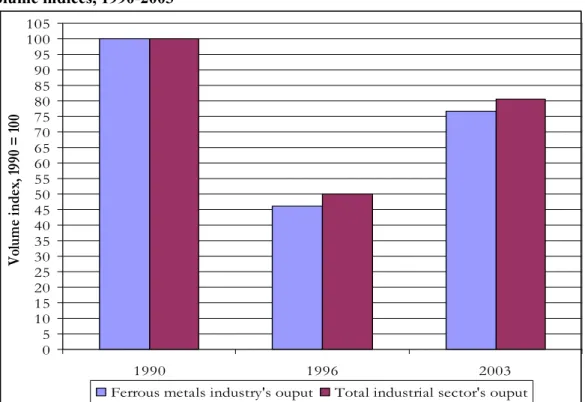
The recovery of the Ukrainian iron and steel industry has preceded the overall revival of Ukraine’s economy by at least three years. Already in 1996, the Ukrainian steel industry recorded a 12 per cent annual sales increase. An 8 per cent growth followed in 1997. In 1998, however, the Russian financial crisis, the ensuing loss of export contracts, and, most importantly, the extensive depreciation of the Ukrainian currency resulted in a 7 percent decline of the Ukrainian steel industry’s sales. The ferrous metals output in absolute volume terms did not decline to such an extent. Figure 7 illustrates another feature of the Ukrainian iron and steel industry’s economic performance during the post- communist transformation, namely its deeper output slump, even if compared with the overall industrial sector’s trajectory. By the end of 1995, Ukraine’s ferrous metals industry had lost 59 per cent of its pre-transition production, whereas the corresponding figure for the entire industrial sector was 48 per cent. On the whole, in contrast to the experience of other heavily industrialised Central and Eastern European countries, the post-communist transformation has led to a distinct V-shaped response of the Ukrainian
iron and steel industry. Figure 7 also shows that, since the second half of the 1990s, a protracted and deep fall in Ukraine’s ferrous metals sales has been followed by rapid recovery.
Figure 7. Ukraine’s industrial sector and ferrous metals industry growth patterns, volume indices, 1990-2003
05 1015 2025 3035 4045 50 5560 6570 7580 8590 10095 105
1990 1996 2003
Volume index, 1990 = 100
Ferrous metals industry's ouput Total industrial sector's ouput
Source: Author’s calculations on the basis of Ukrainian State Statistics Committee, Statystychnyi shchorichnyk Ukrainy za 2002 rik (Kyiv: Technical, 2003); National Bank of Ukraine, Osnovni pokaznyky ekonomichnoho i sotsial’noho stanu Ukrainy 2001-2004 roky (Kyiv: National Bank, 2004); Ukrainian State Statistics Committee, Vyrobnytstvo ta tempy pryrostu obsiahiv promyslovoi produktsii: Operatyvni danni (Kyiv: Derzhkomstat, 2004).
On the international scale, the turn of the Ukrainian iron and steel industry towards recovery has put the country back into the league of the largest steel producing countries.
Figure 8 shows that in 2002 Ukraine occupied the seventh position. The country produced more crude steel than Brazil, India and Italy, but was firmly behind Russia, South Korea, Germany, and the world’s top three steel-producing giants (China, Japan, and the United States).
Figure 8. The major steel-producing countries, 2002 Crude steel production
100 2030 4050 6070 8090 100110 120130 140150 160170 180190 200
China Japan United States
Russia South Korea
Germany Ukraine
Brazil
India Italy France
Taiwan Turkey
Spain Canada
Mexico United Ki
ngdom Belgium
South Africa Poland
million tonnes
Source: International Iron and Steel Institute, Steel Statistical Yearbook 2003 (Brussels:
IISI, 2004); International Iron and Steel Institute, World Steel in Figures: 2003 Edition (Brussels: IISI, 2003).
EXPORTS GROWTH
The apparent recovery of Ukraine’s ferrous metals sector has been propelled by a remarkable export expansion. Between 1990 and 2002, Ukraine’s share in the world steel production halved to 4 per cent. Notwithstanding, by the late 1990s, Ukraine became one of the world’s top three major steel-exporting countries. Table 3 indicates that considering net export figures, Ukraine has almost become the world’s second largest steel exporter. Moreover, according to the national statistical account, in 2002, Ukraine exported 32 million tonnes of ferrous metals – the second largest amount of steel exports in the world after Japan. On the whole, the Ukrainian iron and steel companies have been exporting between 75 and 80 per cent of the domestically produced steel. Several Ukrainian iron and steel works have recently appeared in the league of the world’s largest steel exporting companies.
Table 3. The major exporters and importers of steel, million tonnes, 2002
Rank Total exports Rank Total imports
1 Japan 35.2 1 United States 30.2
2 Russia 27.7 2 China 29.2
3 Ukraine 25.9 3 Germany 17.8
4 Germany 24.7 4 Italy 16.6
5 Belgium-Luxembourg 20.3 5 France 15.8
6 France 17.6 6 South Korea 14.1
7 South Korea 12.9 7 Belgium-Luxembourg 10.9
8 Brazil 11.8 8 Taiwan 10.9
9 Italy 11.4 9 Spain 10.4
10 Turkey 11.0 10 Thailand 9.8
11 Taiwan 8.8 11 United Kingdom 8.9
12 Netherlands 7.2 12 Hong Kong 7.9
13 China 6.8 13 Canada 7.7
14 United Kingdom 6.6 14 Turkey 6.6
15 Spain 6.3 15 Mexico 5.8
World Total 317.4 World Total 310.1
Rank Net exports (exports-imports) Rank Net imports (imports-exports)
1 Japan 31.9 1 United States 24.6
2 Russia 25.54 2 China 22.4
3 Ukraine 25.52 3 Hong Kong 5.4
4 Brazil 11.0 4 Thailand 8.2
5 Belgium-Luxembourg 9.4 5 Italy 5.2
6 Germany 6.9 6 Iran 4.5
7 Turkey 4.3 7 Spain 4.1
8 Kazakhstan 3.7 8 Vietnam 4.6
9 South Africa 3.0 9 United Arab Emirates 2.9
10 Austria 2.4 10 Malaysia 2.8
11 Romania 2.4 11 Portugal 2.5
12 Argentina 2.2 12 Indonesia 2.4
13 Venezuela 2.0 13 Singapore 2.38
14 India 1.8 14 United Kingdom 2.2
15 Netherlands 1.7 15 Philippines 1.7
Note: Some of the IISI data in this table are based on exporters’ figures and understate the actual volume of imports.
Source: Author’s calculations on the basis of International Iron and Steel Institute, Steel Statistical Yearbook 2003 (Brussels: IISI, 2004); International Iron and Steel Institute, World Steel in Figures: 2003 Edition (Brussels: IISI, 2003).
The role of steel exports for the Ukrainian economy has been steadily increasing (see Figure 9). Between 1994 and 2002, the share of base metals and metal products – the key component of the statistical category of ‘manufactured goods, classified chiefly by material’ – in Ukraine’s total merchandise exports expanded from 39.5 to 44.6 per cent (or from US$ 3,721 million to US$ 7,126 million). In the course of the post-communist transformation, steel products have become the single largest Ukrainian export
commodity, accounting in 2002 for 30 per cent of the country’s total merchandise exports and worth US$ 5,300 million.
Figure 9. The break-down of the Ukrainian merchandise exports, 1994-2002 Ukraine: exports structure
10.1 11.8 11.4
10.90.6 0.910 12.51.9
13.7 13.2 9.3
39.5 43.9 44.6
21.9 13.9 13.6
3.30 2.34 5.61.1
0 25 50 75 100
1994 1997 2002
percentage share of exports
Articles non classified elsewhere Miscellaneous manuf. articles Machinery and transport equipment Manufactured goods, classif. by material
Chemical products
Oils, fats and waxes
Crude materials, minerals and energy Food and live animals, drink and tobacco
Source: Author’s calculations on the basis of Ukrainian State Statistics Committee, Statystychnyi shchorichnyk Ukrainy za 1994 rik (Kyiv: Technical, 1995); Ukrainian State Statistics Committee, Statystychnyi shchorichnyk Ukrainy za 1999 rik (Kyiv: Technical, 2000); Ukrainian State Statistics Committee, Statystychnyi shchorichnyk Ukrainy za 2002 rik (Kyiv: Technical, 2003).
Figure 10 shows the major geographical destinations of Ukraine’s merchandise exports.
The primary targets for the Ukrainian steel export are China, the countries of South-East Asia, Russia and the former Soviet Union, Eastern Europe, and some EU member states.
The rest of the world appears to be of secondary importance, as the great bulk of the Ukrainian steel export has been barred from the U.S. market. Although the data on the geographical distribution of ferrous metals exported from Ukraine are not widely available, it is contended that the illustration provided in Figure 10 is rather accurate in this regard.
Figure 10. The major destinations of Ukrainian merchandise exports, 1994-2002
57.7
35.1 27.3
19.0
29.8
33.3 18.0
23.7 28.2
0.7 4.4 5.9
3.9 4.5 3.4
0.7 2.4 1.8
0.0 0.1 0.1
0 20 40 60 80 100
1994 1998 2002
Merchandise exports
percentage of total exports
Australia and Oceania
South America and the Caribbean North America Africa
Asia Europe Former USSR
Source: Author’s calculations on the basis of Ukrainian State Statistics Committee, Statystychnyi shchorichnyk Ukrainy za 1994 rik (Kyiv: Technical, 1995); Ukrainian State Statistics Committee, Statystychnyi shchorichnyk Ukrainy za 1999 rik (Kyiv: Technical, 2000); Ukrainian State Statistics Committee, Statystychnyi shchorichnyk Ukrainy za 2002 rik (Kyiv: Technical, 2003).
CORPORATE PERFORMANCE
The overall examination of the Ukrainian iron and steel industry’s growth and export patterns under post-communism would be incomplete without an analysis of its corporate performance. Therefore, in this subsection the industrial output trends are disaggregated according to sales and export revenues of different iron and steel-producing companies.
By separating the Ukrainian producers of ferrous metals by size, one can see more clearly the difference in scale between them as well as what type of companies has been behind the recent industrial recovery. Figure 11 shows the gross revenue growth figures reported by Ukraine’s largest iron and steel works, while the market sales performance of the small producers of ferrous metals is provided in Figure 12.
Figure 11. Ukraine’s large ferrous metals companies, gross revenue growth, 1999- 2002
Kryvorizhstal Mariupol Illich
Azovstal Zaporizhstal
Dniprodzerzhynsk Alchevsk Nikopol Ferroalloys
Nyzhniodniprovsk
Donetsk Dnipropetrovk
Petrovka Dniprospetsstal
Zaporizhzhia
Ferroalloys Makiivka KirovMetalen Yenakieve Yenakieve ISTIL-DMZ 0
1,000,000 2,000,000 3,000,000 4,000,000 5,000,000 6,000,000
1999 2000 2001 2002
Ukrainian hryvnia
Kryvorizhstal Mariupol Illich Azovstal
Zaporizhstal Dniprodzerzhynsk Alchevsk
Nikopol Ferroalloys Nyzhniodniprovsk Donetsk
Dnipropetrovk Petrovka Dniprospetsstal Zaporizhzhia Ferroalloys
Metalen Yenakieve Makiivka Kirov ISTIL-DMZ
Yenakieve Donetskstal Average sales revenue
Source: Author’s calculations on the basis of Ukrainian Investment Gazette, Top 100:
Reiting luchshykh kompanii Ukrainy 2001 (Kyiv: Ukrainskaia Investitsionnaia Gazeta, May 2001); Ukrainian Investment Gazette, Top 100: Reiting luchshykh kompanii Ukrainy 2002 (Kyiv: Ukrainskaia Investitsionnaia Gazeta, June 2002); Ukrainian Investment Gazette, Top 100: Reiting luchshykh kompanii Ukrainy (Kyiv: Ukrainskaia
Investitsionnaia Gazeta, June 2003).
The first remarkable corporate feature of the post-communist transformation of the Ukrainian iron and steel industry has been the massive difference in sales revenues.
Figure 11 shows that in 2002, the annual gross revenue of an average large Ukrainian steel company approached 2 billion hryvnia (over US$ 370 million), while each of the two steel giants – Kryvorizhstal and Mariupol Illich – sold steel products worth well over US$ 1 billion. Figure 12 indicates that the corresponding figure for Ukraine’s small steel
producers, predominantly tube-rolling mills, has been just 158,000 hryvnia or US$
30,000.
Figure 12. Ukraine’s small ferrous metals companies, gross revenue growth, 1999- 2002
Nikopol Niko Tube Novomoskovsk Stakhanov Tube
Ferroalloys Khartsyzsk Tube
Kremenchuk Steel Zaporizhzhia
Abrasive Energomashspetsst Nikopol Stainless al
Tube Nikopol Pivdennyi
Tube
Dnipropetrovsk Comintern
Nikopol UTIST Tube Dnipropetrovsk
Tube
Sumy Frunze Tube Luhansk Tube Silur Kharstyzsk
0 50,000 100,000 150,000 200,000 250,000 300,000
2000 2001 2002
Ukrainian hryvnia
Nikopol Niko Tube Novomoskovsk Tube Stakhanov Ferroalloys Khartsyzsk Tube Kremenchuk Steel Zaporizhzhia Abrasive Energomashspetsstal Nikopol Stainless Tube Nikopol Pivdennyi Tube Dnipropetrovsk Comintern Nikopol UTIST Tube Dnipropetrovsk Tube
Sumy Frunze Tube Luhansk Tube Silur Kharstyzsk
Average sales revenue
Source: Author’s calculations on the basis of Ukrainian Investment Gazette, Top 100:
Reiting luchshykh kompanii Ukrainy 2001 (Kyiv: Ukrainskaia Investitsionnaia Gazeta, May 2001); Ukrainian Investment Gazette, Top 100: Reiting luchshykh kompanii Ukrainy 2002 (Kyiv: Ukrainskaia Investitsionnaia Gazeta, June 2002); Ukrainian Investment Gazette, Top 100: Reiting luchshykh kompanii Ukrainy (Kyiv: Ukrainskaia
Investitsionnaia Gazeta, June 2003).
Another major finding is that it is the large steel companies that have emerged as the locomotive of the industry’s revival; the sales reported by the big companies have been registering a steady growth tendency, whereas the small producers’ sales figures have been in decline. Figure 13 indicates that, similarly to the overall gross revenue trajectory, the largest Ukrainian steel companies have appeared to be the biggest exporters as well.
However, most recently, the export sales have not been growing as fast as the overall market sales. Moreover, except for the constantly expanding Kryvorizhstal Iron and Steel Combine and the other four largest companies, the sales performance of the majority of Ukraine’s steel firms has been rather erratic. This tendency can be observed most vividly in the field of exports as illustrated in Figure 13.
Figure 13. Ukraine’s iron and steel companies export growth, 1999-2002
Kryvorizhstal
Mariupol Illich
Azovstal Zaporizhstal
Dniprodzerzhynsk
Donetsk
Makiivka
Alchevsk Nikopol
Nyzhniod Petrovka
Dn.spetsstal Zaporizh
Metal ISTIL-DMZ Yenak
Novomosk Stakhanov
Khartsyz
$0
$100,000,000
$200,000,000
$300,000,000
$400,000,000
$500,000,000
$600,000,000
$700,000,000
$800,000,000
$900,000,000
$1,000,000,000
1999 2000 2001 2002
Kryvorizhstal Mariupol Illich Azovstal
Zaporizhstal Dniprodzerzhynsk Alchevsk
Nikopol Ferroalloys Nyzhniodniprovsk Tube Donetsk
Dnipropetrovsk Petrovka Dniprospetsstal Zaporizhzhia Ferroalloys
MetalenYenakieve Makiivka ISTIL-DMZ
Yenakieve Novomoskovsk Tube Stakhanov Ferroalloys
Khartsyzsk Tube Average exports trend line
Source: Author’s calculations on the basis of Ukrainian Investment Gazette, Top 100:
Reiting luchshykh kompanii Ukrainy 2001 (Kyiv: Ukrainskaia Investitsionnaia Gazeta, May 2001); Ukrainian Investment Gazette, Top 100: Reiting luchshykh kompanii Ukrainy 2002 (Kyiv: Ukrainskaia Investitsionnaia Gazeta, June 2002); Ukrainian Investment Gazette, Top 100: Reiting luchshykh kompanii Ukrainy (Kyiv: Ukrainskaia
Investitsionnaia Gazeta, June 2003).
Thus, the disaggregated data analysed in this subsection allow for the following conclusions. First of all, the overall sales performance of the Ukrainian iron and steel companies has generally corresponded with the overall industry’s recovery and economic growth in Ukraine. However, while the production of major ferrous metals has been steadily increasing in absolute volume as well as in terms of sales since 1996, the annual revenues and export performance of the majority of the Ukrainian steel companies have been rather erratic. A small number of ferrous metals companies have recently taken the leading market positions, whereas the majority of Ukraine’s steel companies have been lagging far behind, and some are in an apparent decline.
EFFICIENCY
Industrial growth understood as an increase in the volume of output or sales is the first criterion of a sector’s economic performance. Another essential criterion for the assessment of industrial performance is efficiency. Economics is primarily focused on an abstract Pareto-optimal efficiency of perfect competition, where ‘no one could be made better off without making someone else worse off’. Three are three types of economic efficiency discussed in the literature. Roughly defined, the first type is productive efficiency, in which the output of the industry is produced at the lowest cost. The second is allocative efficiency, in which resources are allocated to the production of the goods and services the society requires. The third is distributional efficiency, in which output is distributed in such a way that consumers would not wish – within their disposable income and market price constraints – to spend these incomes in a different way (Bannock, Baxter, and Davis 1992: 127).
As economists emphasise, maximum economic efficiency can exist only in an ideal-type economy, in which perfect competition characterise every sector. By focusing on the efficiency of the real-world economic system, one aims at measuring the effectiveness with which a system uses its resources at a given time (static efficiency) or through time (dynamic efficiency). It is also important to understand different growth experiences, while studying economic systems. As Gregory and Stuart have emphasised:
Economic growth and dynamic efficiency are not the same. The output of a system may grow by increasing efficiency (finding better ways of doing things with the same resources) or by expanding the amount of, say, labour
but using that labour at a constant rate of effectiveness. The former is often termed intensive growth, the latter extensive growth (1999: 44).
It is very difficult to measure economic efficiency, given the technological complexity of the modern manufacturing as well as the lack of data needed to analyse all the types of efficiency both in static and dynamic terms. Furthermore, the allocative and distributional aspects of economic efficiency are typically attributed to a country’s economy as whole rather than to a specific sector or an industry. This research paper’s approach is to focus on the productive efficiency of the Ukrainian iron and steel industry, which is evaluated comparatively on the ‘output per employee’ basis as well as in terms of enterprise profitability. As in the previous part of the paper, this section uses the statistical data set which has been specifically assembled to reveal the performance patterns of Ukraine’s ferrous metals industry during the post-communist transformation.
Figure 14 provides the data on labour productivity in a number of the world’s largest steel-producing countries. Various differences in coverage and definition of ‘employment in the steel industry’ exist: in some countries the entire ferrous metals industry’s workforce is included, while in other countries the steel industry’s employment covers only the shop floor. Furthermore, some national statistical agencies provide the employment data for the ferrous metals sector, whilst other agencies cover the employment in the ‘manufacturing of base metals and metal products’, which include non-ferrous metals as well. Given the International Iron and Steel Institute’s own conclusion that ‘inter-country comparisons are of dubious value’ (2003: 19), one has to be cautious in this regard. The labour productivity data on Ukraine and Poland presented in Figure 14 are directly comparable as they have been gathered specially for this paper following the analogous techniques. The productivity figures for other major steel- producing countries were calculated on the basis of the steel employment data provided by the IISI. Figure 14 shows that labour productivity in the two East European steel industries has been significantly lower throughout the entire period than in any other major steel industry, for which the data are available. Even after a considerable recovery in labour productivity terms which has been achieved in Ukraine since 1995, the average Ukrainian steel worker produces currently only 70 per cent of his 1990 output level.
Comparing to the ferrous metals sector in the other countries, the average Ukrainian steel worker produces only 76 per cent of the average Polish steel worker’s output, 18 per cent of the average Brazilian steel worker’s output, 14 per cent of the average EU steel
worker’s output, 11 per cent of the U.S. output per worker level, and 10 per cent of the average South Korean steel worker’s output.
Figure 14. Crude steel production per employee, 1990, 1995, 2002 Labour productivity
0 50 100 150 200 250 300 350 400 450 500 550 600 650 700 750 800
1990 1995 2002 1990 1995 2002 1995 2002 1995 2002 1995 2002 1995 2002 1995 2002 1995 2002 1995 2002 1995 2002
Ukraine Poland CanadaAustralia Brazil South Africa
EU Japan USA South Korea
crude steel output per 1 employee, tonnes
Source: Author’s calculations on the basis of Ukrainian State Statistics Committee, Statystychnyi shchorichnyk Ukrainy za 1999 rik (Kyiv: Technical, 2000); Ukrainian State Statistics Committee, Statystychnyi shchorichnyk Ukrainy za 2002 rik (Kyiv: Technical, 2003); Polish Central Statistical Office, Statistical Yearbook of the Republic of Poland 2000 (Warsaw: GUS, 2001); Polish Central Statistical Office, Statistical Yearbook of the Republic of Poland 2002 (Warsaw: GUS, 2003); International Iron and Steel Institute, Steel Statistical Yearbook 2003 (Brussels: IISI, 2004); International Iron and Steel Institute, World Steel in Figures: 2003 Edition (Brussels: IISI, 2003).
Whether a firm makes a profit or a loss is regarded as the second signal of its productive efficiency. The evolution of profitability rates (understood here formally as total sales revenue minus total production costs) of the Ukrainian iron and steel industry is given in Figure 15. Here the steel industry characteristics are contrasted with the profitability trends of Ukraine’s overall industrial sector. On the whole, the Ukrainian iron and steel industry during the post-communist transformation has been characterised by mediocre and falling profitability rates. It is believed that very high industrial profitability rates of the early 1990s should be regarded with some caution. Following the price liberalisation, the producer prices rose in 1992 by a staggering 4,229 per cent, while the consumer price
index inflation that year was 2,100 per cent. In 1993, the producer price index was up by 9,768 per cent, whereas the CPI inflation rose to 10,256 per cent. In such an unstable environment, Ukraine’s industrial enterprises were able to acquire bank credits under what appeared to be effectively negative interest rates. For example, between 1992 and 1993, the amount of commercial credit debts had grown by 28 times. Figure 15 demonstrates that the profitability patterns of the industrial sector and its steel branch have been roughly similar. Notwithstanding the generally dubious profitability data due to profit underreporting practices, which are wide-spread in most of the post-communist economies, Figure 15 also shows until very recently that the profitability of the Ukrainian ferrous metals industry has fallen considerably and that the production of ferrous metals has been less profitable than the production of other industrial goods. Moreover, the steel manufacturers made no profits in 1997 and even registered a loss the following year. At the very end of the 1999, the Ukrainian ferrous metals companies returned to profit- making.
Figure 15. Ukraine’s annual industrial profitability trends, 1992-2002
-5%
0%
5%
10%
15%
20%
25%
30%
35%
40%
1992 95 96 97 98 99 2000 01 02
annual reported gross profit (=sales-costs)
Iron & steel industry Total industrial sector
Source: Ukrainian State Statistics Committee, Statystychnyi shchorichnyk Ukrainy za 1999 rik (Kyiv: Technical, 2000); Ukrainian State Statistics Committee, Statystychnyi shchorichnyk Ukrainy za 2002 rik (Kyiv: Technical, 2003).
Figure 16 provides the latest available disaggregate statistics concerning the profit figures reported by the largest Ukrainian iron and steel companies. It shows that all but two large
steel companies have registered a massive rise in profits in 2000, with an average gross profit figure approaching 250,000 hryvnia (or US$ 46,000). Nevertheless, from 2001 onward the reported profits of all the companies have been falling yet again.
Figure 16. Ukraine’s large steel companies, reported gross profits, 1999-2002
-400,000 -300,000 -200,000 -100,000 0 100,000 200,000 300,000 400,000 500,000 600,000 700,000 800,000 900,000 1,000,000 1,100,000
1999 2000 2001 2002
Ukrainian hryvnia
Kryvorizhstal Mariupol Illich
Azovstal Zaporizhstal
Dzerzhynsky Alchevsk
Nikopol Ferroalloys Nyzhniodniprovsk
Donetsk Petrovsky
Dniprospetsstal Zaporizhzhia Ferroalloys
Metalen Enakieve Makiivka
ISTIL-DMZ Enakieve
Donetskstal Average profits
Average profits trend line
Source: Author’s calculations on the basis of Ukrainian Investment Gazette, Top 100:
Reiting luchshykh kompanii Ukrainy 2001 (Kyiv: Ukrainskaia Investitsionnaia Gazeta, May 2001); Ukrainian Investment Gazette, Top 100: Reiting luchshykh kompanii Ukrainy 2002 (Kyiv: Ukrainskaia Investitsionnaia Gazeta, June 2002); Ukrainian Investment Gazette, Top 100: Reiting luchshykh kompanii Ukrainy (Kyiv: Ukrainskaia
Investitsionnaia Gazeta, June 2003).
The profit patterns of Ukraine’s smaller ferrous metals companies within the reported period have been even more dismal. Figure 17 indicates that the profits of Ukraine’s tube- rolling and ferroalloy-producing mills have not only rapidly declined, but by 2003 the majority of the smaller companies have been making losses.
Figure 17. Ukraine’s small steel companies, reported gross profits, 1999-2002
-20,000 -10,000 0 10,000 20,000 30,000 40,000 50,000
2001 2002
Ukrainian hryvnia
Nikopol Niko Tube Novomoskovsk
Stakhanov Ferroalloys Khartsyzsk Tube
Kremenchuk Steel Zaporizhzhia Abrasive
Energomashspetsstal Nikopol Stainless Tube Dnipropetrovsk Comintern Nikopol UTIST Tube
Dnipropetrovsk Tube Sumy Frunze Tube
Luhansk Tube Average profits
Average profits trend line
Source: Author’s calculations on the basis of Ukrainian Investment Gazette, Top 100:
Reiting luchshykh kompanii Ukrainy 2001 (Kyiv: Ukrainskaia Investitsionnaia Gazeta, May 2001); Ukrainian Investment Gazette, Top 100: Reiting luchshykh kompanii Ukrainy 2002 (Kyiv: Ukrainskaia Investitsionnaia Gazeta, June 2002); Ukrainian Investment Gazette, Top 100: Reiting luchshykh kompanii Ukrainy (Kyiv: Ukrainskaia
Investitsionnaia Gazeta, June 2003).
It should be emphasised, however, that low returns and financial losses have been one of the major features of the world steel industry for a very long time. As the British conservative weekly The Economist has recently put it: ‘Even by “old economy”
standards, steel making is hardly a business that sets pulses racing’ (22 February 2001).
For instance, during the world steel industry’s boom in 2000, the West European steel giants – Arbed, ThyssenKrupp, and Usinor – reported returns on equity to be only between 12 and 15 per cent (The Economist, 23 November 2000). Thus, the lack of spectacular profit figures coming from the Ukrainian iron and steel companies ought to be at least partially attributed to a fiercely competitive environment of the world steel markets. Nonetheless, having considered the efficiency outcome of the post-communist
transformation, one has to conclude that the overall productive efficiency of the Ukrainian iron and steel industry has been very low. The reported profit margins of the overwhelming majority of the steel companies, albeit recovering, are still considerably narrow; and the average Ukrainian steel worker has not only become one of the least productive in the world, but he has been producing less output under post-communism than he used to produce under late state socialism.
STABILITY
In addition to increases in the volume of output that an industry generates over time, and to effectiveness with which an industrial enterprise utilises its available resources, stability is considered to be another essential criterion used in assessing economic performance. This sub-section examines the economic stability of Ukraine’s ferrous metals sector during the post-communist transformation. The focus here is on the industry’s trade (or business) cycles, i.e. fluctuations in growth. The trade cycle, understood as regular fluctuations in the level of income, is a very common economic phenomenon. Although there exists no general agreement in the economic theory about the exact cause of cycles, this problem has been well-studied by a large number of prominent economists, including Kondratieff, Kuznets, Samuelson, Hicks, Goodwin, Phillips and Kalecki. Since the times of the Great Depression in the early 1930s, most governments of industrially advanced countries have been trying to develop an economic policy to reduce the amplitude of the cycle and to stabilise the output on a generally upward growth trend path. The great output contractions experienced during the initial stages of the post-communist transformation have heated the theoretical debate and produced a number of competing approaches. This paper considers possible causes of the post-communist ‘Great Contraction’ of Ukraine’s ferrous metals sector in the next section.
With regard to the economic outcomes of the Ukrainian iron and steel industry, there appears to be two similarly ‘stable’ periods in the industry’s post-communist development. The production of ferrous metals had been steadily declining during the first transformation phase, which lasted until 1996. From then onwards the output as well as the sales of most steel products have been steadily on the rise. Moreover, since the late 1990s, the industry’s most troubled tube-rolling branch has not experienced any major
negative growth trajectory. However, if one examines the two distinct output growth periods jointly, it becomes evident that the performance of the Ukrainian iron and steel industry during the post-communist 1990s has been particularly uneven: a sharp 59 per cent decline in production between 1990 and 1995 has been followed by a fast 36 percentage point recovery by 2004, when the Ukrainian ferrous metals sector approached 77 per cent of its 1990 production level in monetary terms. Furthermore, Figure 18 clearly indicates that the recovery of the Ukrainian ferrous metals sector has been rather unbalanced as well. The annual growth rates have been fluctuating from 8.1 per cent in 1997 to -6.8 per cent in 1998; from 21.3 per cent in 2000 to 3.9 per cent in 2002 and to 19.5 per cent in 2003. Figure 18 also shows that the recovery trajectory of Ukraine’s total industrial sector has been much steadier. Nonetheless, one should accentuate that since the second half of the 1990s, the Ukrainian iron and steel industry has followed a generally upward growth path.
Figure 18. The Ukrainian iron and steel industry’s growth trends, 1996-2003
-10%
-8%
-6%
-4%
-2%0%
2%
4%
6%
8%
10%
12%
14%
16%
18%
20%
22%
24%
1996 1997 1998 1999 2000 2001 2002 2003
annual growth
Iron and steel industry Total industrial sector
Total industry growth trend line Iron and steel industry trend line
Source: Author’s calculations on the basis of Ukrainian State Statistics Committee, Statystychnyi shchorichnyk Ukrainy za 2002 rik (Kyiv: Technical, 2003); National Bank of Ukraine, Osnovni pokaznyky ekonomichnoho i sotsial’noho stanu Ukrainy 2001-2004 roky (Kyiv: National Bank, 2004); Ukrainian State Statistics Committee, Vyrobnytstvo ta tempy pryrostu obsiahiv promyslovoi produktsii: Operatyvni danni (Kyiv: Derzhkomstat, 2004).
Another highly unstable feature of the Ukrainian iron and steel industry during the post- communist transformation has been the corporate profit growth rates. Figure 19 shows that between 2000 and 2002 Ukraine’s ferrous metals companies reported annual profit figures ranging from an average growth of 1540 per cent in 2000 to an average 50 per cent loss in 2001 and 2002. Thus, the era of the post-communist transformation has been an extremely unstable period for the Ukrainian steel companies’ profits. The sales and output growth rates, price levels and profit figures have all registered massive declines to be followed by rather rapid increases both of cyclical and non-cyclical nature.
Figure 19. Annual profit growth reported by Ukraine’s iron and steel companies, 2000-2002
-700%
-600%
-500%
-400%
-300%
-200%
-100%100%200%300%400%500%600%700%800%900%0%
1000%
1100%
1200%
1300%
1400%
1500%
1600%
1700%
1800%
1900%
2000%
2100%
2200%
2300%
2400%
2500%
2600%
2700%
2800%
2000 2001 2002
year on year growth of reported profits
Kryvorizhstal Mariupol Ilych Azovstal
Zaporizhstal Dniprodzerzhynsk Alchevsk
Nikopol Ferroalloys Nyzhniodniprovsk Tube Donetsk
Dnipropetrovsk Petrovka Dniprospetsstal Zaporizhzhia Ferroalloys
Metalen Yenakieve Makiivka Kirov ISTIL-DMZ
Yenakieve Donetskstal Donetsk Metal Rolling
Nikopol Niko Tube Novomoskovsk Tube Stakhanov Ferroalloys Khartsyzsk Tube Kremenchuk Steel Zaporizhzhia Abrasive Energomashspetsstal Kramatorsk Nikopol Stainless Tube Nikopol Pivdenny Tube Dnipropetrovsk Comintern Nikopol UTIST Tube
Dnipropetrovsk Tube Sumy Frunze Tube Luhansk Tube
Average profits Average profits trend line
Source: Author’s calculations on the basis of Ukrainian Investment Gazette, Top 100:
Reiting luchshykh kompanii Ukrainy 2001 (Kyiv: Ukrainskaia Investitsionnaia Gazeta, May 2001); Ukrainian Investment Gazette, Top 100: Reiting luchshykh kompanii Ukrainy 2002 (Kyiv: Ukrainskaia Investitsionnaia Gazeta, June 2002); Ukrainian Investment Gazette, Top 100: Reiting luchshykh kompanii Ukrainy (Kyiv: Ukrainskaia
Investitsionnaia Gazeta, June 2003).
THE INDUSTRY’S POST-COMMUNIST CHALLENGES
To understand whether and how the Ukrainian iron and steel industry can be made sustainable in the long run, one has to question the factors behind the sector’s ‘Great Post- Communist Contraction’ and the industry’s overall unbalanced economic and commercial performance. Firstly, this third part of the research paper considers the applicability of the traditional ‘declining industry’ hypothesis, which is related to the phenomenon of ‘de- industrialisation’ experienced by the industrially advanced countries of the West.
Consequently, this section identifies five fundamental problems that the Ukrainian ferrous metals sector has been faced with under post-communism in the spheres of technology, market access and development, resources, and ownership transformation. It is contended that the relatively poor growth, efficiency, and stability outcomes generated by the Ukrainian steel industry after the collapse of state socialism ought to be attributed to these five central transformation-related variables.
A DECLINING INDUSTRY?
In the 1970s, the major industrially advanced countries began to experience the phenomenon of ‘de-industrialisation’, which was identified with the contraction of output or employment in the industrial sector as a whole, and with a steadily falling share of manufacturing in the total workforce and production. As Ajit Singh and other scholars have argued, in some cases, de-industrialization should be regarded simply as a normal response to changing technology and tastes and does not signify any structural disequilibrium in the economy as whole with malignant consequences (see Singh 1987).
According to the conventional economic theory, an industry’s decline and, ultimately, its disappearance are usually related to the following factors: