INTRODUCTION
The main driver of this mutation of the industry is the incredible progress made in the technological field for supporting space devices. Space thus takes on a totally different meaning in the last decades compared to the last decades of the twentieth century.
BUILDING UP THE SPACE ECONOMY: THE HISTORY
H ISTORY OF SPACE EXPLORATION : FROM OBSERVATION TO EXPLORATION
In the 1840s, after the invention of photography, the first photographs of the Sun and Moon were taken. Moreover, in the last years of the century, spectroscopy was introduced into the study of celestial objects.
H ISTORY OF SPACE EXPLORATION : SPACE EXPLORATION IN THE XX AND XXI C ENTURY
Thanks to the cooperation of the aforementioned agencies (the American NASA, the Russian RKA, the European ESA, the Canadian CSA and the Japanese JAXA), the first International Space Station (ISS) was launched in 1998. Most missions in the ISS are carried out in collaboration between international agencies.
THE NEW SPACE ECONOMY
B OUNDARIES OF THE S PACE E CONOMY : ITS , DEFINITION , THE ACTORS , THE CRITICAL FACTORS AND THE
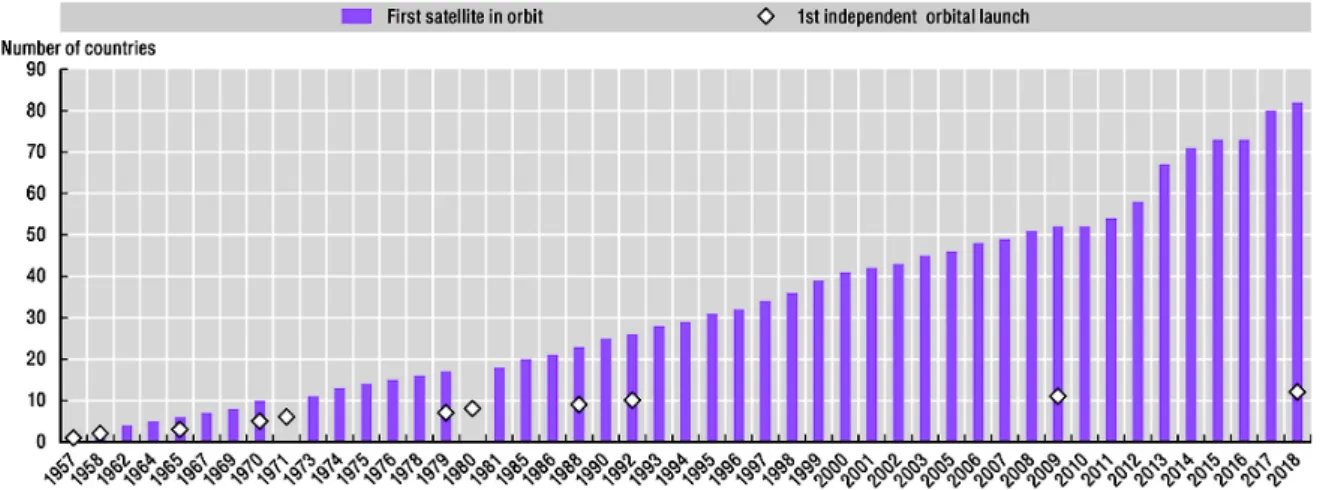
The increase in the number of actors involved in space exploration is due to several critical factors that have promoted and guided the growth of the space industry. Before analyzing the solution that the space industry offers to the problems that exist in all sectors, it is important to consider the main substrate on which the majority of space technologies are based: the artificial satellites.
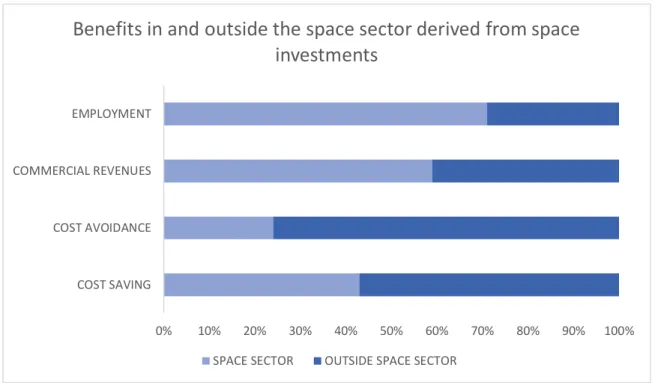
B ENEFITS AND CONTRIBUTION OF THE S PACE E CONOMY IN THE G LOBAL E CONOMY
In addition, private financing of commercial projects has also grown in the last ten years with unprecedented private capital flows in the space sector from angel and venture capital investments. In fact, according to the trends of recent years, the main sources of financing for new companies in the space sector are the founder's own funds with investments from bank loans, equity and government support.
N EW TECHNOLOGIES AND BUSINESS OPPORTUNITIES
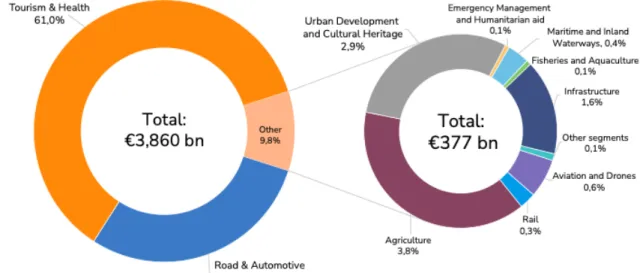
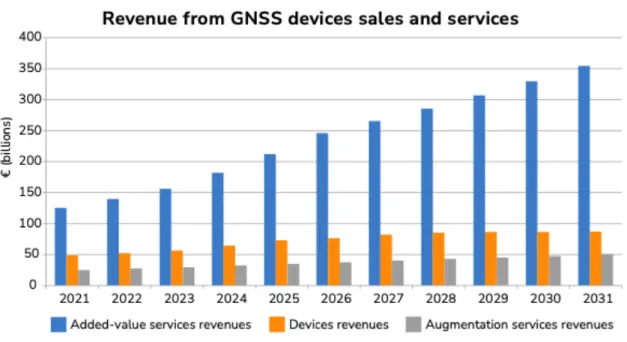
As a result of the latest transformation of the sector in recent years, the future benefits of the space economy are strongly linked to the commercial use of the services offered by the industry. In addition, with EGNOS technology, the quality of service improves year after year.
PLAYERS IN THE SPACE ECONOMY
N ATIONAL & I NTERNATIONAL P UBLIC A GENCIES
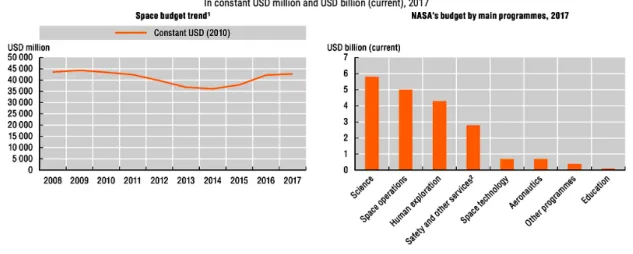
- NASA
- ESA & ASI
The data is just an example of the economic, technological but also social potential that the space industry currently represents. In particular, Italy contributed to the projects by designing and creating a number of technologies and devices of the Galileo programme. The ASI is part of the Italian space economy, whose value has been gradually growing in recent years.
The Strategic Vision Document81, published by ASI in 2016, contains all the main policy guidelines of the agency for the decade between 2016 and 2025. The ASI believes that these activities should be the ones that have major positive side effects in the downstream sector of the space economy.
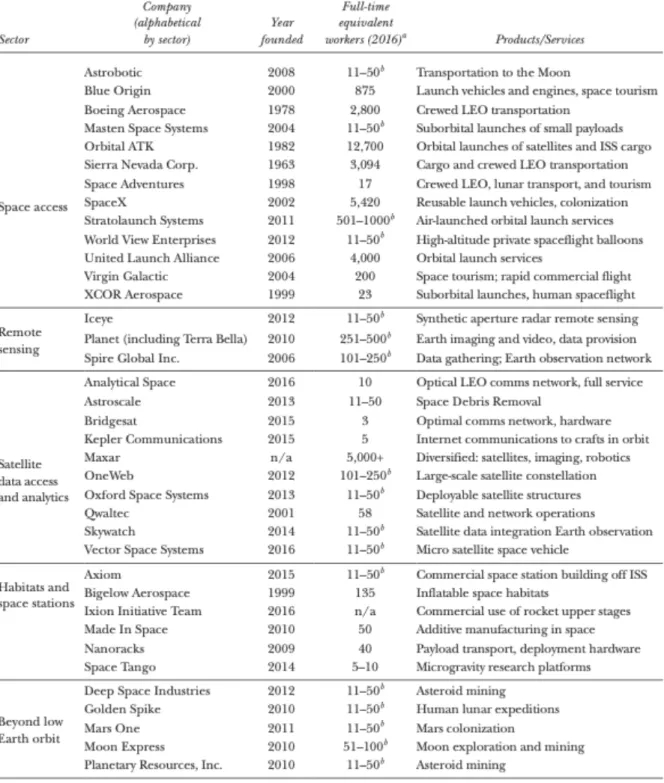
P RIVATE ENTERPRISES IN THE S PACE I NDUSTRY
- Space X & Blue Origin
SpaceX has successfully developed a reusable rocket, which after the first phase of launch returns to the Earth's atmosphere and lands at a specific location. At the same time, many international space agencies plan to return to the moon in the coming years. For this reason, Space
This company is considered one of the most important companies in the world operating in the space sector. This type of mission represents a revolutionary turning point for the space industry, which is finally expanding into the tourism sector as well.
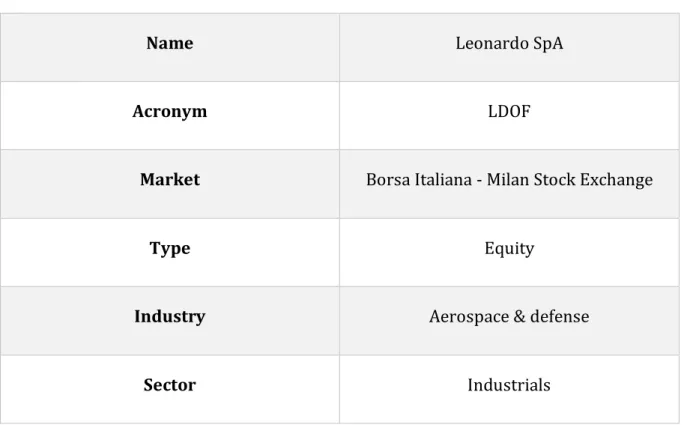
THE ITALIAN SITUATION: A FINANCIAL REVIEW OF LEONARDO SPA, THE ITALIAN
L EONARDO S P A
Furthermore, alliances with international companies over the years have allowed Aeritalia to reach one of the highest levels of technological know-how in that period. The shifts in internal composition also proved to be an important advantage for the Finmeccanica Group in the early 1990s, with the liberalization of markets and increasingly fierce global competition. After more than 15 years of operation, the Thales Alenia Space joint venture is still considered one of the European leaders in the sector (Leonardo SpA, 2022).
111 All the information of the following points comes from the official website of Leonardo SpA (Leonardo SpA, 2022). Avio had been part of the Finmeccanica Group for years and since 2017, Leonardo SpA has been gradually expanding its stake in the company.
R ISK P ROFILE
Considering the return of the stock (𝑅 ) and the return of the market (𝑅𝑚) as the two variables in the equation, according to the CAPM theory, the slope of the formula (𝛽) measures the slope of the regression line and the risk of the stock. The calculation of Jensen's Alpha for Leonardo SpA will be carried out in the second part of this section. For the purposes of this analysis, a good representation of the market is the FTSE MIB index.
Jensen's Alpha (or simply Alpha ) is a risk-adjusted index that measures the performance of the incremental return generated by a stock132. 133 (James Chen, 2020) . in other words, Jensen's alpha measures and compares the performance (and thus return) of a stock against the returns of the overall market.
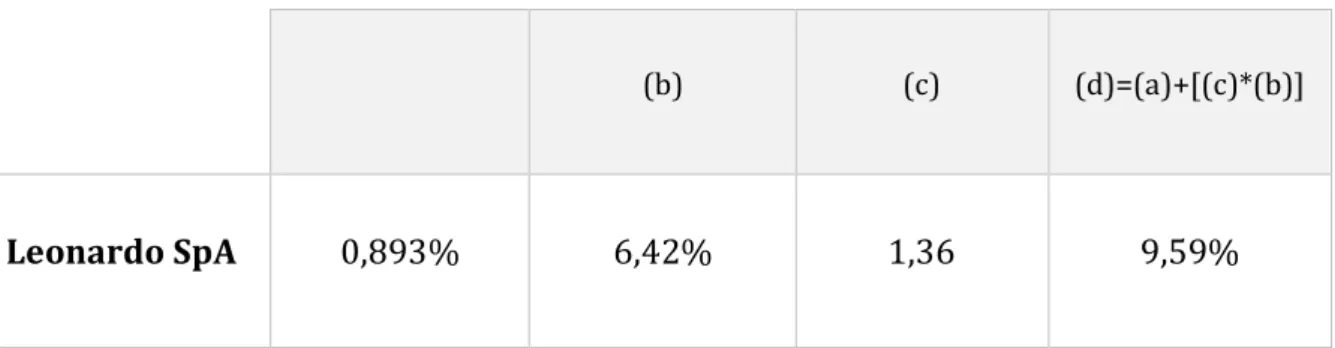
C APITAL S TRUCTURE
Since the level of the risk-free rate (Italian BTP 5 years) is always the same for companies in the same country, the result on the cost of equity depends very much on the level of systematic risk of a company: this means that the beta is the important factor that determines the level of equity costs for companies in the same country (same risk-free interest rate) and the same period (same risk premium). All calculations for the after-tax cost of debt estimation are included in Appendix B. 151 The data is taken from Leonardo SpA's income statement as it is the most updated income statement at the date of the cost of debt analysis (February 2022). that is available to the company.
The next section analyzes the estimation of the weight of debt and of the weight of equity for Leonardo SpA. Since the debt of a company is always listed in its balance sheet, it is possible to estimate the value of the amount of the debt of Leonardo SpA from its most recent balance sheet (published on the 10th of March 2022 and relative to the fiscal year 2021) withdraw ).
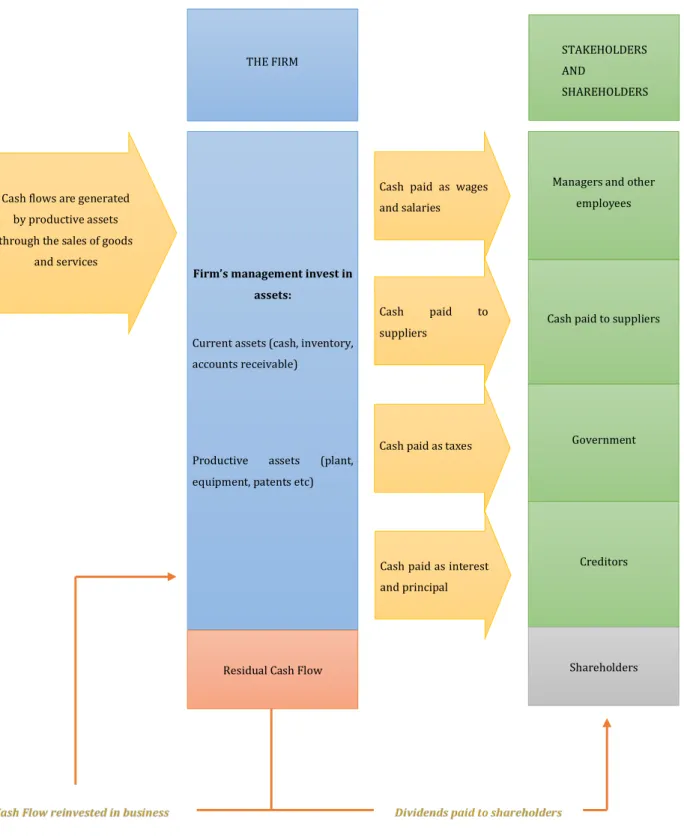
P AYOUT P OLICY
Finally, the company's remaining cash flow can be reinvested in business and/or used to pay dividends to shareholders. The dividend percentage expresses the percentage of the company's earnings that has been paid out as dividends in the past three years167. It is calculated by dividing the total dividend paid in that year by the company's total net income.
On the other hand, a low level of the retention ratio implies a high level of the dividend payout ratio. Furthermore, the reasoning behind the level of the retention ratio is consistent with that behind the dividend payout ratio.
C ONCLUSION AND R ECOMMENDATIONS FOR L EONARDO S P A
Explained in other words, about 45% of the stock's variability can be explained and predicted by the variations that the entire market has (in the analyzed case, by market we mean the FTSEMIB coefficient, which represents about 80% of the Italian listed companies. on the Milan Stock Exchange). The last point of interest provided by the linear regression analysis in fiscal years is the annual value of the Jensen Alpha coefficient. From the investor's point of view, however, what matters most is the composition of the WACC and in particular the weight of equity and the weight of debt.
For Leonardo SpA, it appears that the weight of debt was around 80% of the total, representing the company as particularly dependent on its debt. On the other hand, however, the predictable behavior of the stock leaves less room for those who intend to speculate on market prices.
CONCLUSIONS
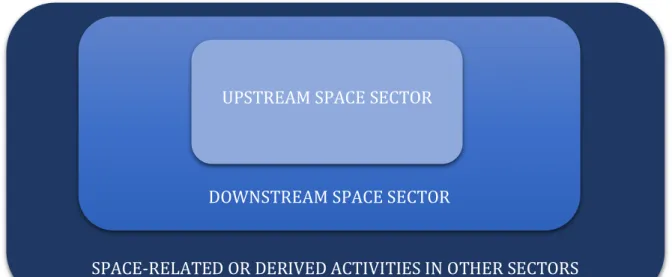
From the upstream point of view, the most relevant example is represented by the Artemis mission, which aims to establish a continuous correspondence with the Moon (and subsequently also with Mars), with the aim of "colonizing" Earth's main satellite. In particular, the satellite industry includes many of the activities that everyone performs on a daily basis (such as web searches, sending e-mails, calls, etc.) that create added economic value for the manufacturer and social value for the end user. Finally, in the last part of the thesis, the analysis of the economic profile of the Italian Leonardo SpA, which has operated in the space industry for several decades, had the purpose of supporting the theses explained in the previous points.
The company, which over the years has contributed to several projects in the space sector, including the construction of various components of the new International Space Station, represents for an investor a mature and solid company, with a capital behavior quite predictable thanks to the annual cost. the payment (with the exception of fiscal year 2020) of a part of the dividends to its shareholders. In conclusion, the space industry and space businesses, thanks to the arrival of private individuals, is undergoing a great boost, which is already creating great benefits and positive spin-offs in neighboring fields and sectors, with solutions that have not only scientific applications, but and commercial, thus giving life to a new branch of the global economy: the New Space Economy.
APPENDICES
However, the logic of the website's automatic calculations remains the same as the formula for calculating a stock's return. Using the monthly returns, a regression analysis was performed on the data collected for the returns of Leonardo SpA against those of the FTSE MIB index. The weights of equity and debt correspond to the percentage contribution of each part to the total amount of capital of the firm:
Data on “Dividends Paid” and on “Total Net Income” are taken from the balance sheets and profit and loss accounts of Leonardo SpA, available in the company's official archive181. The next section shows the financial statement exports for each year and calculates the dividend payout ratio.
Available at: https://www.borsaitaliana.it/borsa/indici/indici-in-continua/dettaglio.html?indexCode=FTSEMIB&lang=en. Available at: https://www.ispionline.it/en/pubblicazione/evolution-space-economy-role-private-sector-and-challenges-europe-28604.