The purpose of the report is to describe the current national freight model system and point out its methodological shortcomings and the lack of data. Improved information on freight flows can be obtained by using more detailed statistics than already used in the development of the freight modeling system for Norway.
Background and approach
Capacity constraints and congestion are not implemented in the network model, therefore it is not necessary to do any interactive iterations between PINGO and NEMO to establish equilibrium. The discussion concerns the possible increase in the number of zones that model principles from national models that can be adapted to the regional scale and new modeling principles, including data requirements.
Principles of NEMO
Further model development and new data to improve the national model are discussed in chapter 2. Finally, chapter 6 outlines possible plans for data collection based on the requirements outlined in chapters 2 to 5.
Principles of PINGO
This is shown in the SAM matrix in terms of transport flows between provinces per commodity group and the transport costs are also shown in the matrix. These changes can be used in the NEMO model to calculate effects on transport activities and thus external environmental costs, etc.
Data used in NEMO and PINGO
- Base matrices, NEMO
- Cost functions, NEMO
- Network, NEMO
- Calibration data, NEMO
- SAM matrices, PINGO
The different sets of values result in rows in the SAM matrix for the economy not adding up to zero. A government sector is used to balance the distribution of the operational surplus commodity in the economy (the corresponding rows of SAM matrix).
Needs for developments and new data to improve the freight model system
- Current principles for representing freight flows
- Proposed improvement of principles and new data for representing freight flows 9
- Improved methodology for transport between business links
- More detailed commodity grouping
- A logistic module
- Terminal activities
Thus, we have already presented some logistics in the basic matrices used in NEMO (i.e. we treat the wholesale connection as part of the logistics chain). The interim report discusses the development of the logistic model in the context of the current Swedish and Norwegian basic matrices. They are given to the producing or consuming country to import or export... So the logistics project should consider ports and airports to include them in the OD matrices.
Transport within the zone must be generated by the logistics module and included in the OD matrices”. The logistics model project group recommends removing wholesale W from the PWC matrices and treating it as part of the logistics module and eventually including it again in the output HB matrices of the logistics module.
National versus regional models
Model capabilities and data requirements in the DISTRA model
The aim of DISTRA is to get freight flows and other business transports that are not included in the regional passenger model in Sweden (SAMPERS) at the same zonal level as the SAMPERS model and assigned to the same detailed road network. From SAMS data: Socio-economic data at zonal level (disaggregated from RAPS data into smaller local units). Transportation of goods and services with different types of vehicles on the road network giving traffic work and transport time and costs.
The main development of the Distra model is intended to start with the Samgods model, where the flows of goods within the municipality should be separated and assigned to the Sampers network. The data requirements for the DISTRA core module mainly consist of marked work data, existing data and data from the Swedish Trade Flow Survey.
Zonal level in the national and regional models
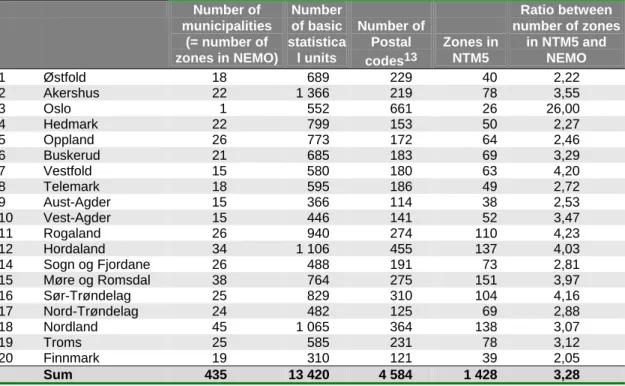
The number of areas corresponding to the different levels of aggregation is shown in table 3.1. To meet the NTM5 level, data sources at the municipality level must be disaggregated, while data sources for the basic statistical unit and postal code must be aggregated. But sometimes it is required to assign freight flows together with passenger flows in the same representation of the transport network to investigate the total capacity utilization.
Number of municipalities, basic statistical unit and NTM5 zones by county. number of zones in NEMO). A suitable regional level outside of Norway in the national model is NUTS2 (corresponding to Norwegian provinces), where the SCENES14 model database could be the source.
Disaggregation principles
- Gains of disaggregating the zone level
- Methods of disaggregating the zone level
- Disaggregation by time
Information from the SCENES database must therefore be combined by the Norwegian foreign trade statistics, and entropy models can be used to ensure delivery patterns between the detailed zones. Indicators can be established based on register data from Statistics Norway, which can be available at postal zone level (see chapter 4.1 for the trade and manufacturing industry). This data can be supplemented with information from the Enterprise and Business Register (Statistisk sentralbyrå) on sales value broken down by main business for each of the 1428 zones.
To derive the pattern of supply from the more detailed data on the production and attraction of goods, marginal gravity models can be used in a manner equivalent to the current model. If passenger and freight traffic are displayed in the same network view, congestion analysis can be performed.
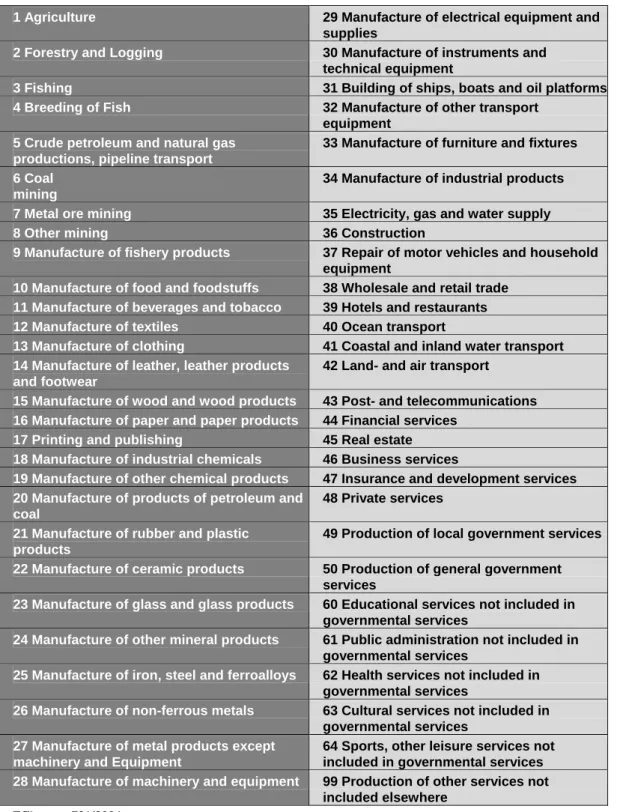
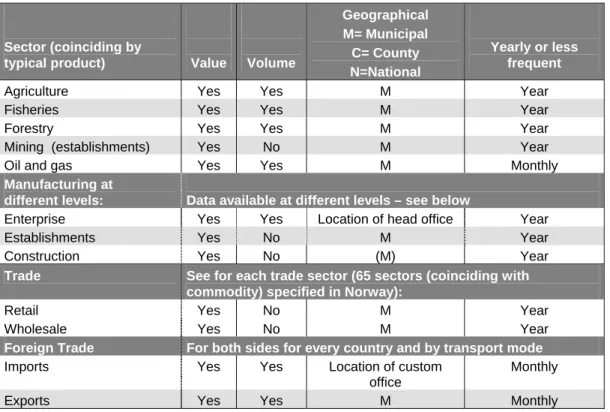
The Trade Statistics and the Manufacturing Statistics
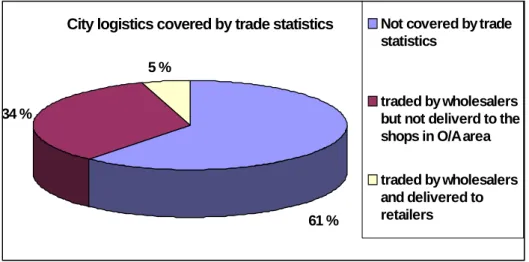
What is covered by using the trade statistics of the transported goods reported by the Lorry Survey in Oslo and Akershus. In contrast to the Lorry Survey (as shown in figure 4.1 for the Oslo/Akershus area), the Trade Statistics do not cover most of the tonnage transported in an area. One way to cover a larger part of freight transport is to develop similar datasets (input and output) for other sectors that use freight transport.
If the company is part of a company with many companies, only the address of the head office is given. This address is of minor importance in cases where no or only a small part of the production is done at the head office.
The External Trade Statistics
New technologies make new possibilities?
- Transport operators
- Seaborne transport
- Business sectors
- Conclusions
However, the port statistics do not cover all shipping in Norway, but a large part of the tons are covered. The cargo level in the Port statistics is approximately 25 sets for the 25 ports that are classified as PortWin ports. For the rest of the public traffic ports (45) that are not classified as PortWin ports, the goods are not specified.
The port statistics do not cover the entire maritime traffic in Norway, but the greater part of the tons is covered. The transport of wood is an important commodity group due to the limitation associated with the need for investments in road capacity.
Possible uses of PANDA
- General about Panda - How does the system work?
- Application of RPC’s for developing of NEMO and PINGO
The production in the region (per sector) is calculated by assuming a constant labor productivity in all municipalities within it. This means that the region's share of production is equal to the region's share of the sector's employment, which can be written as. Investments (J) are calculated using a province-level investment matrix (of supplying and buying investment sectors), using the sum of employment in the buying investment sectors as an indicator.
New coefficients are estimated every time a new project is created in the system, depending on the selected region. It is recommended to further exploit the opportunities offered by the availability of data from the PANDA model for use in the NEMO and PINGO models.
Lorry surveys
A plan for collecting new data should consider the extent to which new data can complement existing data and the extent to which the quality of new and old data is good enough to make possible to create models where the output results are within acceptable errors. Some statistics that have been conducted for several years have undergone some changes that lead to lower data quality. The SSB is now adjusting the annual mileage according to information available from EU controls if the mileage level is recorded by the truck odometer.
Electronic data deduction from the four largest transport operators in Norway with a nationwide network could be a start on the right way to correct for under-reporting and sampling in the Lorry survey.
Coastal surveys
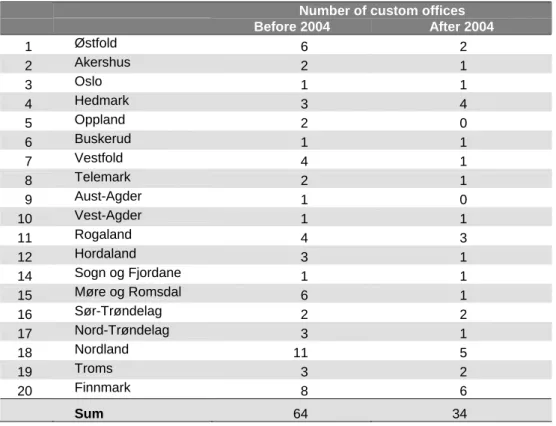
External trade surveys
Closure of toll offices may mean that when toll clearance at the nearest office, it may be in another country. This chapter summarizes the main data needs and recommendations for collecting new data.
Available, but unused data sources
Missing data
Main data needs
- National model
- Regional models
The development of regional transport models will, in addition to the data needs for the national model, also increase needs for more detailed surveys than today's sample in the truck survey, where country-level precision is based on tree-year surveys. Therefore, if regional models are to be established, sample sizes for the study area of the model must be increased. A better alternative is perhaps to use data extraction from the transport operators' computer systems, where information on delivery pattern between zones is available at a more coarse level (eg postcodes).
However, the main challenge is to get a picture of the freight flow, which is caused by the highly dispersed transport marked in Norway, with many one-man companies and a significant but decreasing share of own account.
Different kinds of surveys
- Carrier based surveys
- Roadside surveys
- Commodity flows survey (CFS)
- Shipper based surveys
Most Norwegian coastal ships are privately owned and old (often over 30 years). It is also interesting to compare the results of the STAN model (road routes) with empirical data. The Swedish surveys seem to be more or less a blueprint of the US survey.
The US CFSs are based on tree-stage sampling stratified by 1) Establishments, 2) Weeks of the year, and 3) Outbound shipments. Shipper-based surveys have been regularly carried out in the Netherlands and France since the second parts of the eighties.
Recommendations for future data sampling in Norway
- Data collection in different time horizons
- Other applications of outcomes from a CFS
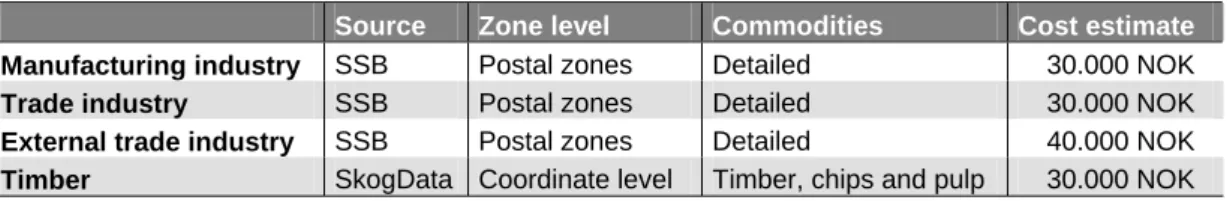
- Cost estimates for further data use and data collections
Disadvantages: Probably more difficult to obtain true estimates of total cargo volume based on a sample by shipper than by industry (as in CFS). Based on the experience of the pilot CFS, implement the full CFS, including service transports. It is rather difficult to give cost estimates for the use of data (production and trade statistics and foreign trade statistics).
Raw cost estimates for more detailed data to establish a more detailed level of aggregation in the freight network models. We would think that the costs of conducting a similar study for Norway would be about the same cost level.
Main conclusion
Annual estimates are provided for the production account - gross output and value added for NA publishing sectors. More detailed estimates (broken down on both the input and output side of the sector. Statistics National Accounts Provinces (NAC): Published by SN on its page on the Internet.
Wage income for the counties where the wages were earned and where they were taxed (based on where the recipients live - an important difference in PINGO). Complete input output tables are published for the years 1973 to 1986 (the input page for each NAC sector is broken down by commodity).