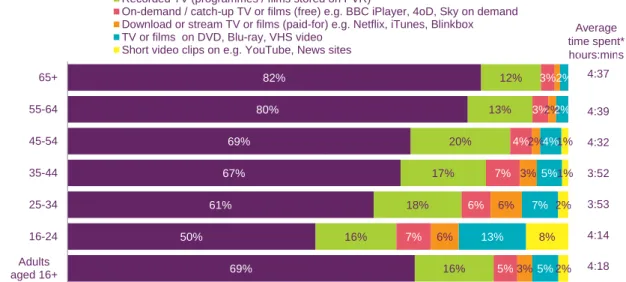
The rest of the report covers television and audio-visual content (page 139), radio and audio content (page 203), telecoms and networks (page 246), internet and online content (page 317) and posting (page 372). Thirty-five percent of the online population claimed to use a set-top box for some form of on-demand or full-service at least once a month – the highest of any device measured.
Communication with friends and family
Social media developments
Next to 'retweet', 'news' is the topic people are most likely to 'tweet' about, with a third (33%) doing so. Overall, one in five online adults (22%) rated between 7 and 10 on a 10-point scale (where 1 meant 'not at all addicted to social media' to 10 'totally addicted to social media').
Digital music and photo collections
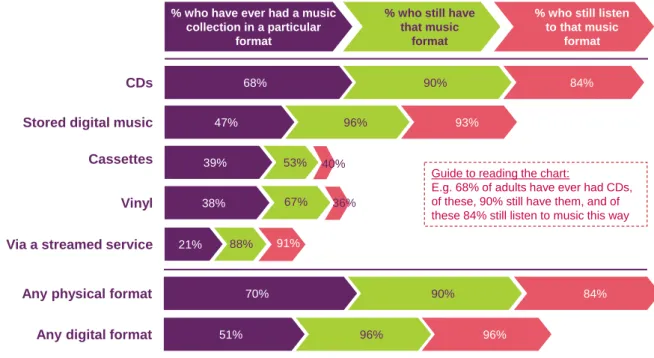
Three quarters of those who have stopped listening to their CD collections now listen to music in digital formats. Younger adults are more likely than older adults to take more photos each week: 34% of those aged 16-24 say they take more than ten photos each week, with 8% claiming to take more than 50.
Media literacy: the past decade
The proportion of internet users citing internet-related concerns has dropped from seven in ten (70%) in 2005 to half (51%). For example, six in ten (60%) internet users say they would give their home address online but are worried about it, up from 46% in 2005.
Developments in the nations
In Wales, the increase in the use of on-demand make-up services was greater than in the UK. Two-thirds (64%) of homes with a television have a digital video recorder (DVR), although this figure has only increased by 2 percentage points over the past year, suggesting that growth in use is beginning to slow.
1 The market in context
Developments in viewing beyond traditional television 49
Communication with friends and family 85
Digital music and photograph collections 109
Introduction and structure
- Introduction
Fast facts
Key market trends
- UK communications market revenue
- Household spend on communications services
- Availability of communications services
- Take-up of services and devices
- Time spent on communications services
- Purchasing communications services in a bundle
- Satisfaction with communications services
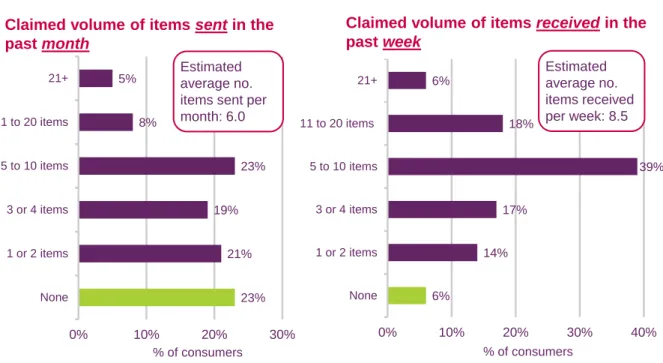
Ofcom's residential mail tracking survey shows that adults in the UK claim to receive an average of 8.5 pieces of mail – including letters, cards and parcels – in an average week (Figure 1.12). Consumer satisfaction remained relatively the same year on year for the communication services shown in Figure 1.15.

Changes in TV viewing habits
- Introduction
- Key findings
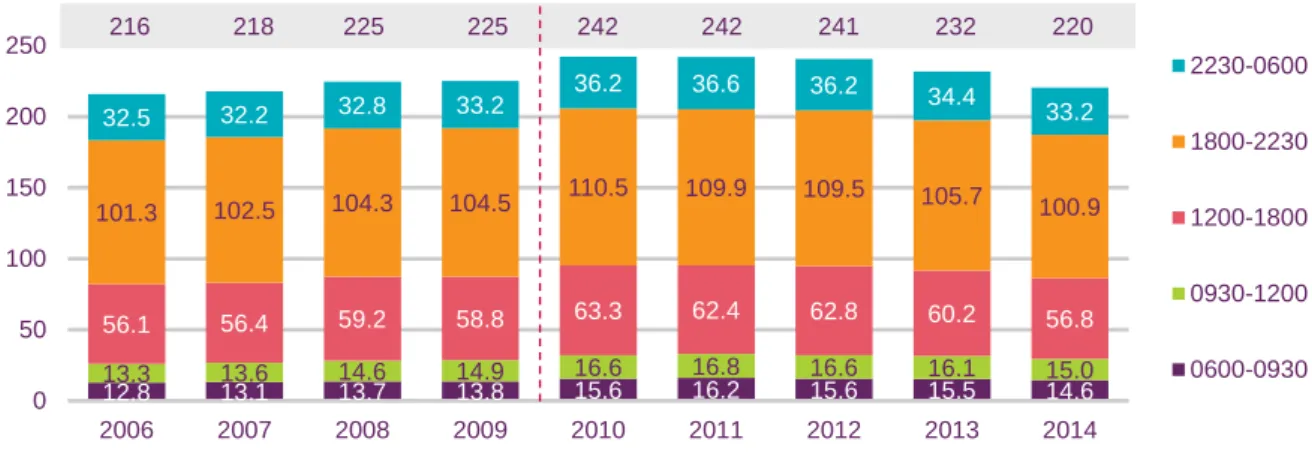
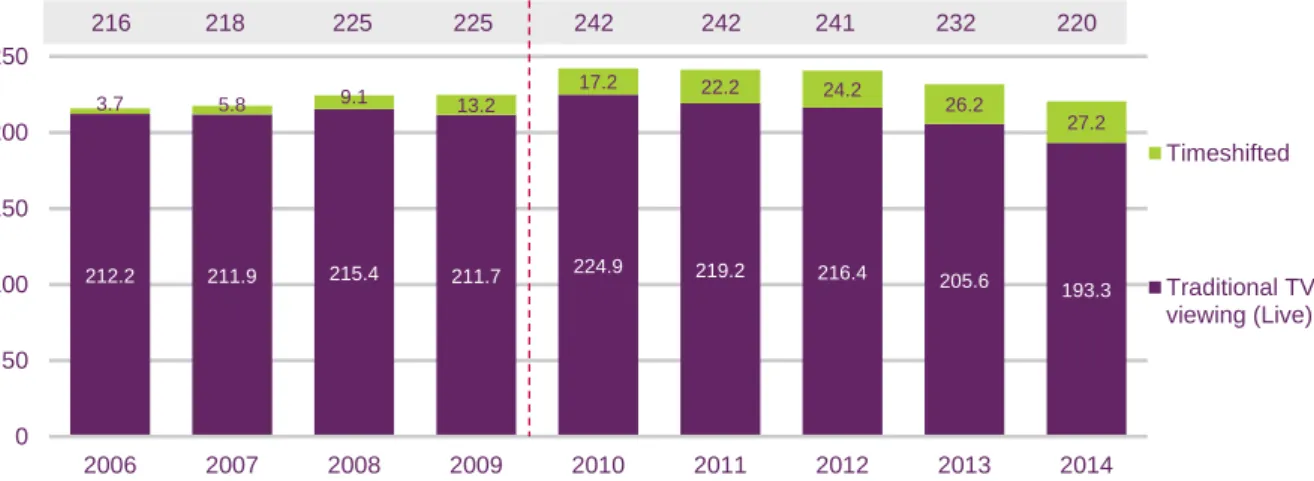
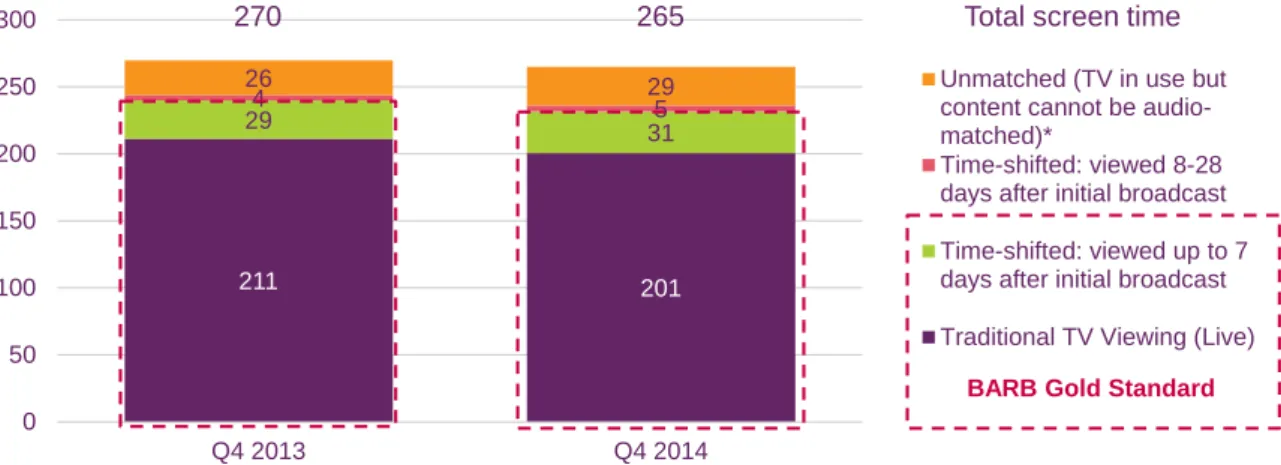
"Broadcast Television" refers to television programs viewed on the television set live at the time of broadcast (traditional television viewing), recordings of these programs or viewing of these programs through catch-up player services (referred to as time-shifted) up to seven days after they were televised. Traditional TV viewing' refers to TV programs that were seen live at the time of broadcast on the TV.

Developments in viewing beyond traditional television
- Introduction
- Key findings
- Changes in the viewing landscape
- Consumer research on changes in viewing habits
Computers and smartphones are more popular than set-top boxes among 16-24-year-olds for accessing on-demand and catch-up services. Computers and smartphones are more popular than set-top boxes among 16-24-year-olds for accessing on-demand and catch-up services.
A smartphone society
- Section overview
- Key findings
- Smartphone take-up
- Smartphone: personal importance
- Smartphone activities
- Smartphone etiquette
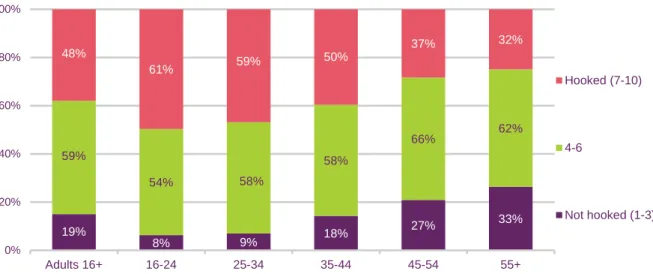
About three-fifths of smartphone users think it is unacceptable to use a mobile phone in cinemas or theaters (60%) or in restaurants with others (59%). Almost half of smartphone users (48%) claim high connectivity levels (7 or higher), which equates to 29% of all adults. A significant portion of smartphone users also use their phones for transactional activities, including online shopping (45%) and online banking (44%).
Around three-fifths of smartphone users think it is unacceptable to use a mobile phone in cinemas or theaters (60%) or in restaurants with others (59%). Almost four-fifths (78%) of smartphone users say they have used their mobile phone in this situation.
1.6.7 4G: summary of coverage and take-up
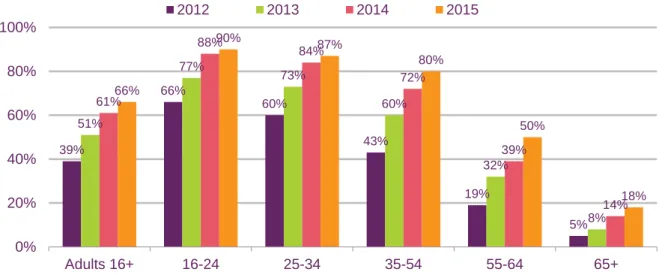
A fifth of smartphone users admit to having used their phones in a cinema or theater Although mobile phones seem to be a permanent part of people's daily lives, in some social situations many people feel that using a mobile phone is unacceptable. Despite this, 45% of smartphone users admit to having used their device in a restaurant and a fifth (22%) admit to having used it when in a cinema or theatre. According to Ofcom's Technology Tracker, 66% of the UK population are smartphone users (see Figure 1.43 in 'A Smartphone Society').
The Technology Tracker also shows that 30% of UK adults have access to the 4G network, while 45% of smartphone users say they have 4G. Comparing age profiles, 4G users tend to be younger than non-4G smartphone users, and our latest survey shows that 71% of smartphone users with access to the 4G network are aged between 16 and 44, compared to 56% of smartphone users without 4G access.
1.6.8 4G: online access
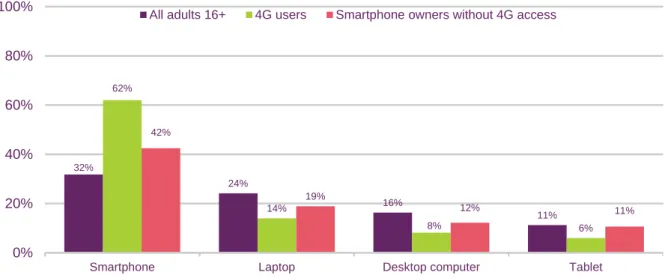
For most of this analysis, we define 4G users as those who say they have 4G on their smartphones and who use it to access the Internet. 4G users are more likely than smartphone owners without 4G access to use mobile internet outside the home. Fifty-five percent of smartphone owners without 4G access use WiFi to access the Internet when they're not at home, falling to 47% of 4G users.
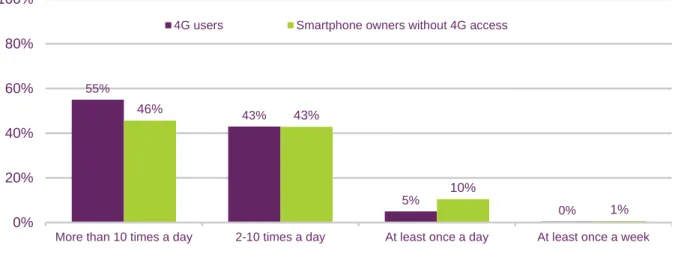
4G users are more likely to use their mobile network to access the Internet (87% of 4G users vs. 69% of those without 4G access). More than 10 times a day 2-10 times a day At least once a day At least once a week 4G users Smartphone owners without 4G access.
1.6.9 4G: smartphone use
Nearly three in five 4G users say they are 'addicted' to their mobile phone, compared to almost two in five of those without 4G access. Looking at how this compares between 4G users and those without 4G access, we can see that nearly three in five (58%) of 4G users describe themselves as. Looking at each end of the scale, 12% of 4G users say they are "completely addicted" to their mobile (a rating of 10), compared to 4% of those without 4G access.
In contrast, almost one in ten smartphone owners without 4G access (9%) say they are "not connected at all" to their mobile phone, compared to 3% of 4G users. 4G users are likely to have more apps downloaded on their smartphone than those without 4G access.
1.6.10 4G: online activity
Communication with friends and family
- Introduction
- Key findings
- Attitudes to online communications
- Communication methods: close personal networks
- Communication methods: more distant contacts
Half of all online adults (51%) agree that interrupting face-to-face online conversations, and a fifth (20%) agree that they spend too much time online compared to spending real time with friends and spend family. A fifth of all online adults agree that they spend too much time online compared to spending real time with friends and family. Half of all online adults (51%) agree that interrupting face-to-face online conversations, and a fifth (20%) agree that they spend too much time online compared to spending real time with friends and spend family.
While meeting face-to-face remains a preference for many (37%), social media is preferred by about one in five (17%) of online adults. Two-fifths of online adults prefer to use mail to send a birthday or greeting card.
Social media developments
- Introduction
- Key findings
- Adult social media use
- Teenagers aged 12-15: social media use
- Twitter use
- Attitudes towards social media
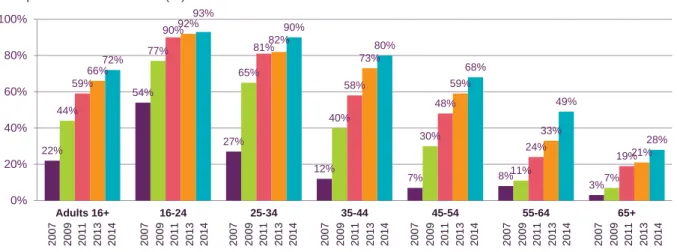
More than seven out of ten adult Internet users (72%) have a profile on social media, and the use of social media is correlated to age. As shown in Figure 1.75, almost all (97%) adults with a social media profile say they use Facebook. IN27 – How often do you visit social media or apps using any device.
More than 10 times a day 2-10 times a day Once a day Less often than daily Proportion of all adults with a social media profile. One in five (19%) also agree that they have posted things on social media that they wish they hadn't.
Digital music and photograph collections
- Introduction
- Key findings
- Take-up of digital and physical formats: music
- Attitudes to digital and physical formats: music
- Take-up of digital and physical formats: photos
- Frequency of taking photos
Just under three-quarters (72%) of those who still have physical formats but no longer listen to them say they now listen to collections in a digital format. But over-55s who no longer listen to their physical music collections are more likely to have stopped listening to music collections in any format (69%) compared to just 6% of those aged 16-34. Almost a third of those who no longer have or listen to their music collections say they no longer have the equipment to play them.
The portability of digital music is rated by many who have this type of collection at 50%. Thirty-four percent of 16-24-year-olds say they take more than ten pictures each week, with 8% claiming to take more than 50.
Media literacy: the past decade
- Introduction
- Key findings
- The media landscape in 2005
- Changes since 2005
Most Internet users use technical indicators such as locks and system messages to measure the security of a website, and this has increased since 2005 among over-25s. However, four in ten (43%) internet users say they read only briefly. website terms / privacy statement. Since 2005, respondents have been asked to what extent they agree that Internet users should be protected from viewing inappropriate or offensive content online.
Base: Anyone who goes online at home or elsewhere on any type of device (1609 in 2014) IN35E: Internet users should be protected from seeing inappropriate or offensive content. The majority use technical indicators such as padlocks and system messages to measure website security, and among the over-25s this has increased since 2005. In 2005, six in ten (59%) internet users said they could block computer viruses with it.

Developments in the nations
- Introduction
- Key findings
- Television and audio-visual content
- Internet and online content
- Telecoms and networks
- Radio and audio content
- Post
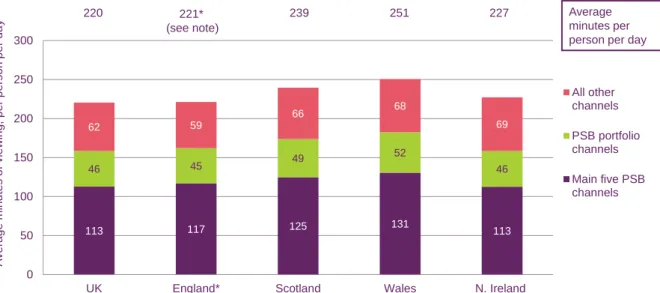
On average, people in Wales watch the most TV in the UK (251 minutes per day) On average, people in Wales watch the most traditional TV (live content watched during broadcast time) in the UK (251 minutes per day) ), while people in England they watch the least (221 minutes a day). It has risen to 66% of UK adults (67% in England and 63% in Wales, Scotland and Northern Ireland). People in Scotland listen to the radio less than those in other countries of the UK.
More than a third of adults in Scotland (36%) have not sent any mail in the past month, the highest among UK countries. Adults in Wales also receive more mail than those in other parts of the UK.
2 Television and audio- visual
Key market developments in TV and audio-visual 145
Key market developments in TV and audio-visual
- Industry metrics and summary
- TV industry revenue up 3.1% in 2014 to £13.2bn
- Internet-connected TVs on the rise while HD growth slows and 3D falters
- The majority of TV viewing is of traditional live TV, but this has recently declined
Net advertising revenue rose overall by 3.9% to £3.8 billion in 2014, although not all broadcasters experienced an increase in advertising revenue, as outlined in Figure 2.3 Figure 2.2 Total TV industry revenue , according to source: 2014. The most popular method of connecting a TV to the Internet is via a set-top box (such as a Sky+, Virgin TiVo or YouView box). Connected TV owners watch audiovisual content from a wide variety of sources Figure 2.9 shows the activities most often undertaken by adults using the Internet connection on their TV set, and shows that connected TV users watch audiovisual content from a range of different sources.
As illustrated in Figure 2.10, the most common reason among connected TV users for watching free-to-air streaming services is to watch programs that have been missed at the time of transmission (78%), although about a third (32%) also they turn to complementary services if there is nothing they want to watch on scheduled TV when they want to watch TV. 50 This figure differs from the 73.2% for 2014 cited in Figure 2.15, which is based on BARB data and is the total television viewing audience aged 4+ who have access to a DVR.

- The TV and audio-visual industries
- Summary
- Television industry revenue
- TV revenue among multichannel genres
- Spend on UK television programmes
- UK independent sector
- Spend on first-run UK-originated content by the main five PSB channels
- Television output on the PSB channels
- Television output and spend in the multichannel sector
- The TV and audio-visual viewer
- Summary
- Platform take-up
There was a 6% increase in peak hour entertainment and comedy production on the five main PSB channels in 2014. The collective reach of the other 64 channels is greater than that of any of the main five PSB channels. Since 2004, the average weekly reach of all five main PSB channels has declined.
The total share of the five main PSB channels is highest in digital terrestrial homes. Each of the five main PSB channels gained a larger share in digital terrestrial homes, except for Channel 4.