The number of pilots with hydrogen-electric propulsion is much lower than for battery-electric vehicles. Cost competitive prospects are better (and production maturity is already more advanced) for battery-electric vans.
Emission reduction objectives
Objectives for the phase-in of zero-emission technology in the National
Today’s policy instruments for the forced phase-in of zero-emission technology 4
This incentive can be increased by increasing the depreciation rate for electric vehicles, so that a greater part (or all) of the higher investment costs of electric vans can already be depreciated for tax purposes in the year of purchase of the vehicle. For vehicles used for own transport, the tax situation of the firm that owns the vehicle depends to a lesser extent on profit margins in the transport sector.
Alternative propulsion technologies available today
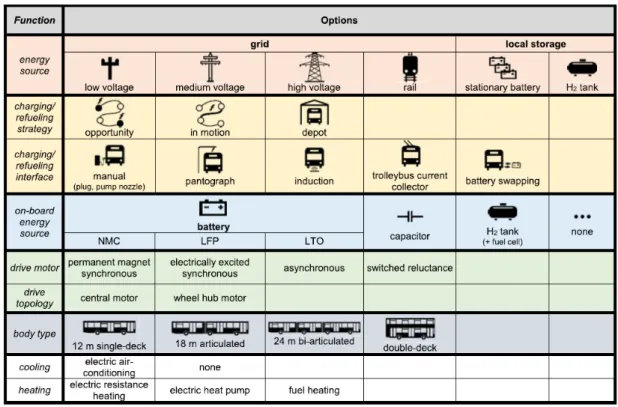
This chapter serves as an up-to-date technical overview of available technologies and focuses on the technological readiness of zero-emission battery-electric and hydrogen fuel cell propulsion solutions, especially applied to heavy transport sectors (buses and trucks) as studied in MOZEES. In line with the research objectives of RA4, zero-emission propulsion technologies (battery-electric and hydrogen fuel cell) will thus be focused on in this chapter.
Battery-electric solutions
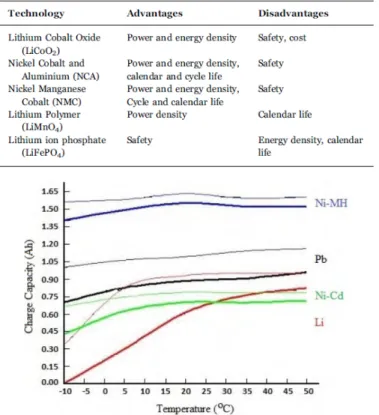
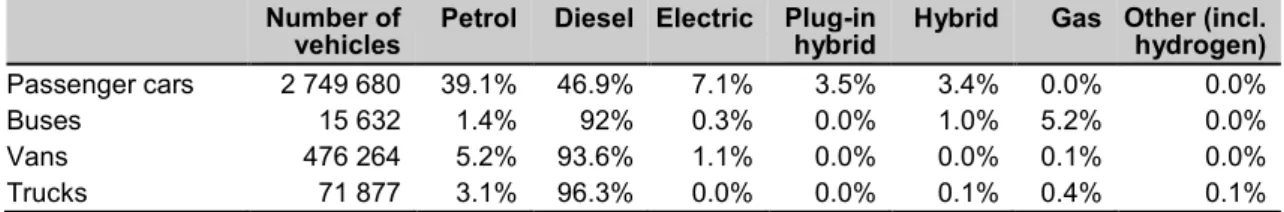
For comparison, an overview of light goods vehicles (vans), which are currently on the market, and which are expected to be on the market soon (from the year 2018), are shown in Table 3.6 and Table 3.7 respectively (Jordbakke, Amundsen et al. 2018). This is due to the differences that can be found within batteries, even of the same category (Berckmans et al. 2017).
Hydrogen/fuel cell solutions
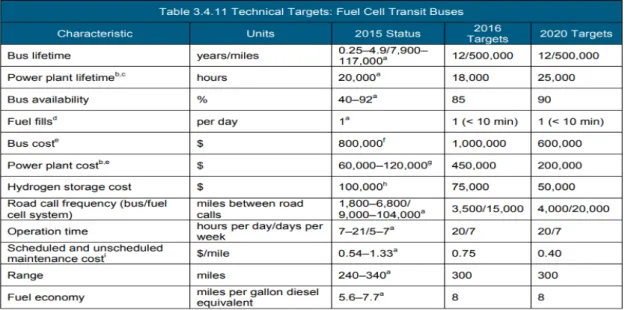
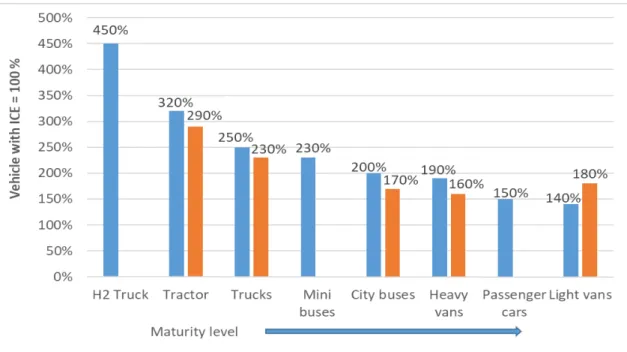
Fuel cell power requirements for different classes of trucks vary, as shown in Figure 3.16. Instead, most published plans for series production of fuel cell heavy-duty vehicles focus on long-haul transport.
Interview methodology
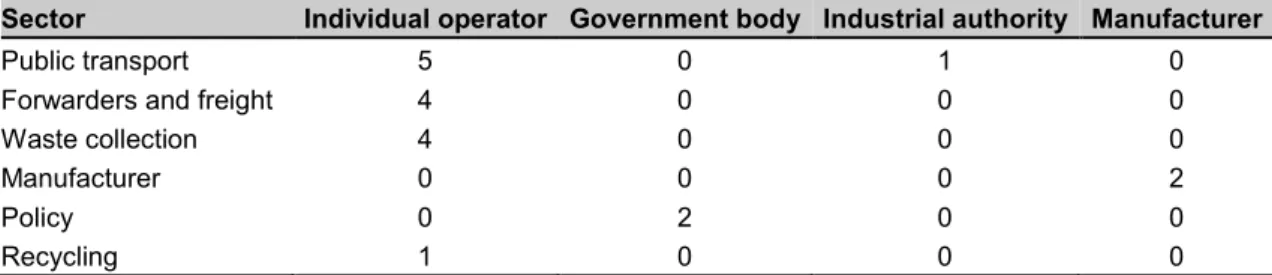
Table 4.1 provides a summary of the interviews conducted (stating the type of sector and entity in question). In preparation, test subjects were sent a questionnaire prior to the interview sessions (see appendix 1 for an example32).
Analysis methodology
Limitations
Introduction
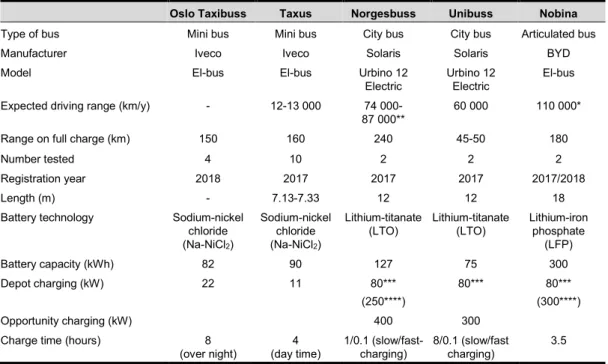
The trials
Procurement process
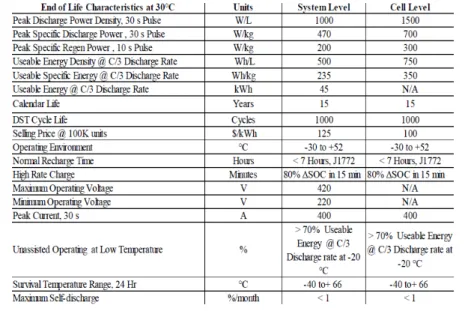
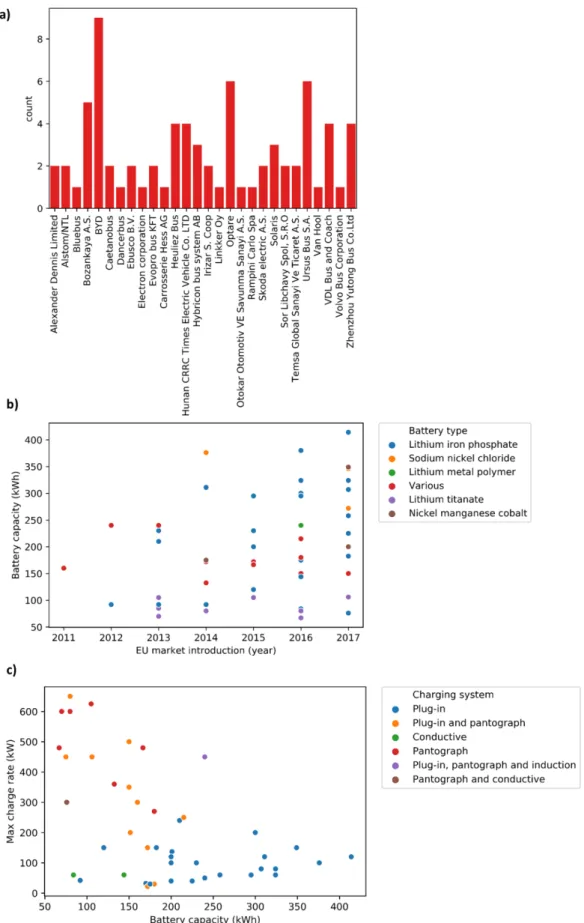
Battery and charger technology
An advantage of this choice is that the operating temperature is 270-320 °C, giving little difference in the summer and winter performance of the battery itself. Loading the pantograph with the arm lifting up from the bus (rather than down) is popular as it is thought to minimize wear and tear.
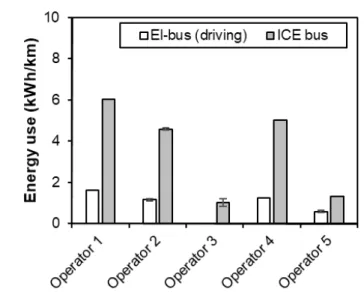
Experience from operation
Nevertheless, for one city bus operator, the additional height of the E-bus compared to ICE vehicles caused a particular problem on a line due to low underpasses. However, more buses are still needed for the same amount of passenger transport on heavy and frequent routes, due to the additional time to load the buses during the day.
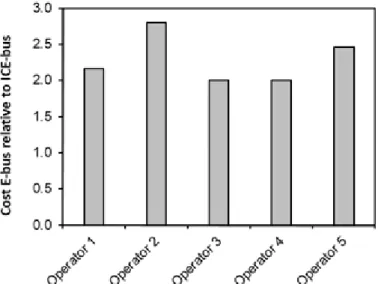
Costs
However, one operator added that additional indirect costs were incurred by them due to the fact that a large stock of old ICE buses (which would otherwise have been sold) had to be kept as a reserve for E-bus periods. Regarding maintenance costs, one operator commented that regular services are cheaper than for regular ICE buses, due to the lack of brake wear and oil changes; although it was too early to know for sure, they believed the costs to be about 20-30% lower than for a similar ICE engine bus.
Future outlook and discussion
Due to their significant cost, the question of whether batteries should be replaced during the life of the bus is of paramount concern to operators, but little information is available for risk assessment.
Introduction
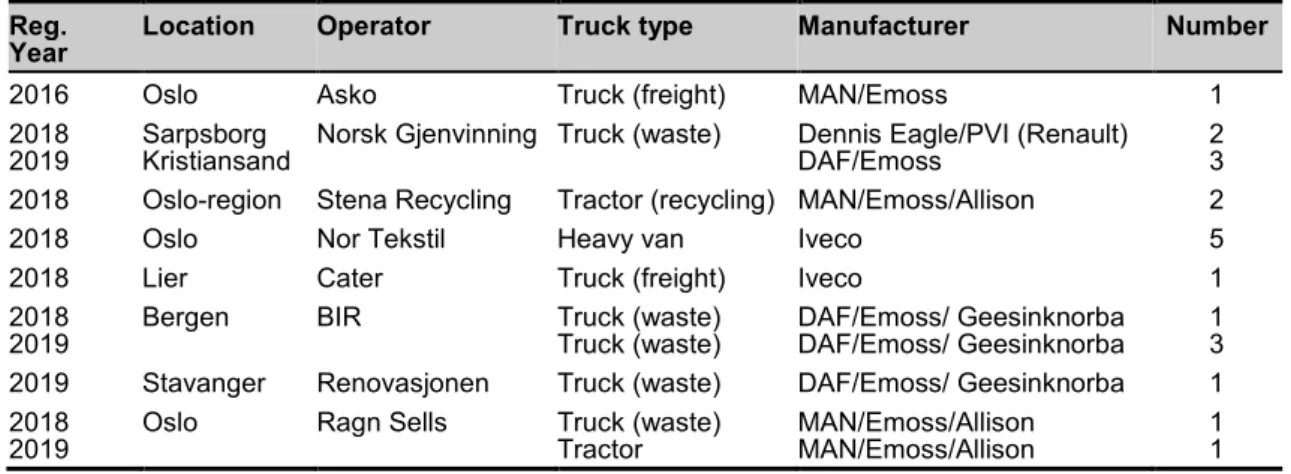
The trials
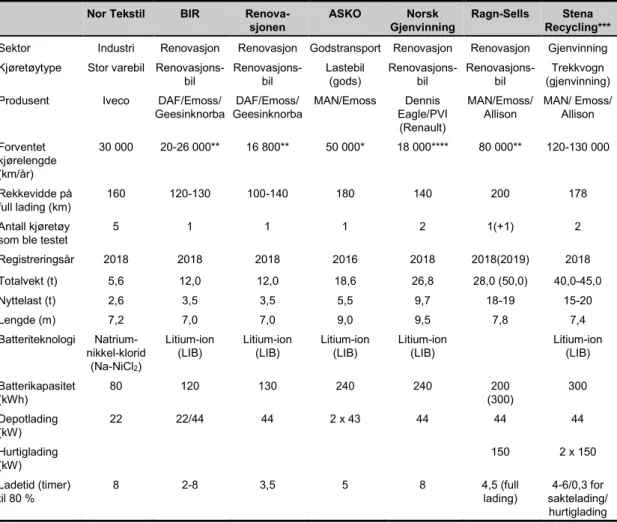
The trials (columns) listed in the table are sorted by gross vehicle weight, with subsequent operator analysis given in random order for anonymity. Sector Manufacturing Waste collection Waste collection Freight transport Waste collection Waste collection Recycling Vehicle type Heavy van Truck (waste) Truck (waste) Truck (cargo) Truck (waste) Truck (waste).
Procurement process
Battery and charger technology
Experience from operation
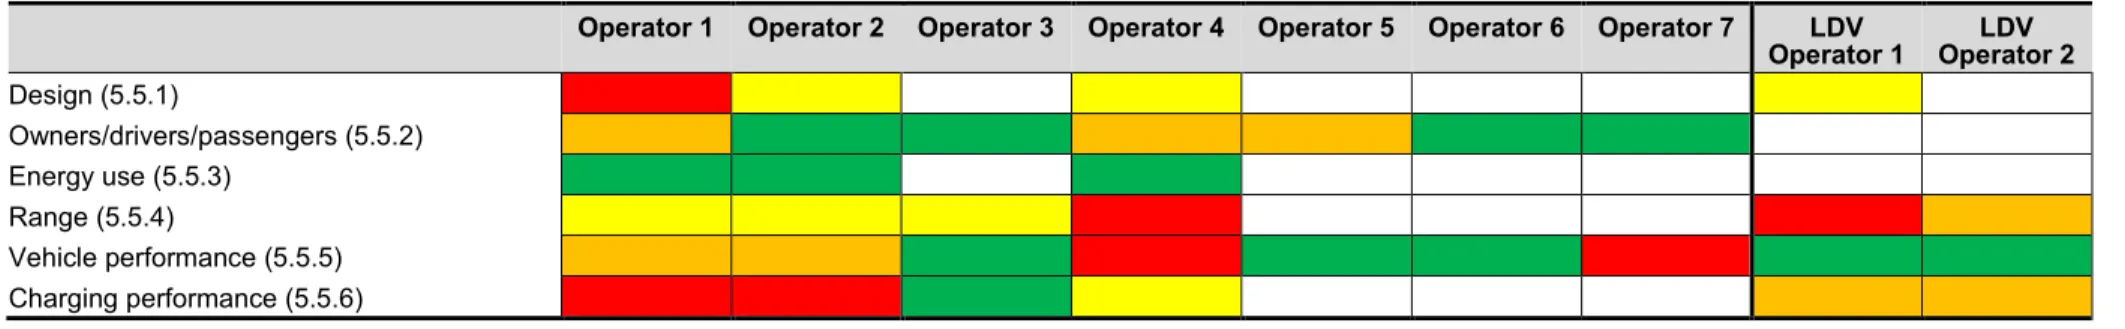
Although the design of the E-trucks did not cause major problems, some user comments were made about the lack of focus on (reducing) the specific vehicle weight in the body (and associated weight increases due to battery, cooling unit and insulation). Some problems were also related to the cold Norwegian winter climate, with one of the vehicles sometimes unable to charge outdoors, necessitating indoor facilities.
Costs
Reasons given were significant battery weight and in some cases, battery position in the vehicle. For the battery-electric LDVs, the vehicles are often leased for periods of 4-5 years, as leasing a vehicle eliminates uncertainties about the vehicle's residual value for transport operators.
Future outlook and discussion
Similarly, the additional time required for charging during the workday (apart from time spent on mandated rest and/or lunch) will also translate into lost income and reduced cargo capacity. In the current chapter, we assess the potential for electrification for Norwegian commercial vehicles based on the user pattern for different categories of vehicles.
Data and methodology
Both the literature review in Chapter 3 and user experiences in Chapters 5 and 6 indicated that load capacity and range limitations for battery electric vehicles are seen as the main obstacles to their potential market introduction in the short to medium term. User requirements regarding the minimum range that electric vehicle alternatives must have to be suitable for the user are set at each vehicle's maximum daily mileage during the reporting period.
Potential for electrification in a short term
Finally, Figure 7.13 shows the cumulative proportion of semi-trailer tractors for different maximum daily mileages. Maximum daily mileage (km) for individual tractors with semi-trailers, supplemented by adjusted distances in the case of charging options.
Potential for electrification in a long term
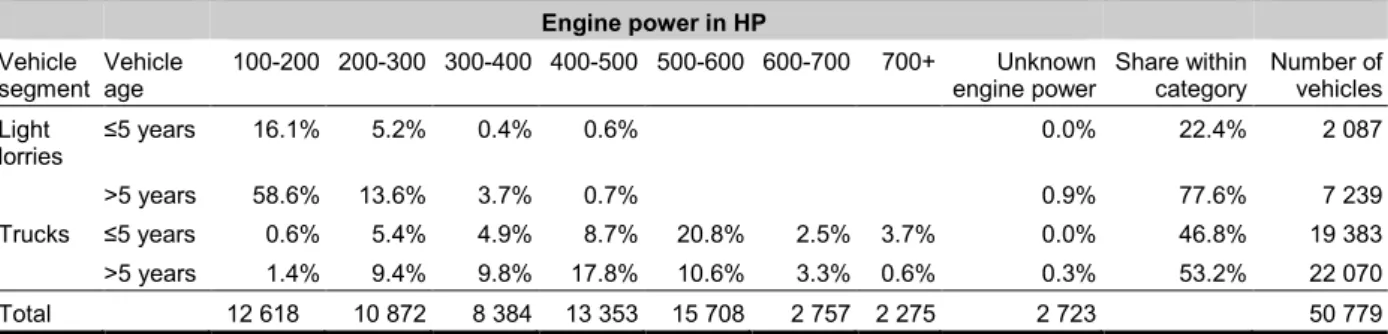
Most journeys, both in terms of number of journeys and vehicle kilometres, are clearly carried out by trucks with engines in the 500-600 HP category. It can be seen that of the total number of journeys, more than 45% are driven without a trailer.
Conclusions
Introduction
Methodology
Technology-dependent cost components
This limited number is one of the reasons for the greater focus on battery electric vehicles in our analysis. In our analysis, we used a discount rate of 3.5%, based on an upward adjustment from the rate used in the National Transport Model46.
Technology-independent cost components
However, the environmentally differentiated component of the annual weight allowance is small (less than NOK 1 400 per year for the heaviest diesel vehicles with Euro V engines, up to several hundred NOK for lighter vehicles or vehicles with Euro VI engines). Our model therefore assumes that these costs are the same for all technologies, with parameters based on regularly updated estimates for the different vehicle types, from the National Freight Model.
Costs of filling and charging infrastructure
Introduction
Scenarios
In the fourth scenario, we assume mass production of battery electric vehicles, which implies a significant reduction in the cost premium for both heavy-duty vehicles and vans. In the model, mass production is operationalized as battery electric vehicles costing 1.5 times the cost of conventional diesel vehicles, while the investment cost of hydrogen-powered vehicles (heavy duty vehicles only) is assumed to have fallen to double the level of conventional vehicles.
Base scenario/early phase
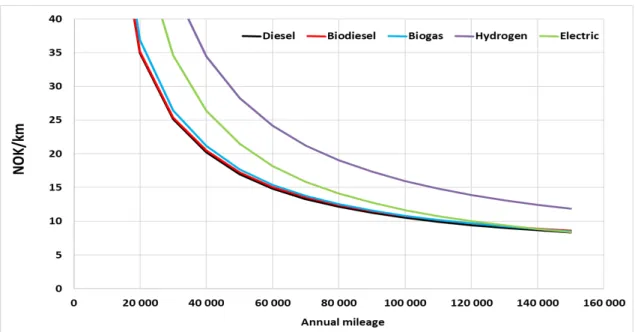
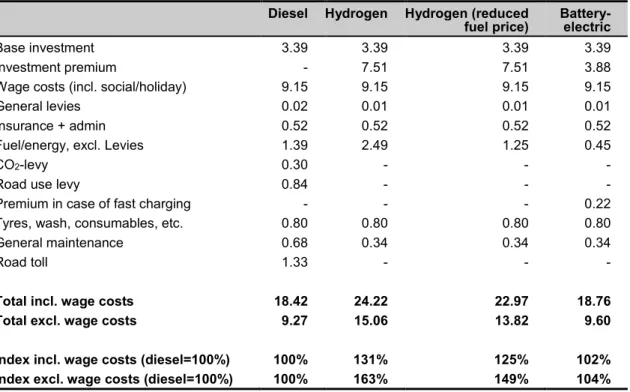
For light distribution trucks, unrealistically high annual mileage is currently required for battery electric vehicles to be cost competitive with (bio)diesel or biogas operation (especially with current range limitations and charging requirements). All in all, at the mileages assumed here, the vehicle-related cost of ownership for battery-electric heavy-duty distribution trucks is 55% higher than for diesel driving, while hydrogen use is 128% more expensive.
Small-scale series production (current and reduced hydrogen prices)
Compared to the early stage scenario, small-scale serial production significantly reduces the cost per km for battery electric light distribution vehicles. For small vans, a breakdown of ownership costs for diesel and battery electric operation is given in table 9.7 (with an annual mileage of 20,000 km).
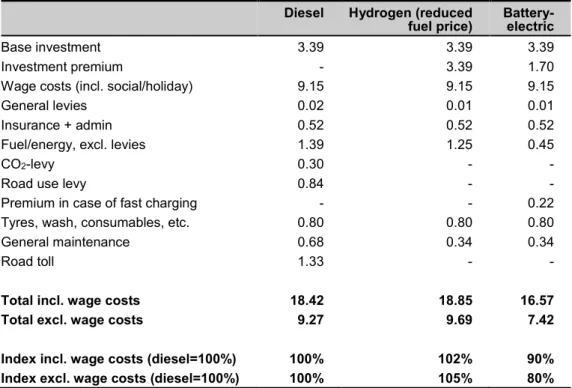
Mass production
For small vans, table 9.12 shows a cost breakdown for diesel and battery-electric propulsion in a mass production scenario (assuming an annual mileage of 20,000 km). We also notice that battery-electric propulsion in mass production can become considerably cheaper than diesel propulsion for medium-sized vans.
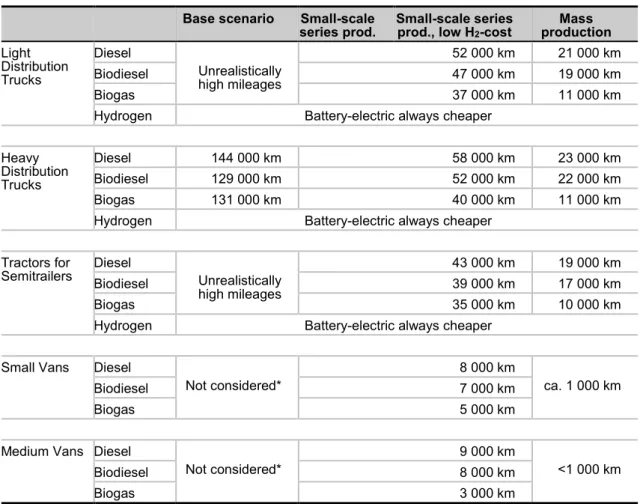
Cost and competitiveness benchmarking
Minimum annual mileage (km) required for battery-powered vehicles to achieve lower cost of ownership per km compared to other propulsion technologies. In the scenario with smaller series production of larger battery electric cars, we see that these become competitive compared to diesel at annual mileage of between approx.
Status and potential
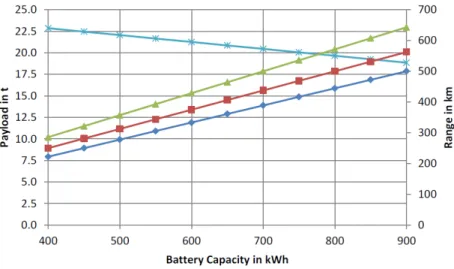
There is some correlation between the length of the route and a higher battery capacity, which shows some degree of bus design for specific usage plans. However, contrary to what might be expected, charging solutions (depot or event) and battery size are not highly correlated with the topography of the route on which the E-buses were used.
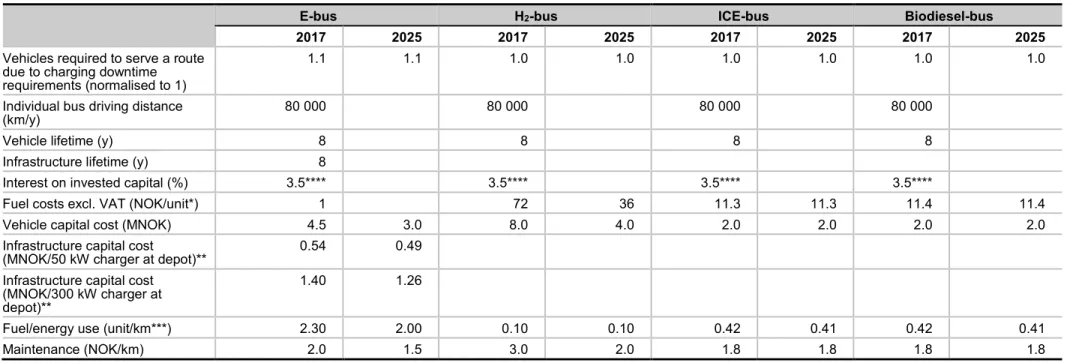
Cost analysis: method and assumptions
The e-bus is assumed to have <300 kWh batteries and charging infrastructure (electricity at NOK 1.0/kWh (Amundsen, Bruvoll et al. 2018)). Note: parameters are adapted from previous analysis (Hagman, Amundsen et al. 2017, Amundsen, Bruvoll et al. 2018) based on interviews.
Cost analysis: results
Sensitivity analysis
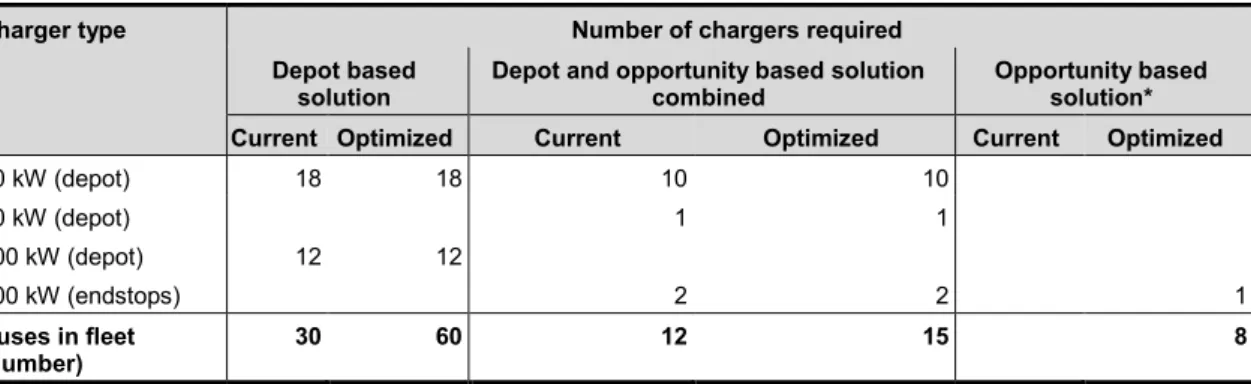
As can be seen, depot charging and optional charging represent the charging solutions with the lowest TCO, with expected optimizations in the year 2025. Where a mixture of depot charging and optional charging is used, the high costs of the optional charging points are not offset. over a high number of buses.
Adaption of zero-emission vehicles
User experiences
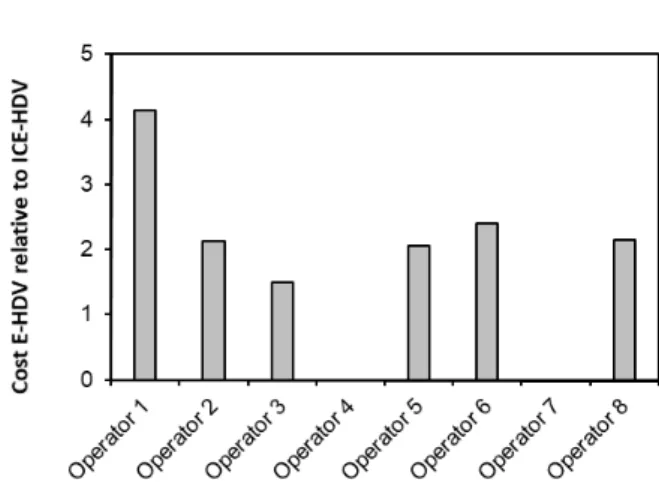
The biggest challenge regarding electric HDVs is their high upfront cost compared to similar ICE vehicles. This means that, although operating and maintenance costs are comparable (or lower), total ownership costs are currently higher for these vehicles.
Barriers
Potential for electrification
This also means that producing the same level of service may require a larger number of vehicles.
Ownership costs
The charging strategy for the modeled E-buses was assumed to be based on depot charging due to the difficulties experienced by operators (currently) in installing opportunity charging in city centres, and was based on the number and type of chargers/buses used. by an interviewed operator. The chosen charging solution must be carefully dimensioned and planned and will be route dependent.
Measures
34; Klimasats - støtte til klimasatsing i kommunene." Hentet 1. oktober 2019 fra https://www.miljokommune.no/Temaoversikt/Klima/Klimasats---stotte-til- klimasatsing-i-kommunene/. 34 ;Tilskudd ordninger for lokale utviklingsprosjekter." Hentet 1. oktober 2019 fra https://www.regjeringen.no/no/sub/stedsutvikling/tilskudsordninger- for-stedsutviklingsprosjekter/id2363141/.
Example of a questionnaire used in the interviews
Ladeinfrastruktur (hvor oplades bilen og er der et problem med manglende ladeinfrastruktur), type ladestik, omkostninger til etablering af opladning ved opladning af bilen).
Assumptions used in the cost models
For battery electric vehicles and hydrogen powered vehicles, 50% discount in the early stage scenario and 25% in the small-scale series production scenario Heavy distribution truck (closed unit) 23% of the original value.