Vision Zero has been officially adopted as the basis for road safety policy in Sweden. The first stage is to identify road safety measures that have the greatest potential.
An epidemiological approach to the definition of road safety problems
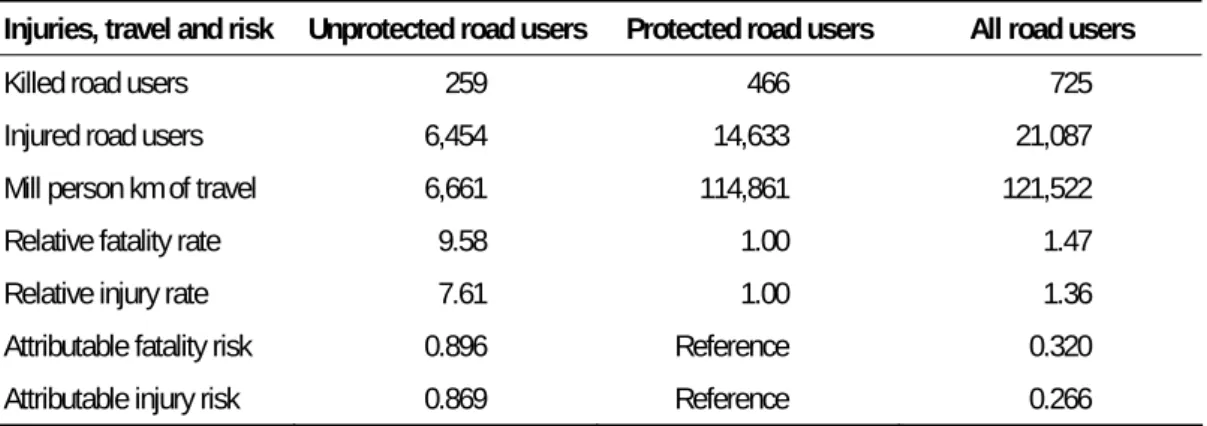
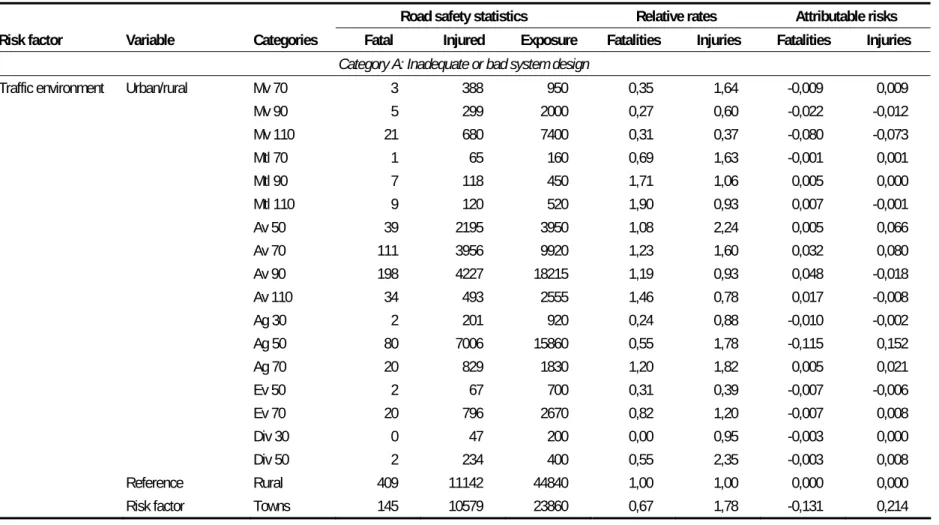
It is seen that vulnerable road users are at risk of being killed, which is almost ten times higher than the risk of protected road users. The overall or population-attributable risk to vulnerable road users is the contribution that their increased level of risk makes to the total number of people killed or injured.
Problem perceptions underlying current road safety policy and Vision Zero as
The zero vision provides a useful framework for assessing the importance of the road safety problems in table 2. The fourth category of road safety problems (group D) concerns road users' compliance with the rules that the system designers have drawn up.
Levels of intrusion into road user liberty in road safety policy
Progress in solving these problems does not necessarily require that changes be made in the design of the system, but it does require that road users change their behavior to the extent that they are currently breaking the rules governing road user behaviour. Injury prevention policy should, in other words, infringe as little as possible on the freedom of road users with regard to the amount of travel, the manner of travel and behavior during travel.
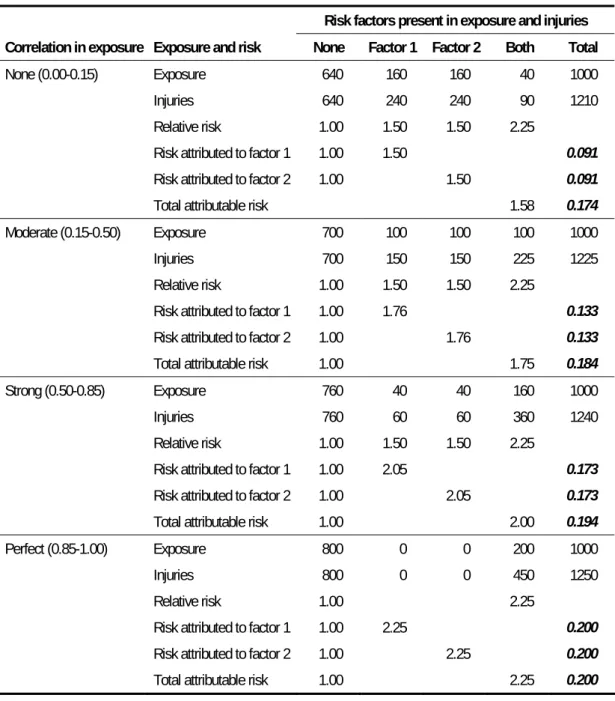
The treatment of correlations between risk factors – uncertainties in
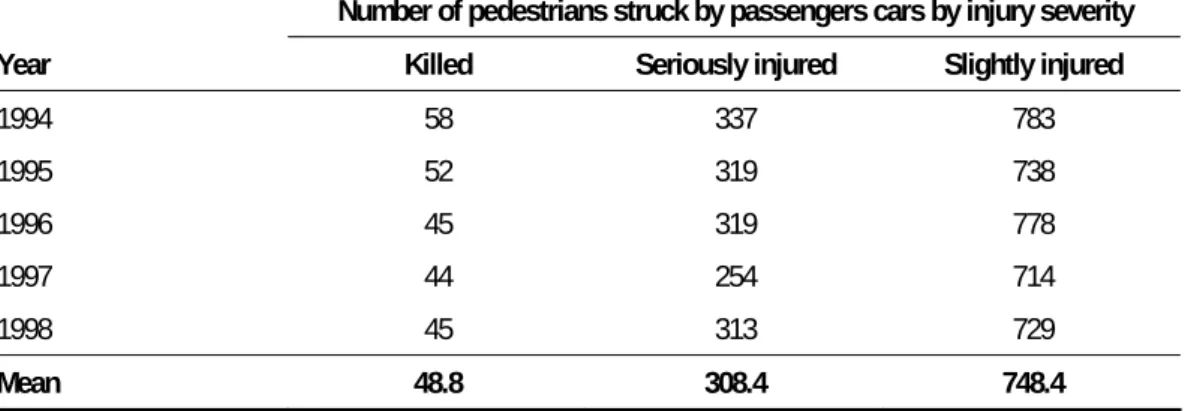
The bias in simple estimates of attributable risk becomes greater the greater the correlation in exposure to the two risk factors. Each estimate of attributed risk is related to the average annual number of traffic injuries in Sweden in 1994–1998.
A preliminary quantification of important road safety problems in Sweden
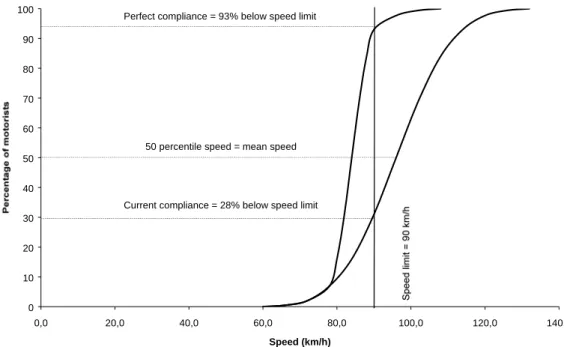
Perfect speed limit compliance was defined as a speed distribution where 90-95% of all motorists adhere to the speed limit. Most crashes at intersections take place in built-up areas and thus contribute to the high risk there.
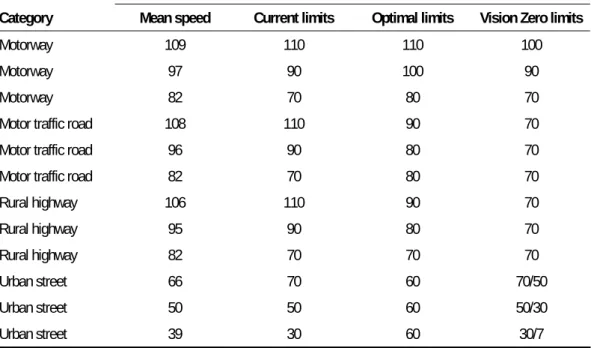
Speed limit system and classification of road network in Vision Zero
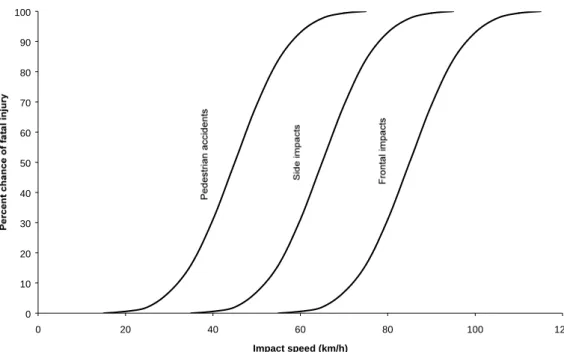
The possible policy interventions related to speeding include police enforcement of the current speed limits (level of intrusiveness = 3) and the introduction of a new speed limit system based on Vision Zero. A general speed limit of 50 km/h is assumed on main streets in the city, reduced to 30 km/h at crossing facilities for pedestrians and cyclists.
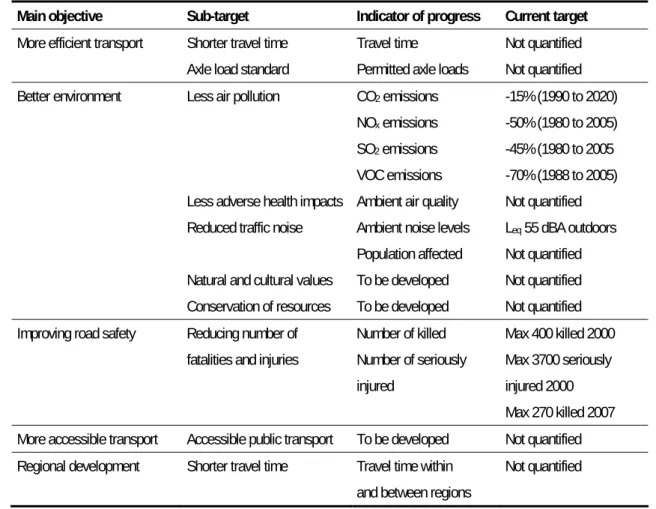
Policy Objectives for Road Transport Policy in Sweden
Main goal Sub-goal Progress indicator Current goal More efficient transportation Shorter travel time Travel time Not quantified. Maximum 270 killed 2007 More accessible transport Accessible public transport Under development Not quantified Regional development Shorter travel time Travel time within Not quantified.
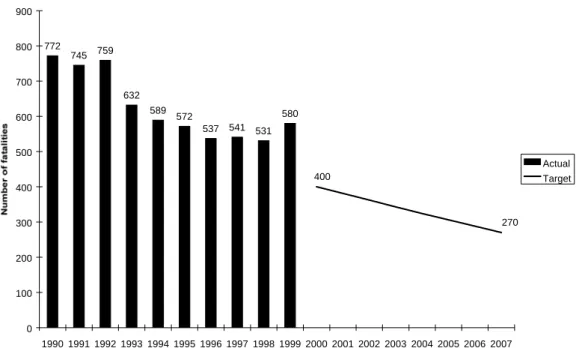
Road Safety Targets and Progress towards Them
Axle pressure standard Permissible axle pressures Not quantified Better environment Less air pollution CO2 emissions to 2020). Natural and cultural values Must be developed Not quantified Preservation of resources Must be developed Not quantified Improvement of road safety Reduction of number Number of fatalities Max 400 fatalities 2000.
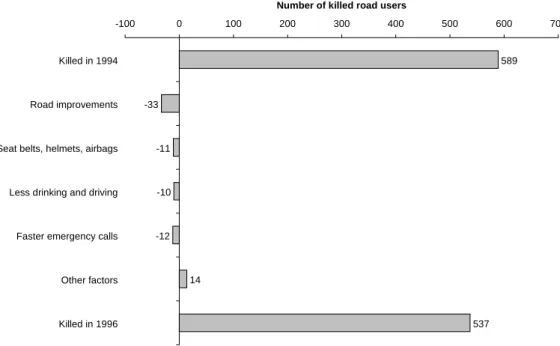
Effects of Current Road Safety Policy in Sweden
Other factors, including an increase in traffic volume, contributed to a net increase of 14 in the number of deaths. The road safety measures implemented from 1994 to 1996 therefore more than offset an increase in the number of deaths that would otherwise have occurred.
Effects of Fully Implementing Road Safety Policy Reforms
This becomes evident when the effects of the current road safety policy are compared with the effects of the whole. The expected effects of the full implementation of road safety policy reforms are shown in gray columns.
The special traffic safety plan presented in 1999
3 A stronger emphasis on the responsibility of road users for road safety – this means that an increase in police enforcement is planned. This means that this plan forms part of the current road safety policy for Sweden.
A Survey of Potentially Effective Road Safety Measures
13,600 km of urban roads with low traffic will be reconstructed according to plans for 30 km of streets in Vision Zero. 9,000 km of urban roads with moderate to heavy traffic volumes will be reconstructed according to the 50/30 street design principles in Vision Zero (comparable to environmentally adapted roads).
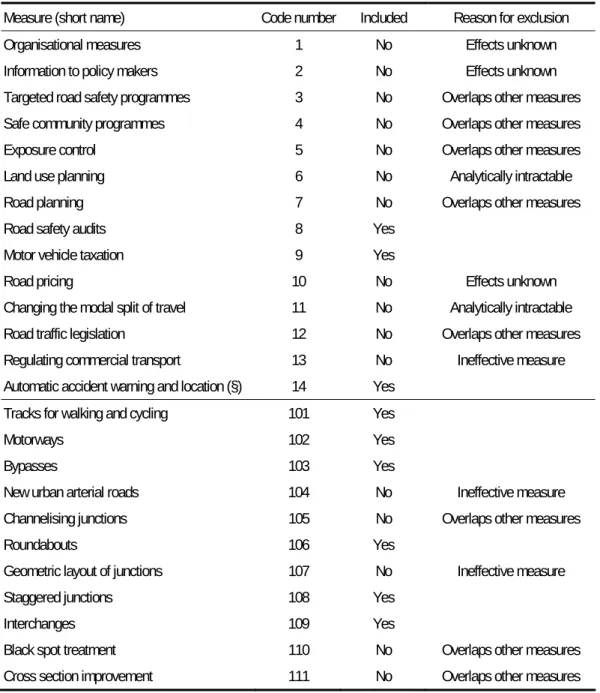
Criteria for Inclusion of Measures in a Formal Assessment of Costs and
It has been shown that regular road resurfacing leads to a temporary increase of about 5% in the number of accidents (Elvik, Mysen and Vaa 1997). Second, measures that may counteract an increase in the number of accidents, such as a temporary reduction in the speed limit, should be considered for inclusion in the safety program.
Screening of Measures for Inclusion in Formal Analyses of Safety Potentials,
Patrolling traffic (general enforcement) 802 No Ineffective measure Regulating drunk driving 803 No Fully implemented. Simple traffic fines 808 No Ineffective measure Regular traffic fines and imprisonment 809 No Overlaps other measures.
Travel Exposure, Road Network and Modal Distribution of Travel
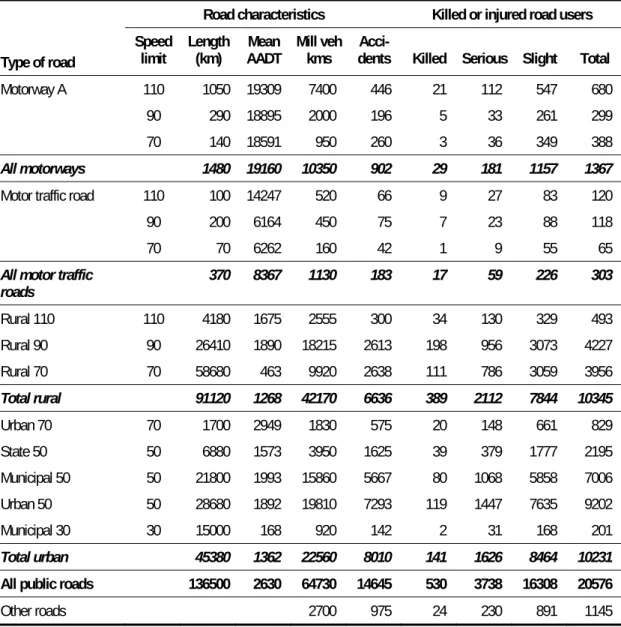
This chapter contains a description of the Swedish road transport system with a focus on travel exposure, accident rates for different elements. The second part of the chapter is a summary of the most important assumptions in the analyzes of safety potential, cost-effectiveness and the relationship between benefits and costs of road safety measures.
Injury rates of Road User Groups and Road Elements in Sweden
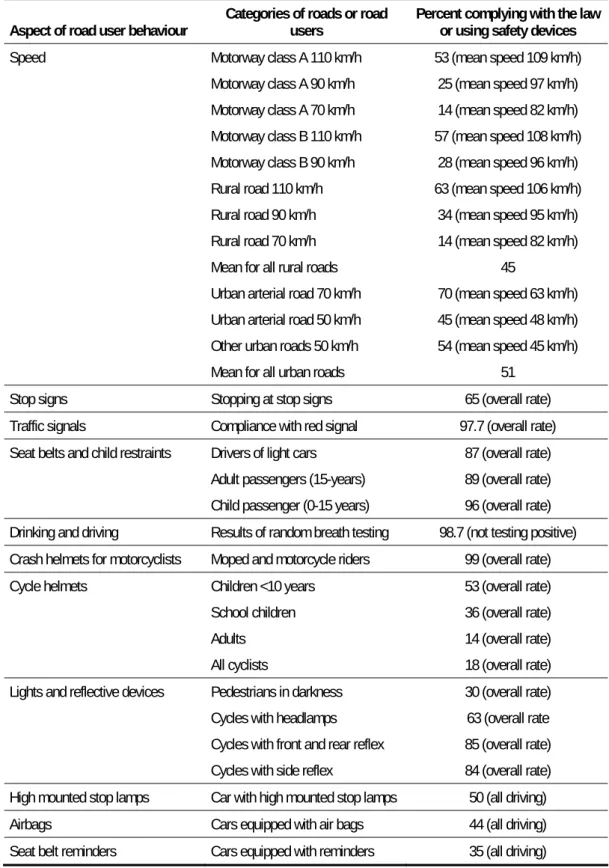
Road User Behaviour and Compliance with Road Traffic Law
Stop signs Prohibition at stop signs 65 (general rate) Traffic signals Red signal compliance 97.7 (general rate) Seat belts and child restraints Drivers of light cars 87 (general rate). It is clear that one of the most serious traffic safety problems in Sweden today is speed limit violations.
The Distribution of Roads and Junctions by Traffic Volume
The Diffusion of New Technology in the Vehicle Fleet
To estimate the effects on accidents and injuries of measures introduced for new cars, it is assumed that such measures affect 5.5% of all cars and all accidents in the first year, and 50% of all cars and all accidents within ten years. and at most 95% of all cars and all accidents.
Economic Valuation of Impacts of Road Safety Measures
1 kg SO2 emissions in urban areas 401 1 kg SO2 emissions in rural areas 20 1 kg NOx emissions in urban areas 721 1 kg NOx emissions in rural areas 60 1 kg NMVOC emissions in urban areas 501 1 kg NMVOC emissions in rural areas 30 1 kg urban PM10 emissions 35231 1 kg rural PM10 emissions 180 Noise emission per vehicle kilometer – light cars rural areas 0.008 Noise emission per vehicle kilometer – heavy cars rural 0.040 Noise emission per vehicle kilometer – light cars urban areas 0.067 Noise emission per vehicle kilometer – heavy cars urban areas 0.617. Most are taken from a recent SIKA report (Nylander et al. 1999) with recommendations for the valuation of various items in the cost-benefit analysis.
Models for estimating Effects of Measures
The effect of a measure is expressed as a percentage reduction in the number of injured persons. If the number of vehicle travel hours increases, the change becomes negative and is counted as a loss of mobility.
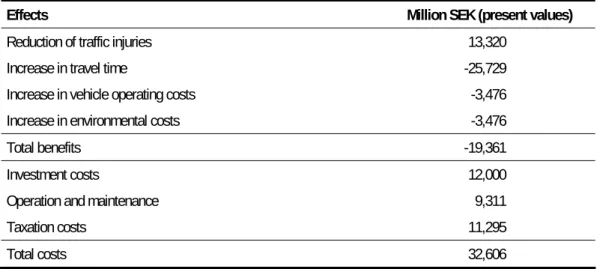
A Numerical Example of a Cost-Benefit Analysis
The main reason for this is the enormous increase in travel time costs. In the first place, the analysis – at least broadly speaking – takes the driver's point of view.
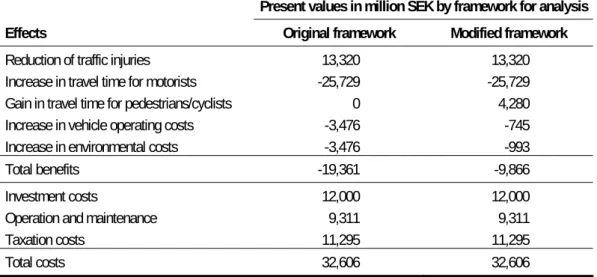
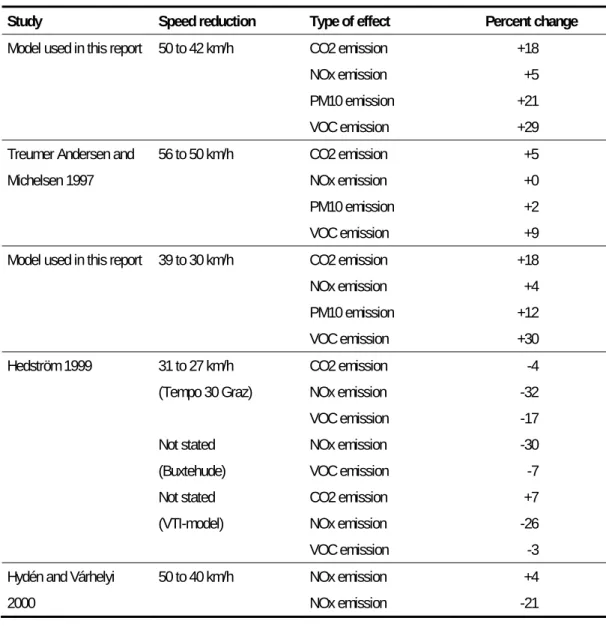
Modifying the Conventional Framework for Cost-Benefit Analysis for Speed
Unfortunately, few studies have attempted to evaluate the actual effects of speed reduction measures in urban areas on fuel consumption and pollutant emissions. However, it is likely that speed-reducing measures in urban areas can benefit the mobility of pedestrians and cyclists.
Modifying the Conventional Framework for Cost-Benefit Analysis for
There will therefore be a small increase in legitimate travel time associated with the use of an intelligent speed adaptation system, corresponding to the difference between the speed limit and the actual average speed. The additional travel time for which the costs are estimated corresponds to the shaded area in Figure 13.
Estimating the Combined Effects of Multiple Measures
The magnitude of this reduction in speed was estimated to be between 1 and 4 km/h for different road types. This is estimated to drop to 63.3 km/h when all cars use intelligent cruise control.
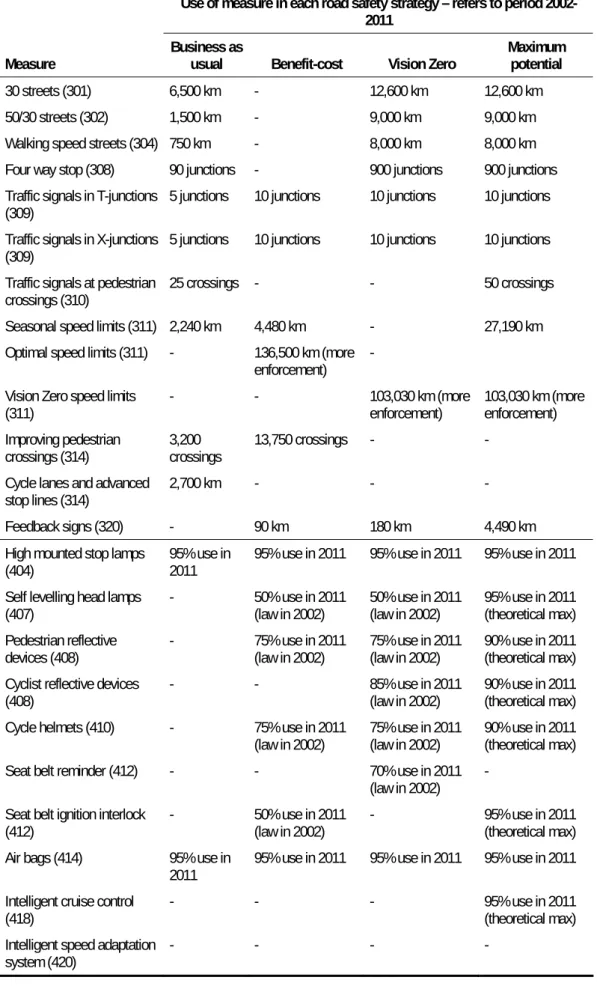
Road Safety Strategies
A road safety strategy consists of a set of road safety measures, compiled according to a certain rule or principle for setting priorities. This strategy is mainly included to serve a benchmark function, by indicating the theoretically maximum improvement in road safety conceivable by the application of currently known road safety measures.
Description of Current and Maximum Use of Measures
Current use There are currently around 300 staggered intersections in Sweden (projected from Brüde and Larsson 1987). Current use The system has been tested in Sweden, but the current use is negligible.
Developing Alternatives for the Use of each Measure
Measure Seizure of vehicles to prevent driving without a driving license (813) Description Many drivers whose driving license has been confiscated, for example.
Developing Alternative Road Safety Strategies
Furthermore, it is assumed that roads are reconstructed according to the design principles in the zero vision before new speed limits are introduced. The cost of this measure has been counted as part of the cost of introducing these speed limits.
Effects of road safety measures on the current number of fatalities and
The cost-benefit strategy is estimated to reduce the number of road users killed or injured by 6,467, to 15,254. This is more than a 55% reduction in the current number of road users killed or injured.
Forecasts of traffic volume, accidents and injuries
This simple model fits very well past changes in the number of traffic fatalities in Sweden. The fuel concept captures the effects of changes in traffic volume on the number of traffic fatalities.
Effects of road safety strategies in relation to road safety objectives
There is much greater uncertainty about the effects of road safety strategies. Estimated number of traffic accident fatalities in 2011 Road safety strategy Best estimate Lower limit 95% Upper limit 95%.
Measures with a great potential for improving road safety
In third place on the list of measures that have a great potential to reduce the number of fatalities is the introduction of optimal speed limits. Optimal speed limits are in most cases lower than or identical to the current speed limits.
Measures that are cost-effective
The last three measures listed in Table 20 could each reduce the number of deaths by about 35. Some of these measures are also included on the list of the ten measures that can bring about the greatest reduction in the number of deaths.
Measures whose benefits are greater than the costs
Ignition lock for seat belts in all cars 3.46 Seat belt reminder system in all cars 1.38 Redesign of car fronts and bumpers to reduce injuries to pedestrians 1.11. Ignition lock for seat belts in all cars 28.36 Seat belt reminder system in all cars 11.34.
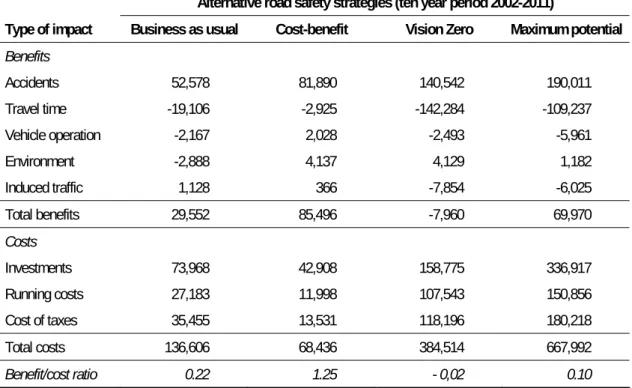
Socio-economic impacts of the road safety strategies
This is not at all surprising, given the fact that the main objective of all strategies is to improve road safety. Benefit-cost ratio for alternative road safety strategies Road safety strategy Best estimate Lower limit 95% Upper limit 95%.
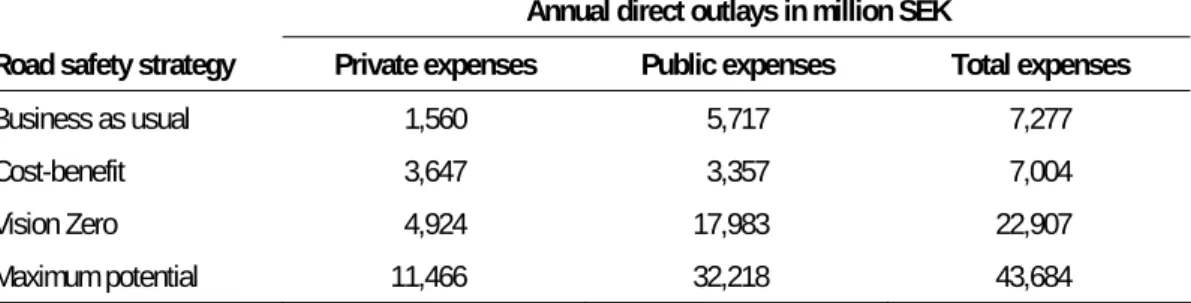
Effects of road safety strategies for public and private expenditures
For the zero vision, there is uncertainty as to whether positive overall benefits will arise at all. The total annual expenses are about the same for the business as usual strategy and for the cost-benefit strategy.
A Model of Compound Uncertainty
The reduced form assumes that the uncertainties of each of the items are uncorrelated with each other. In this report, the basic error propagation model is applied to estimate the uncertainty of the estimated effects of road safety strategies on the number of road users killed or injured.
Sources of uncertainty in estimated safety benefits
This overdispersion parameter is a function of the expected number of road users killed or injured. It was believed that this approach would account for most sources of systematic variation in the effects of the measures.
Estimated uncertainty in the effects of the road safety measures
Source of uncertainty Treatment of the source in this report 1 Definition of target accidents or injuries Not estimated; in principle possible to estimate 2 Random variation in accident numbers Included. In what way can or should the presence of a large element of uncertainty in estimated effects influence the choice of strategy.
The implications of uncertainty for the choice of road safety strategy
In the present context, this simply means that decisions should be made based on the best estimate of the expected effects of road safety strategies. The order of alternative strategies is the same for both decision rules.
Specification of some relevant considerations
On par, it is assumed that the Swedish government prefers a security program consisting of measures within its jurisdiction to a security program consisting of measures mainly outside its jurisdiction. The government is assumed to be risk averse, meaning that it prefers the program for which the worst possible outcome is best (yielding the lowest number of deaths and injuries) to any other program.
Comparison of road safety strategies in terms of the considerations relevant
The ranking of the strategies in terms of practicality is, roughly speaking, based on the number of measures included in them. Are the estimates of the effects of the road safety strategies on the number of road users killed or injured likely to be biased.
Potential sources of bias in estimates of the safety effects of the alternative
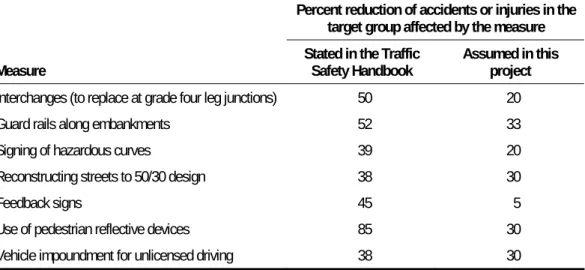
For most of the measures, estimates of the first-order effects on safety were taken from the Traffic Safety Handbook (Elvik, Mysen and Vaa 1997). In some cases, there is reason to believe that available evaluation studies overestimate the effects of the measures.
Comparison of the estimates made in this report and other estimates of the
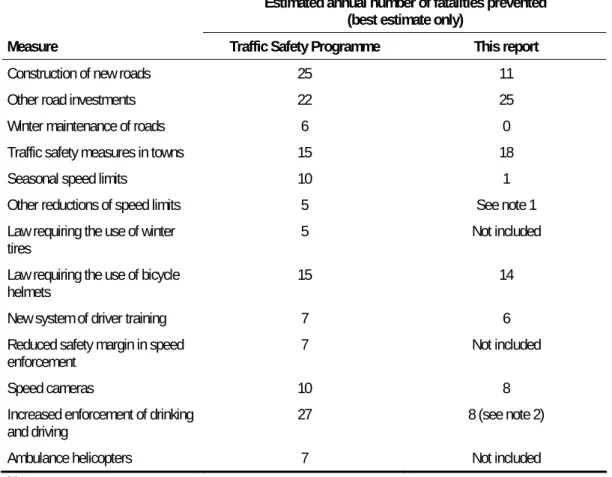
Another assessment of the effects of road safety measures is the assessment made by VTI (Andersson et al 1998) on the effects of the implementation of road safety reforms proposed in the National Road Safety Program in 1994. VTI gave a more optimistic assessment of the effects of improving compliance with "other regulations " from the assessment in this report.
The Applicability of Cost-Benefit Analysis to Road safety Policy Making
The monetary valuation of a non-traded good in cost-benefit analysis should be based on the willingness to pay of potential buyers of the good. Cost-benefit analysis covers many of the policy objectives that are relevant to road safety policy, but is unlikely to cover all relevant policies.
Constraints on Road Safety Policy Making – the Power of Government to
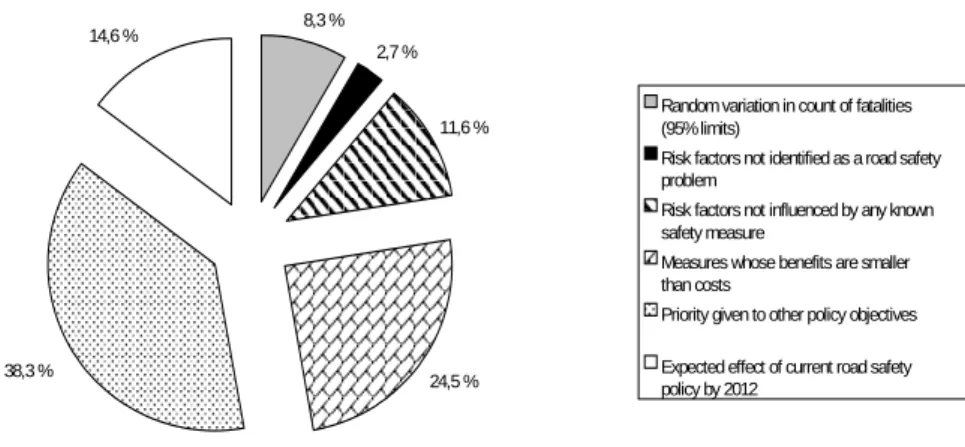
Cost-benefit analysis covers many of the policy objectives relevant to road safety policy, but is unlikely to cover all relevant policy. goals. In fact, 11.6% of deaths can be attributed to risk factors that are not controllable through any of the road safety measures considered in this report.
Conclusions
10 There is considerable uncertainty about the estimated effects of road safety measures and road safety strategies. Therefore, obstacles to more effective use of road safety measures should be sought outside the framework of cost-benefit analyses.
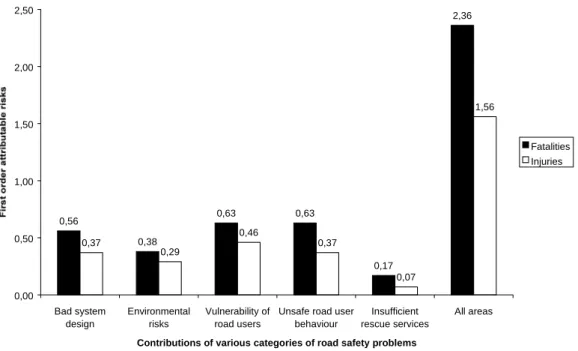
The Contribution of various Risk Factors to Road Safety
An attributable risk of 0.376 for fatalities and 0.210 for the total number of injured road users was estimated. This was estimated at 0.891 for fatalities and 0.731 for the total number of injured road users.
Estimation of the Effects of Each Road Safety Measure
Column 11 (Risk of injury) indicates the number of injured road users per million exposure units. Unit costs Number of injured affected None Measure Status Unit Target group Current use Use levels.
List of abbreviations