TØI report 1699/2019 Tanu Priya Uteng Andre Uteng Ole Johan Kittilsen
Land use development potential and E-bike analysis
TØI Report 1699/2019
Land Use Development Potential and E-bike Analysis
A study of cycling and land use planning
Tanu Priya Uteng (TØI)
Andre Uteng (Rambøll Norge AS) Ole Johan Kittilsen (Rambøll Norge AS)
Front-page photography/illustration: Unsplash.com
ISSN 2535-5104 Electronic
ISBN 978-82-480-2236-7 Electronic Oslo, March 2019
Copyright © Transportøkonomisk institutt, 2019 Denne publikasjonen er vernet i henhold til Åndsverkloven av 2018 Ved gjengivelse av materiale fra publikasjonen, må fullstendig kilde oppgis
Tittel: Land Use Development Potential and E-bike
Analysis Title: Cycling in Oslo, Bergen, Stavanger and
Trondheim Forfattere: Tanu Priya Uteng, Andre Uteng,
Ole Johan Kittilsen Authors: Tanu Priya Uteng, Andre Uteng, Ole Johan Kittilsen
Dato: 03.2019 Date: 03.2019
TØI-rapport: 1699/2019 TØI Report: 1699/2019
Sider: 43 Pages: 43
ISBN elektronisk: 978-82-480-2236-7 ISBN Electronic: 978-82-480-2236-7
ISSN: 2535-5104 ISSN: 2535-5104
Finansieringskilde: Norges forskningsråd Financed by: The Research Council of Norway
Prosjekt: 4312 – Cycle-2-zero 4267 – SHIFT
4162 - CLIMAMOB
Project: 4312 – Cycle-2-zero 4267 – SHIFT
4162 - CLIMAMOB Prosjektleder: Tanu Priya Uteng Project Manager: Tanu Priya Uteng
Kvalitetsansvarlig: Aud Tennøy Quality Manager: Aud Tennøy
Fagfelt: Byutvikling og bytransport Research Area: Sustainable Urban Development and Mobility
Emneord: Elsykkel
Sykkelbruk Tilgjengelighet Areal planlegging Sykkelby
Keywords: Ebike
Bicycle usage Accessibility Land use planning Cycling cities
Sammendrag: Summary:
Å lykkes med å øke sykkelandelen i byområdene er en sentral del av det pågående planleggingsmandatet i de Norske by- regionene. For å lykkes med mandatet kan man ta i bruk tiltak på både mikro- og makroplanet. Mikro-planet innebærer utbygging av gang-og-sykkelstier og øvrige tilsvarende tiltak som bedrer sykkelinfrastrukturen og sykkelopplevelsen for de reisende. På makronivået, som utgjør det strategiske nivået, fremstår regulering av arealbruk og arealbruksplanlegging som et viktig verktøy. Denne rapporten analyserer potensialet for å bruke arealplanleggingen som et verktøy for å oppnå ønsket om økt sykkelbruk i by-regionene Oslo, Bergen, Trondheim og Stavanger. Analysen tar utgangspunkt I INMAP-modellens metodikk for arealplans-kvantifisering, en metodikk som tidligere er benyttet til å estimere
sammenhengen mellom arealbruk og reisevaner i en rekke utredninger. Denne rapporten tilbyr kunskap om hvordan eksiterende og fremtidig arealbruk og arealbrukplanlegging kan inngå i sykkelstrategien i byområdene.
Increasing cycling shares is a part of the urban and transport planning mandate for the Norwegian urban regions. The pathways to increase bicycling shares can be plotted at both macro and micro levels. At micro levels, road designs and measures to both improve the
conditions for cyclists and make cycling paths safer can lead to potential increase in bicycling. At the macro level, land use planning can assist in increasing bicycling usage. In this report, we analyse the issue at a macro level for the four largest cities in Norway – Oslo, Bergen, Trondheim and Stavanger. Analysis is based on INMAP model, which has previously been employed to estimate the mutual effects of land use plans, infrastructure provision and transportation in Norway. This study strongly recommends integrating the impact of E-bikes with land-use planning processes and decisions. Through active land-use management, the municipalities and regional development authorities can steer urban mobility to a more sustainable direction.
Language of report: English
Transportøkonomisk Institutt Gaustadalléen 21, 0349 Oslo Telefon 22 57 38 00 - www.toi.no
Institute of Transport Economics Gaustadalléen 21, N-0349 Oslo, Norway Telephone +47 22 57 38 00 - www.toi.no
Land Use Development Potential and E-bike Analysis
Copyright © Transportøkonomisk institutt, 2019 o
Preface
This report is part of the research project Reducing fossil energy use and CO2 emissions from transport by paving the way for more bicycles and E-bikes (Cycle-2-zero) financed under the aegis of the research programme ENERGIX (Project Number: 255628) of The Norwegian Research Council (NRC).
In this research project, we have developed both new methods for data collection and analysis.
This report focuses on a new method of analysing the land use data, both existing and future plans, to comment on the potential of E-bikes to cater to commuting trips. This report addresses the work package 2 of the Cycle-to-Zero project.
The report provides the foundation for additional analyses, for the case of Oslo and Stavanger, undertaken and presented in the following projects:
Climate change and everyday mobility – social impacts, adaptation and mitigation strategies (CLIMAMOB) financed under the aegis of the research programme KLIMAFORSK (Project Number: 244137) of The Norwegian Research Council (NRC).
Sustainable Horizons in Future Transport (SHIFT) – a Nordic Flagship Project funded by The Nordic Energy Research (grant number 77892).
Data sources from the Regional Transport Model (RTM), and land use plans have been used to plot the linkages between bicycling and the current and future strategy plans of the four biggest cities of Norway.
The report is written by Tanu Priya Uteng, Andre Uteng, Ole Johan Kittilsen. Andre Uteng and Ole Johan Kittilsen are transport consultants at the engineering consultancy firm Rambøll Norge AS, and have worked in close collaboration with Tanu Priya Uteng at the Institute of Transport Economics to develop this study.
Tanu Priya Uteng has been the project leader of Cycle-2-zero during the preparation of this report. Aud Tennøy has been quality manager for this report. Secretary Trude Kvalsvik has been responsible for organizing the report for publishing.
Oslo, March 2019
Institute of Transport Economics
Gunnar Lindberg Silvia Olsen
Managing Director Research Director
Land Use Development Potential and E-bike Analysis
Copyright © Transportøkonomisk institutt, 2019 o
Content
Summary Sammendrag
1 Introduction ... 1
1.1 Report structure ... 2
2 INMAP ... 3
3 Measuring accessibility with bicycle and E-bike ... 5
3.1 Estimated travel time by E-bike ... 6
3.2 Willingness to pay ... 8
3.3 Results ... 10
4 Estimation of growth potential based on land use plans, and its importance .. 15
4.1 The City of Bergen ... 19
4.2 The Cities of Stavanger, Sandnes and Sola ... 22
4.3 The City of Trondheim ... 27
4.4 The City of Oslo ... 28
5 Analysis ... 31
5.1 The City of Bergen ... 32
5.2 The cities of Stavanger, Sandnes and Sola ... 34
5.3 The City of Trondheim ... 36
5.4 The City of Oslo ... 38
6 Conclusion ... 40
7 References ... 41
Appendix ... 43
Telephone: +47 22 57 38 00 E-mail: [email protected] i
This report can be downloaded from www.toi.no
Summary
Land use development potential and E- bike analysis
TØI Report 1699/2019 Tanu Priya Uteng, Andre Uteng, Ole Johan Kittilsen Oslo 2019 43 pages English
Increasing cycling shares is a part of the urban and transport planning mandate for the Norwegian urban regions. The pathways to increase bicycling shares can be plotted at both macro and micro levels. At micro levels, road designs and measures to both improve the conditions for cyclists and make cycling paths safer can lead to potential increase in bicycling. At the macro level, land use planning can assist in increasing bicycling usage. In this report, we analyse the issue at a macro level for the four largest cities in Norway – Oslo, Bergen, Trondheim and Stavanger. Analysis is based on INMAP model, which has previously been employed to estimate the mutual effects of land use plans, infrastructure provision and transportation in Norway.
The White Paper 26, 2012-2013 (NTP) states that any future growth in person transport in the larger cities should be absorbed by public transport, cycling and walking. In order to realize this ambitious goal, government wants to implement measures to stimulate ‘green’
person transport, and one of the popular measures towards this end is through extending financial support for policy packages in the city-networks. This report provides knowledge on how current and proposed land use and transport policies can be effectively interlinked to promote bicycling in the four cities. The results can assist in designing specific measures and paths of adoption for such measures, which can form a vital input for making
decisions on policy packaging by the cities.
As per the trip-making characteristics, almost half of the trips registered in the National Travel Survey (NTS 2013/14) of Norway are less than 5 km, and close to 50 percent of these short to medium length trips were taken with cars. This indicates a potential to reduce car use and increase cycling in Norway which can be addressed through suitable land use planning. The results presented in this report can assist in designing specific measures and the paths of adoption for such measures, which can form a vital input for making decisions on policy packaging by the cities.
In this report, we have interpreted the interactions between bicycle accessibility and land use planning through the INMAP methodology. In this methodology, the supply of land is determined by the local municipalities through land use plans, while the demand for the land is estimated as a function of the accessibility to jobs, trade, general services and health services in the areas.
Accessibility with bicycle and E-bike
The methodology for estimating accessibility used in INMAP is based on the approach developed for the Land use and transport interaction (LUTI) model for the metropolitan area of Santander (Coppola et. al. 2013). Accessibility is modelled as a function which combines the willingness to pay (for a given travel cost to a zone) with the number of jobs that can be acquired (from travelling to the zones).
Land use development potential and E-bike analysis
ii Copyright © Institute of Transport Economics, 2019
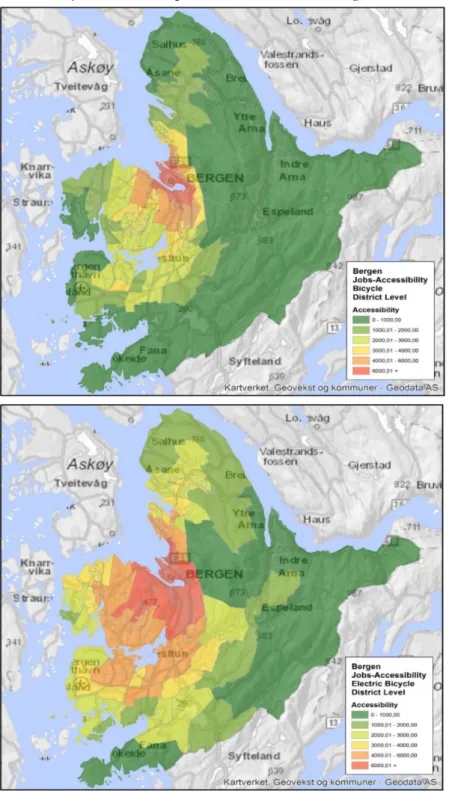
Estimated accessibility for bicycle and E-bike for the four case cities have been plotted and figure S1 presents the case of Bergen. Accessibility is measured as the number of jobs that are accessible within each ward. The top figure depicts accessibility to jobs by bicycle, and accessibility for E-bike is provided in the bottom figure.
Figure S-1: Accessibility by bicycle and E-bike to workplaces. Bergen.
Growth potential based on land use plans
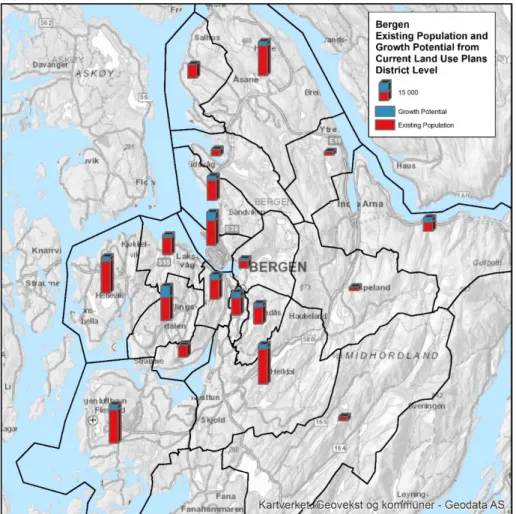
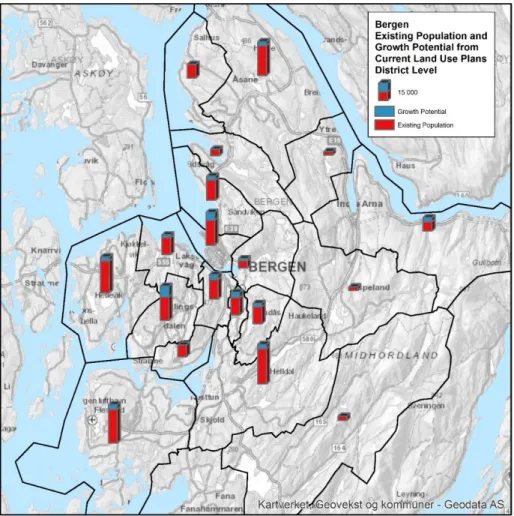
The INMAP model builds on estimating the growth potential based on existing and future land use plans and strategies. In Figure S-2, the maximum growth potential of inhabitants
Land use development potential and E-bike analysis
Copyright © Institute of Transport Economics, 2019 iii
according to the strategic general plan of Bergen on district-level has been highlighted. Blue colour marks growth potential of population according to the general plan, while existing population is shown in red. This mapping exercise assists in plotting the potential areas for future development. For example, half of the growth is located to the city center or the adjacent Bergensdalen “Valley of Bergen” (south of the city center). The biggest growth area, apart from the city center is Fyllingsdalen which is southwest of the city center. Other densification areas, such as Arna, Åsane, and the airport/Ytrebygda can be seen to the east, north and southwest. Similar plottings were done for each case city and the results fed into the final analysis and interlinking of accessibility (on bicycle and E-bikes) and land use growth potential.
Figure S-2: Estimated growth potential according to the strategic general plan City of Bergen.
Analysis: outlining the interlinkages between bike accessibility and land use plans
For each city, accessibility maps were plotted to highlight the number of jobs that are accessible with E-bikes contra bicycles in the different parts of the city. These figures provide vantage points to critically reflect on the general land use plans for the cities.
For example, the accessibility map for bicycle for Bergen shows access to 6 000 or more jobs in the central parts of the city centre, and an equivalent level of accessibility spreads throughout the city centre and growth areas in Bergensdalen and Fyllingsdalen when E- bikes are inserted in the system. The City of Bergen has already, in the new general plan,
Land use development potential and E-bike analysis
iv Copyright © Institute of Transport Economics, 2019
removed limitations on density for the central areas as long as certain criteria are met by the developers. Our analyses support this move by the city authorities.
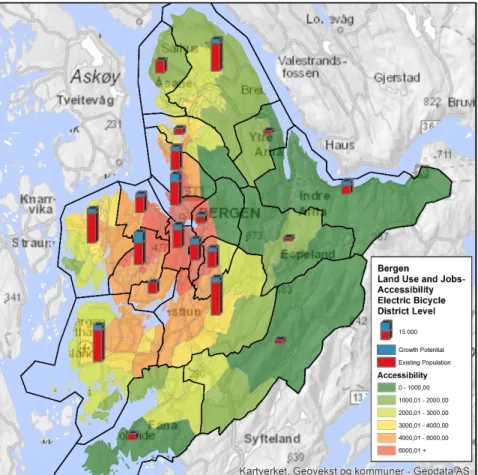
While the strategic general plan sets out that growth should occur in the city centre, adjacent area of Bergensdalen, as well as local centres and transportation nodes, our
analysis (based on E-bike accessibility) suggests that increased accessibility to jobs would be achieved if a larger share of the growth takes place in the city centre and Bergensdalen, along with Nesttun.
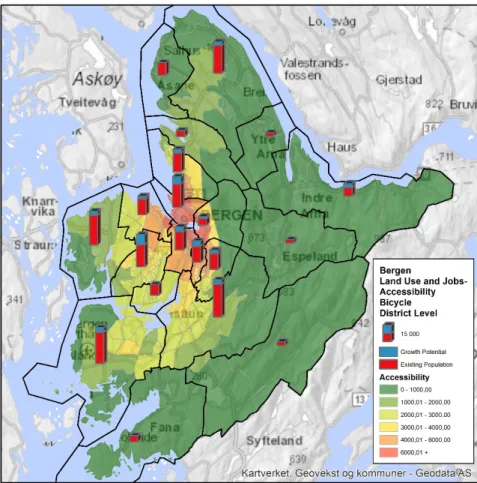
Figure S-3: Accessibility with bicycle and growth potential, Bergen.
Land use development potential and E-bike analysis
Copyright © Institute of Transport Economics, 2019 v
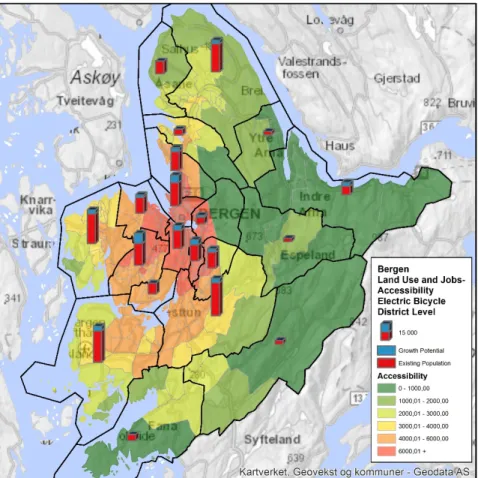
Figure S-4: Accessibility with E-bike and growth potential, Bergen
Conclusion
This report has considered the relationship between job accessibility with bicycle and E- bike, and the land use plans of the four biggest cities in Norway. Understanding this relationship is important as E-bikes allow for a substantially higher average speed than normal bicycles, thus making it a viable option for a larger area than normal bicycles.
From comparing E-bike accessibility with the land use growth potential, we found that it is possible to develop land use strategies to enhance the use of E-bikes. Each city has areas close to the city centre with limited development potential according to the existing plans, but high job-accessibility with E-bikes. High job-accessibility with E-bikes close to the city centres supports the current general strategy of pursuing high density developments or transformation projects in these areas. The findings of this report suggest that these areas should be considered for further development. This is especially true as the green field development areas are, in general, not found to provide any substantial accessibility with E- bikes.
Findings further suggest that the E-bikes may have a bigger impact in Stavanger than in Trondheim and Bergen. Oslo will, by far, have the biggest increase in accessibility.
To conclude, this study strongly recommends integrating the impact of E-bikes with land- use planning processes and decisions. Through active land-use management, the
municipalities and regional development authorities can steer urban mobility to a more sustainable direction.
Telefon: 22 57 38 00 E-mail: [email protected] I
Rapporten kan lastes ned fra www.toi.no
Sammendrag
Arealbruk og El-sykkel analyse
TØI Report 1699/2019 Tanu Priya Uteng, Andre Uteng, Ole Johan Kittilsen Oslo 2019 43 sider
Å lykkes med å øke sykkelandelen i byområdene er en sentral del av det pågående planleggingsmandatet i de Norske by-regionene. For å lykkes med mandatet kan man ta i bruk tiltak på både mikro- og makro- planet. Mikro-planet innebærer utbygging av gang-og-sykkelstier og øvrige tilsvarende tiltak som bedrer sykkelinfrastrukturen og sykkelopplevelsen for de reisende. På makronivået, som utgjør det strategiske nivået, fremstår regulering av arealbruk og arealbruksplanlegging som et viktig verktøy.
Denne rapporten analyserer potensialet for å bruke arealplanleggingen som et verktøy for å oppnå ønsket om økt sykkelbruk i by-regionene Oslo, Bergen, Trondheim og Stavanger. Analysen tar utgangspunkt i INMAP-modellens metodikk for arealplans-kvantifisering, en metodikk som tidligere er benyttet til å estimere sammenhengen mellom arealbruk og reisevaner i en rekke utredninger.
I henhold til National Transportplan (NTP) skal den fremtidige veksten i persontransport- en i de største byene absorberes av kollektivtransporten, sykling og gange. For å realisere denne ambisiøse planen ønsker myndigheten å implementere tiltak for å stimulere «grønn»
persontransport. Et populært tiltak består av å yte finansiell støtte til tiltakspakker i byvekstavtalene. Denne rapporten tilbyr kunskap om hvordan eksiterende og fremtidig arealbruk og arealbrukplanlegging kan inngå i sykkelstrategien i byområdene.
I henhold til den nasjonale reisevaneundersøkelsen er nesten halvparten av reisene kortere enn 5 km, og av disse korte og mellom lange reisen, ble nesten halvparten utført med bil.
Statistikken indikerer et klart potensial for at bilturer kan overføres til sykkelturer. Denne rapporten presenterer en analyse av hvordan arealbruken og -formingen av de kommunale arealstrategiene kan bistå overføringen av bilturer til sykkelturer. I analysen ser vi på inter- aksjonen mellom vekstpotensialet som kommuneplanen tillater i de ulike grunnkretsene, og grunnkretsenes tilgjengelighet til arbeidsplasser med sykkel og el-sykkel. Her representerer vekstpotensialet (som beregnes med utgangspunkt i de gjeldende arealplanene for hver byområdet) tilbudet av land, mens etterspørselen etter land antas å (til dels) avhenge av arbeidsplasstilgjengeligheten de ulike arealene tilbyr.
Tilgjengelighet med sykkel og el-sykkel
Metodikken for estimering av arbeidsplasstilgjengeligheten benyttet i INMAP er basert på Land use and transport interaction (LUTI) modellen utviklet for storbyområdet for Santander (Coppola et. al. 2013). Tilgjengeligheten modelleres som en funksjon som kombinerer betalingsvilligheten/reisevillighet (for en gitt reisekostnad) mellom sonene, og antallet jobber i hver sone. Øvelsen resulterer i et estimat for antallet jobber/arbeidsplasser man kan nå i hver grunnkrets basert på transportinfrastrukturen (gang og sykkelveier osv.) og de omkringliggende næringsarealene.
I analysen har vi kartlagt arbeidsplasstilgjengeligheten med sykkel og el-sykkel for Norges fire største byer. Det øverste kartet i Figur S1 viser arbeidsplasstilgjengeligheten for Bergen med sykkel, mens det nederste viser tilgjengeligheten med el-sykkel
Arealbruk og El-sykkel analyse
II Copyright © Transportøkonomisk institutt, 2019
Denne publikasjonen er vernet i henhold til Åndsverkloven av 2018
Figur S 1: Sykkel og El-sykkeltilgjengliehet til arbeidsplassen, Bergen.
Vekstpotensial og kommuneplaner
INMAP-modellen danner estimater for vekstpotensialet ved å ta utgangspunkt i føringene i kommuneplanens arealstrategi mht. dekar areal tilgjengelig, høyde-restriksjoner og øvrige restriksjoner som vil innvirke på områdenes potensielle utnyttelsesgrad. Gjennom å utføre øvelsen for hvert boligområde innenfor grunnkretsene får man estimert et mål for den maksimale bosettingen grunnkretsene kan inneha gitt de gjeldende begrensningene i
planen. Figur S-2 illustrerer det maksimale vekstpotensialet og dagens bosetting i Bergen på distriktsnivå.
Arealbruk og El-sykkel analyse
Copyright © Transportøkonomisk institutt, 2019 III
Denne publikasjonen er vernet i henhold til Åndsverkloven av 2018
Høyden på hver bar angir den maksimale bosettingen som gjeldene plan tillater i hvert distrikt, hvorav den røde delen av barene representerer dagens bosetting i distriktet, mens den blå delen angir distriktenes samlede vekstpotensial.
Kartøvelsen gir en nyttig beskrivelse av kommuneplanens betydning for vekstomfanget i de ulike områdene. Kartet viser for eksempel at omtrent halvparten av veksten er lokalisert i Bergen sentrum og i den nærliggende Bergensdalen (sør for sentrum). Det største
vekstområdet utenom sentrum er i Fyllingsdalen sørvest for by-sentrumet. Kartet viser også omfanget av øvrige fortettingsområder, heriblant Arna (øst for sentrum), Åsane (nord for sentrum) og flyplassen (sørvest for sentrum). I prosjektet har det blitt utarbeidet tilsvarende kart for hvert byområde, og disse har så blitt benyttet for å analysere sammenhengene mellom vekstpotensialet og tilgjengeligheten.
Figur S-2: Estimert vekstpotensial for Bergen basert på gjeldende kommuneplan.
Analyse: Kartlegging av sammenhengene mellom sykkel- tilgjengelighet og kommunens arealstrategier
I analysen er det for hver by utarbeidet kart som gir en samlet fremstilling av jobb- tilgjengeligheten med sykkel og el-sykkel, og vekstpotensialet angitt av kommuneplanen.
Basert på disse kartene kan man identifisere hvilke områder som får en økning i
tilgjengeligheten ved introduksjon av el-sykkel, og hvorvidt kommuneplanen legger opp til vekst i disse områdene. Kartene gir med andre ord innsikt i hvorvidt kommuneplanene støtter opp innføringen av el-sykler eller ikke.
Arealbruk og El-sykkel analyse
IV Copyright © Transportøkonomisk institutt, 2019
Denne publikasjonen er vernet i henhold til Åndsverkloven av 2018
Figur S-3 og S-4 viser sammenhengene mellom vekstpotensialet og jobb-tilgjengeligheten med vanlig sykkel (S-3), og tilsvarende sammenheng for el-sykkel (S-4). Fra figurene ser man at man i dag har en tilgjengelighet på rundt 6000 arbeidsplasser i Bergen sentrum ved bruk av vanlig sykkel, og at denne avtar raskt med avstanden til sentrum. Ser man derimot på tilgjengeligheten med el-sykkel, har denne en tilgjengelighet tilsvarende den for sentrum med vanlig sykkel som sprer seg bredt utover i både nordlig og sørlig retning. Som det kommer frem fra kart S-3 har man med el-sykkel samme jobb-tilgjengelighet i Bergensdalen og Fyllingsdalen som man har med vanlig sykkel i sentrum. I henhold til Bergens nyeste planstrategi legges det opp til en reduksjon av tetthetsbegrensningene i byområdet så lenge gitte kriterier blir møtt av utbyggerne. Vår analyse indikerer at en slik fortettingsstrategi vil kunne gi en god effekt på overgangen til grønn persontransport i Bergen.
Figur S-3: Sykkeltilgjengelighet til arbeidsplasser og vekstpotensial, Bergen
Arealbruk og El-sykkel analyse
Copyright © Transportøkonomisk institutt, 2019 V
Denne publikasjonen er vernet i henhold til Åndsverkloven av 2018
Figur S-4: El-sykkeltilgjengelighet til arbeidsplasser og vekstpotensial, Bergen.
Konklusjon
Rapporten har vurdert sammenhengen mellom jobb-tilgjengeligheten med sykkel og el- sykkel, og vekstpotensialet på distriktsnivå basert på kommuneplanenes arealdeler for Norges største byer. Å oppnå forståelse for disse sammenhengene er viktig ettersom el- syklene tillater en betydelig høyere hastighet og krever en betydelig lavere ytelse av syklisten enn vanlig sykkel. Disse forholdene medfører at el-sykkel utgjør et reelt alternativ i større områder enn vanlig sykkel.
Gjennom å sammenlikne vekstpotensialet med el-sykkel tilgjengeligheten har vi funnet at det er mulig å tilpasse arealstrategien til å bygge opp under el-sykkelens fremvekst. Samtlige av byene har en strategi om å oppnå fortetting nært sentrum, og vår analyse viser at disse fortettingsområdene har en såpass høy el-sykkeltilgjengelighet at de kan forventes å kunne få samme sykkel-andel som de mest sentrumsnære områdene. Samtidig viser rapporten at byene også har relativt store områder med svært begrenset vekstpotensial og relativt høy el- sykkeltilgjengelighet. En fortetting i disse områdene vil kunne få en stor effekt på
overgangen til grønn persontransport. Dette gjelder spesielt områdene med begrenset kollektivtilgang.
Basert på rapportens resultater kan man konkludere med at det å integrere
tilgjengelighetsmål i arealplanleggingsprosessen kan gi innsikt i sammenhenger som man i dag ikke fanger opp, og at en slik integrering kan være en effektiv måte å oppnå et grønt skifte i persontransporten
Land use development potential and E-bike analysis
Copyright © Institute of Transport Economics, 2019 1
1 Introduction
This report is a part of work package 2 (WP2) of the research project Reducing fossil energy use and CO2 emissions from transport by paving the way for more bicycles and E-bikes (Cycle-2-Zero)
financed under the aegis of the research programme ENERGIX (Project Number: 255628) of The Norwegian Research Council (NRC). Cycle-2-Zero is envisioned to be a multi- disciplinary project which aims at combining theories and data anchored in infrastructure planning, energy, economics, urban/transport planning and political science. The analysis presented here provides a foundation for energy mapping of future scenarios developed for Oslo and Stavanger for the following projects:
Climate change and everyday mobility – social impacts, adaptation and mitigation strategies (CLIMAMOB) financed under the aegis of the research programme KLIMAFORSK (Project Number: 244137) of The Norwegian Research Council (NRC).
Sustainable Horizons in Future Transport (SHIFT) – a Nordic Flagship Project funded by The Nordic Energy Research (grant number 77892).
WP2 of Cycle-2-Zero proposes to fuse data collected on the physical variables of bicycling infrastructure with other relevant parameters like area density and morphology, population characteristics, rate of bicycle usage, the national travel survey, proximity to public
transport hubs, existing and planned cycling policies, user preferences etc. to arrive at a comprehensive value (index) depicting the existing levels of bicycle oriented development (BOD) at a location or an area.
Primary objectives of the WP2, which looks at the interplay between urban context and bicycle usage, were as following:
i. to examine and measure existing urban layout – by examining the positioning of bicycle lanes, urban densities, residential / employment centres / shopping locations, parking facilities and other physical determinants connected to bicycling;
ii. to measure and assess the impact of transport policies and urban policy packaging on bicycling;
iii. to comment on how cycling culture influences the level of cycling in Norwegian cities.
In this report, we have analysed the relationships between accessibility to jobs acquired by travelling with normal bicycles and electric bicycles (E-bikes), and the existing land-use plans within the city regions of Trondheim, Bergen, Stavanger and Oslo in Norway. The purpose of the analysis has been to evaluate if the current land use plans facilitate usage of bicycles and E-bikes. To do this, we have assessed the extent to which the future growth areas, earmarked in the strategic general plan of the City-regions, coincide with the areas that have a high jobs-accessibility with bicycles and E-bikes. The analysis builds on the assumption that there is a correlation between the potential for bicycle and E-bike usage in an area (for work trips), and the number of jobs that can be reached by bicycle within the same area.
The analyses presented in this report have been performed using the Integrated Methodology for Land Use prognosis within Transportation Models (INMAP). The methodology has been developed by Rambøll on behalf of the Ministry of Local
Government and Modernisation since 2015 for the task of generating land use forecasts for
Land use development potential and E-bike analysis
2 Copyright © Institute of Transport Economics, 2019
the Norwegian transportation models (Uteng and Kittilsen 2015)1. INMAP generates the forecasts through combining the following two approaches:
i. The first approach is based on a methodology that uses the strategic general plan of a city region to quantify the growth potential of the various zones and wards within an area.
ii. The second approach is based on a standard accessibility model which uses estimated travel times, travel surveys and official employment and populations statistics to estimate the accessibility to jobs, trade and services by car, public transport, walking and cycling.
This study puts forth the following three broad sets of analyses:
i. Accessibility-analyses for bicycle and E-bike for each city region.
ii. Estimation of growth potential in housing/inhabitants according to existing land use plans in the four cities of Oslo, Bergen, Trondheim and Stavanger.
iii. A combined analysis of the accessibility of E-bike, and the growth potential according to the land use plans, as well as a discussion on the possibilities for optimizing an increased accessibility thorough land use plans.
The report begins with giving a description of the INMAP-methodology in chapter 2 and the approach used to estimate the accessibility with cycle and E-bike in chapter 3.
Following that, chapter 4 describes the methodology used for quantifying the municipality land use plans. In chapter 5, we analyse the relationships between the growth potential and the accessibility for each city-region and assess the extent to which the land use plans facilitate cycle and E-bike usage. Chapter 6 concludes the study.
1.1 Report structure
This report looks at the following topics in the four largest cities in Norway (Oslo, Bergen, Trondheim and Stavanger):
1. Brief introduction to the INMAP model.
2. Accessibility measurement with bicycle and E-bikes.
3. Estimation of growth potential based on land use.
4. Plotting of areas most suitable for future development in light of increasing bicycle usage.
1http://www.kit-samarbeidet.org/wp-content/uploads/2017/05/2015-12-10-RAPPORT-Rambøll-Arealutvikling-på- grunnkretsnivå-ny-plan-og-transportmodell.pdf
Land use development potential and E-bike analysis
Copyright © Institute of Transport Economics, 2019 3
2 INMAP
INMAP is a model used for estimating the mutual effects of land use plans, infrastructure and transportation in Norway. The model has been developed by Rambøll Norge AS on behalf of the Norwegian Roads Authorities and the Ministry of Local Government and Modernisation since the autumn of 2015 (Uteng and Kittilsen 2015). This model currently provides the official methodology for land-use analysis in the Norwegian transportation modelling system, and the Ministry of Local Government and Modernisation recommends its usage for all public land-use estimations in Norway. So far, the model-tool has been used to estimate the effects of land-use planning on vehicle kilometers travelled in private cars in the city of Bergen, the municipalities of Arendal and Kongsberg, as well as the city region of Stavanger.
In the INMAP methodology, supply of land is determined by the local municipalities through land use plans, while the demand for the land is estimated as a function of the accessibility to jobs, trade, general services and health services within the areas.
This approach ensures that the provision and possible usage of land becomes exogenously determined variables, which greatly simplifies the task of making prognosis on the
geographical distribution of population and employment. If the supply of land is fixed, we only need to model the demand for the land offered to the population. To determine this demand, the INMAP methodology uses accessibility to jobs, trade and services within each area. The assumption is, that for everything else being equal, the population will choose to settle in the areas with the highest accessibility.
At its core, INMAP is a stand-alone module that processes the traditional input data used by the transportation model to contain the expected land-use changes derived from planned infrastructure investments and/or land use changes. The model accomplishes this through combining accessibility measurements that reflect the transportation infrastructure and current commercial land use, with the strategic land use plan to include the expected land use of the future. This approach enables the model to capture the effects of both changes in the transportation infrastructure (as these impacts the travel times between the zones), and changes in the land use plans (as these impacts the growth restrictions of the zones).
INMAP, in other words, enhances the traditional transportation model to have capabilities normally reserved for more sophisticated Land Use and Transportation Interaction (LUTI) models. LUTI models typically plot the mutual relationships between the changes in transportation infrastructure, expected development of commercial and residential areas, and the expected development in traffic. However, where the more sophisticated LUTI models assume that the supply and usage of land is determined by the market, INMAP uses a simplified approach in which both the supply and allowed usage (commercial and residential) of land is determined by the local municipalities. Keeping the provision and usage of the land as exogenously determined variables greatly simplifies the task of predicting the future usage of the individual plots of land, and thereby also the task of distributing the expected population growth over the available land in a region. The approach also eases the complexities involved with predicting the future commercial usage of land, as it limits the problem to the scale of the allowed activity, rather than the nature of the activity.
Land use development potential and E-bike analysis
4 Copyright © Institute of Transport Economics, 2019
By letting the supply of land being exogenously determined by the authorities, future land use becomes a function of the demand of the residential and commercial land offered to the population. To determine demand, the INMAP methodology uses an estimated generalized travel costs between the zones in combination with official employment statistics to estimate the accessibility to jobs, trade and services within each zone with each available mode of travel. INMAP then assumes that, for everything else being equal, the population wishes to settle in the areas that has both available space (as determined by the land use plan) and the highest accessibility (as determined by the current land use and the transportation infrastructure). The approach implies a mutual relationship between the residential and commercial land uses, as it is the commercial land use (represented by jobs) which is used to estimate the accessibility within the zones. Any significant change in the commercial land use will therefore also impact the accessibility to the areas. In INMAP, changes in the commercial land use is modelled as a function of the restrictions of the land use plans (which regulates the possible activities in the area) and the expected population growth surrounding the area (which reflects the expected customer base/demand). In a nutshell, the approach consists of rescaling the number of jobs within the commercial zones to reflect the future population and travel costs, where the relationship between the variables is determined using the current system as a baseline. However, within a short to medium time horizon it is often enough to use the current employment data in estimating the accessibilities. This is especially true for urban areas in which there are few new commercial areas, and where the potential densification of the existing areas is limited.
Being a simplified LUTI model means that INMAP generates relatively simplistic forecasts as compared to sophisticated LUTI-models that take into account multiple factors in addition to accessibility and historic growth. However, the simplicity of INMAP does, in many situations, provide a benefit in itself – its simplicity enables the user to determine the driving factors behind the given results. Thus, while INMAP ignores there are other factors that may exert influence relative to accessibility (changes in family structure, income, distance to schools etc.), it does enable its users to test the effects of changes to the infrastructure and land use plans for a given set of assumptions.
In this study, the focus has not been on generating forecasts but on using the methodology for land-use quantification and accessibility measurement to analyse the relationship between the land-use plans of the largest Norwegian cities, and accessibility with cycle and E-bike. In the analysis we only consider the current situation, which means that we do not consider the effects of future changes in population and commercial land use. The analysis does also not consider the effects of seasonal variation. The results of the study do thus only apply for the seasons that allows for cycling.
Accomplishing this in a scientific manner required a rigorous approach for estimating the population’s willingness to pay for a given travel cost, and an approach for estimating the travel times with E-bikes (as the Norwegian transportation model generates travel times with traditional bicycle only). In the following section, we describe our approach for dealing with these issues.
Land use development potential and E-bike analysis
Copyright © Institute of Transport Economics, 2019 5
3 Measuring accessibility with bicycle and E-bike
The methodology for estimating accessibility used in INMAP is based on an approach applied for development of the LUTI model for the metropolitan areas of Santander (Coppola et. al. 2013). This means that the accessibility has been estimated as a function of the generalized travelling costs within the regions, the willingness to pay for the given generalized travel cost acquired from statistical databases, and official employment data for the different regions.
Accessibility is modelled as a function that combines the willingness to pay (for a given time cost to a zone) with the number of jobs that can be acquired (from travelling to the zones). As in the case of Santander, we represent the willingness to travel for a given cost (with bicycle) as an exponential function where the willingness reduces as the cost
increases. Simply stated, the accessibility measurements are derived from a stepwise process where we first estimate the travel times between the zones for a given transportation infrastructure (network), estimate the willingness to pay (represented by probability) for the generalized costs associated with the travel times, and finally combine the probabilities for a trip taking place with the official employment statistics of the zones (the mathematical formulation used to estimate the accessibility is given in appendix 1).
The calculations have been performed using the following data-sources:
1. Number of jobs within each zone of the model has been represented by official statistics provided by the National Statistical Institute of Norway – Statistics Norway.
2. Willingness to pay the generalized travel-cost for bicycle has been derived using the Norwegian Travel Survey (2013/14).
3. Travel costs between the wards within the each city region has been estimated using the official Regional Transport Model (RTM) developed by the Norwegian Public Roads Administration (NPRA).
In generating the accessibility measurements, we faced two unique challenges. The first of these being that the transport model generates travel-time estimates for normal bicycle only. Generating corresponding travel times for E-bike required a recalculation of the travel time matrices for bicycle into yielding E-bike estimates. The second challenge consisted of creating an approach for estimating the willingness to pay for the travel costs by bicycle and e-bike. As the estimation of the willingness to pay (WTP) requires a sample of observations to be calibrated against, this is only doable for normal bicycle. Thus, for estimating the WTP for e-bike, we had to use distributions and parameters for bicycle. This means that the estimated WTP for e-bike might be skewed as it only contains the time saving benefits from e-bike. However, this limitation cannot be remedied until there exists a suitable sample of observations of e-bike trips.
In the following sections, we describe the approaches used for overcoming these challenges.
Land use development potential and E-bike analysis
6 Copyright © Institute of Transport Economics, 2019
3.1 Estimated travel time by E-bike
We relied on the estimates generated by the official Norwegian Regional Transport Model (RTM) for the travel times between the municipal wards in Norway. RTM is developed and maintained by NPRA and is the official and mandatory model used in all governmental transportation analyses in Norway. The benefits from using RTM is derived from the fact that this is an official model which undergoes extensive calibration and quality control, regarding the overall performance of the model, the coding of the transportation network, and the acquisition of data undertaken by the Norwegian government. However, while RTM was highly suited for generating travel cost estimates between the zones, it has the shortcoming of generating estimates for the traditional modes only - car, walking, cycle and public transport (bus, rail, metro etc.). Due to lack of travel time estimates by E-bike, we had to develop an approach for generating these estimates ourselves.
Due to the complexity of RTM, the task of re-programming the model to generate E-bike estimates was a job far beyond the scope of this project. We therefore sought a different approach for estimating the traveling times with E-bike between the wards in the
transportation model. To do this, we exploited the fact that RTM generates travel-times for bicycle through a simplistic approach in which it first calculates the travel distance (using normal roads and cycling paths), and then derives the travel time through using an average cycle-speed of 15 km/h.
To generate comparable travel time estimates for E-bike, we used the fact that RTM stores all the travel costs components in its Level of Service (LOS) matrix. Regarding the bicycle estimates, this means that the LOS-matrix contained information on both the minimum distance and the estimated travel time between zones. Using the estimated distances, we further generated comparable LOS metrics for E-bike through combining the estimated travel distance with bicycle with an estimate for the average speed with E-bike.
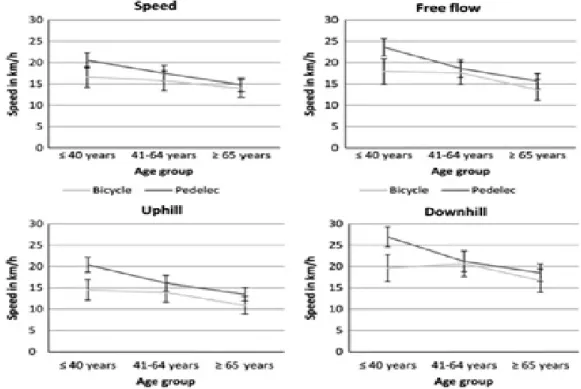
As an estimate for the average speed with E-bike, we relied on the results from the study performed by K. Schfeinitz et al (2017). The measured mean (M) speeds and standard deviation (SD) for the different bikes and infrastructure types are listed in Figure 1.
Land use development potential and E-bike analysis
Copyright © Institute of Transport Economics, 2019 7
Figure 1: Measured speeds for bicycle, pedelec and S-pedelec2 Source: Schfeinitz et al (2017)
Figure 1 depicts the average speeds in free-flow, uphill and downhill for different age cohorts. The data depicted in Figure 1 is of high relevance for several of the potential weaknesses of relying solely on the RTM data.
One of the strongest objections to using the RTM estimates would be the fact that the transportation model only uses distance and average speed in estimating the expected travel time by cycle, which means that it fails to consider the effects of elevation. As the E-bikes are capped 25 km/h, one might assume that the highest benefit of using an E-bike
(regarding speed) occurs in the up-hill stretches. However, Figure 1 depicts that there is a close to a 5 km/h difference between bicycle and pedelec in both free flow, uphill and downhill (for the young travellers). Furthermore, it shows that the difference in travel-time primarily occurs in the age cohort below 60 years of age, where the gap diminishes as the age of the traveller increase. Regarding the re-estimation of the LOS-matrices, the
symmetrical difference in travel speed between normal bicycle and E-bike for both uphill and downhill implied that the effects of elevation on travel speeds (and therefore
accessibility) would be small enough to be ignored.
In re-estimating the LOS-matrices we therefore ignored the elevation effects, and re- estimated the travel times using the average speeds listed in Table 1.
2 Pedelecs (pedal electric cycles) are cycles that assist the rider’s pedaling effort with an electric motor delivering up to 250 watts (CH: 500 watts) at a speed of up to 25 km/h; in the S-Pedelec category the motor’s maximum output is 500 watts and pedal assistance is provided up to a speed of 45 km/h. Push assistance without pedaling is normally 6 km/h. Both categories are subject to differing regulations, which are applied differently in many countries.
https://www.stromerbike.com/
Land use development potential and E-bike analysis
8 Copyright © Institute of Transport Economics, 2019
Table 1: Average cycle-speed used in travel time estimation
Cycle type Average speed (km/h)
Normal Cycle 15
E-bike 22
3.2 Willingness to pay
Having generated the travel time estimates for E-bikes, the next challenge consisted of measuring the willingness to pay for a trip with a given travel-cost. As stated above, the accessibility to jobs, trade and/or services is measured through combining the probability of a person being willing to pay the travel cost of traveling to a ward, with the number of jobs at the destination (where we can distinguish between the total number, trade jobs, services jobs, school-jobs etc). In other words, the probability of the event (trip) multiplied with the outcome of the event (the number of jobs in the destination). The total
accessibility of each ward is equal to the sum of the accessibility between itself and the other wards in the model.
We have measured willingness to travel for a given cost based on The Norwegian National Travel Survey (NTS 2013/14). While the sample contains several thousand
observations/trips, its usefulness for the task at hand is still restricted because it only contains information regarding the actual trips of the respondents on a single day of the year. The sample, in other words, contains information only on the trips the individuals took, and not on the trips they decided not to make.
To overcome these issues, we estimated the willingness to pay using the following approach. First, we restricted the scope of the analysis to cover work trips with lengths equal to or less than 70 km. These restrictions were put in place given that the work trips are easier to model than other trips, and because the transport model generates costs and trip estimates for trips up to 70 km only. In the next step, we accessed the National Travel Survey (NTS) and extracted work trips by bicycle (morning trips) within the city regions with a length of up to 70 km (there are very few bicycling trips longer than this distance in the sample). In total, this equalled to 549 bicycle trips with a mean distance of 4,34 km and a mean travel time of 16 min. The properties of the bicycle trips are listed in Table 2.
Table 2: Sample properties for bicycle trips in NTS 2013/14.
Total Trips Mean Distance
(KM) Mean Travel
time (Min) Mean Cost (Kroner)
Mode: Bicycle 549 4,34 16,10 21,83
Having extracted the data, we transformed the travel times with bicycle for each trip into travel costs using the national standards for the monetary value of time. From this exercise, we acquired a trip cost distribution for each work trip by bicycle within the city regions, covering the ratio of the total trips that fell within each cost estimate. In the final step, we assumed that for each cost observation, the respondent would have been willing to pay less but not more for the same trip. This is of course a strong assumption as there are multiple reasons to why the observed trips are of specific length/cost, and for many instances, the travellers may have been willing to travel longer if a better option had been available.
However, for comparable options it is not unreasonable to assume that the travellers chose the cheaper option.
Land use development potential and E-bike analysis
Copyright © Institute of Transport Economics, 2019 9
Building on the assumption that for each observation, the individual would have been willing to pay less for the trip, but not more, we represented the willingness to pay
measurement through using the reverse cumulative distribution for the costs-distribution.
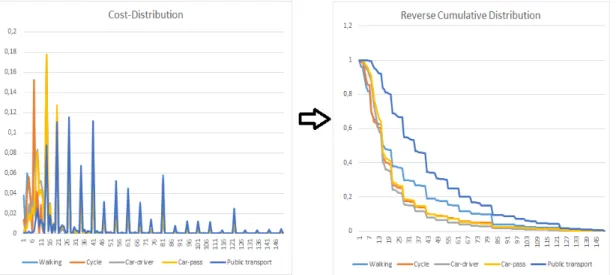
The willingness to pay was thus represented by the ratio of observation at a certain cost (those who paid the given cost), plus the sum of the ratio of trips at a higher cost (those who paid more). The transformation from cost-distribution to the reverse cumulative cost distribution (RCCD) is illustrated in Figure 2.
Figure 2: the cost distribution for each mode (left side) and their corresponding reverse cumulative distributions (right side).
The left graph in figure 2 shows the ratio of cost that belonged to each kroner value, while the right graph shows the corresponding RCCD for each mode. The left graph shows that the values are characterized by spikes. This is the result of the respondents tending to summarize the traveling time to the nearest 10th. From observing the RCCD in the right graph, one sees that the estimated willingness to pay for car-drivers, car passengers and bicycle are highly comparable, while that of walking is somewhat higher than the other three. The highest willingness to pay is for public transport, a result which reflects the case that the public transport trips are in general of a longer duration than trips taken on other modes.
The final step of estimating the willingness to pay for a trip consisted of fitting a curve to the reverence cumulative cost distribution for bicycle, which could then represent the relationship between the costs (from the transportation model) and the willingness to pay (from the travel survey). This was done through programming a search-algorithm that identified the parameter-value that minimized the square fit-residuals between the
accessibility estimate and the RCCD. The estimated fits between the RCCD and the fitted curve of the accessibility equations for each mode is depicted in Figure 3.
Land use development potential and E-bike analysis
10 Copyright © Institute of Transport Economics, 2019
Figure 3: Estimated fit between the RCCD and the estimated curve fit from the accessibility equation for bicycle.
In Figure 3, the y-axis represents the willingness to pay (probability between 0 to 100%) while the x-axis depicts the costs in kroner. The figure shows that the curve-fitting algorithm provided a decent fit between the actual RCCD-curve and the implied distribution from the exponential accessibility-equation for cycling. As depicted by the figure, the distribution derived from the exponential equation implies a very high willingness to pay for trips at low costs and a low willingness to pay at high costs.
3.3 Results
The estimated accessibility for bicycle and E-bike for the different regions are depicted in figures 4 to 6. Each figure depicts the accessibility to jobs by bicycle in the left graph, and the accessibility for E-bike in the right graph. For each mode, accessibility is measured as the number of jobs that are accessible within each ward.
This section provides a graphical illustration and description of the accessibilities, and a more thorough discussion of the results is provided later when they are compared with the results from the land use analysis.
Land use development potential and E-bike analysis
11 Copyright © Institute of Transport Economics, 2019
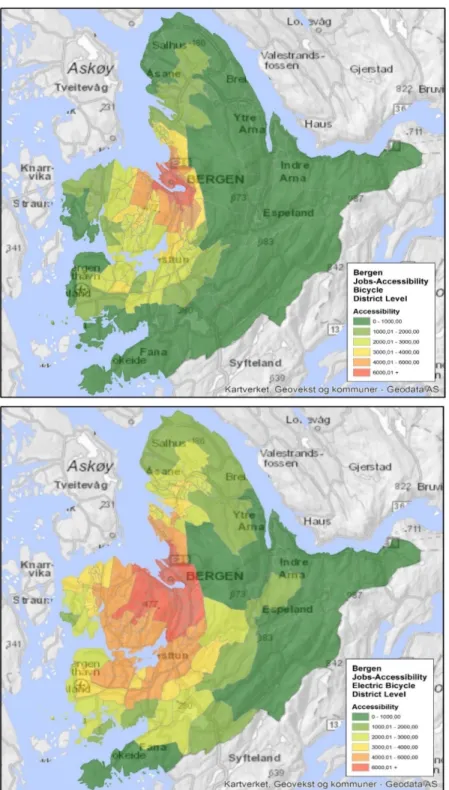
3.3.1 Bergen
Figure 4: Accessibility bicycle (left) and E-bike (right) to workplaces, Bergen
The map to the left shows the accessibility with normal bicycle (average speed of 15 km/h), and the map to the right shows the accessibility with E-bike that has an assumed speed of 23 km/h. From comparing the accessibilities, Figure 4 shows that E-bikes extend the accessibility currently reserved for the city centre to a large share of the surrounding areas. This is especially true for the areas west and south of the city centre.
Land use development potential and E-bike analysis
12 Copyright © Institute of Transport Economics, 2019
3.3.2 Trondheim
Figure 5: Accessibility bicycle (left) and E-bike (right) to workplaces, Trondheim
Figure 5 shows that the E-bikes extend the accessibility provided by bicycle, primarily concentrated in the central parts of the city, to large tracts towards the eastern and southern areas of the city.
Land use development potential and E-bike analysis
Copyright © Institute of Transport Economics, 2019 13
3.3.3 Stavanger, Sandnes and Sola
Figure 6: Accessibility bicycle (left) and E-bike (right) to workplaces, Stavanger, Sandnes and Sola
From comparing the accessibility with bicycle and E-bike, the maps show that E-bike greatly increases accessibility compared to normal bicycle. The map to the left shows that there are no areas that has an accessibility equal to more than 6000 jobs with normal bicycle, while E-bikes greatly enhance this constrained accessibility to jobs.
Land use development potential and E-bike analysis
14 Copyright © Institute of Transport Economics, 2019
3.3.4 Oslo
Figure 7: Accessibility bicycle (left) and E-bike (right) to workplaces, Oslo
Figure 7 shows that the E-bike greatly increases the accessibility of the travellers compared to normal bicycle in Oslo. A large part of the area surrounding the city centre has a higher accessibility with E-bikes than one acquires in the inner city with normal bicycle. The figure furthermore shows that the E-bikes extend the accessibility currently reserved for normal bicycle to a wider area surrounding the city.
Land use development potential and E-bike analysis
Copyright © Institute of Transport Economics, 2019 15
4 Estimation of growth potential based on land use plans, and its importance
An important step of INMAP modelling consists of estimating the growth potential according to existing and future land use plans and strategies. This is important because, from experience such as the example given below, land use determines a major part of the transportation demand.
Figure 8 shows the growth areas according to the strategic general plan of the City of Bergen (2016-2040). The plan is the guideline for land use and the more detailed land use planning such as the zoning plans. Figure 8 shows the contours of the wards in red, and the existing urban area in yellow and brown. The brown areas represent the growth areas. The growth is designated to seven densification zones including the city centre as well as other centre localities.
Striped areas are future green field developments that were removed from the plan as part of the revision process.
The new general plan of Bergen has a strategy consisting of the removal of some of the future green field areas (which are future development areas away from the city center), increase the growth in the city area and at the public transport oriented centres. As one of the main objectives in Norwegian land use and transportation planning is to reduce growth in private car traffic in the major cities, Rambøll has previously worked on estimating the change in vehicle kilometers travelled by private car in several scenarios (Uteng and
Kittilsen 2017b). The report is published online in Norwegian3 and is used as a reference in the following analysis.
As part of the analysis, the sum of population growth from the start year (2016) till the year of analysis (2040) was distributed differently according to the different scenarios:
In scenario 0, approximately 45 % of the population growth was distributed to the future green field developments, as this was the estimated growth potential of these areas. The rest of the growth was distributed according to accessibility to jobs and historic growth rates. This resulted in the following distribution:
• City centre and Bergensdalen: 26 %
• Other centre areas: 11 %
• Other urban area within the municipial limits: 18 %.
In scenario A, the population growth was distributed amongst the city and local centres.
Approximately 45 % of the growth was located in the city centre and the adjacent Bergensdalen, while the rest were located in the other local centres.
3 http://www.kit-samarbeidet.org/wp-content/uploads/2017/12/2017-11-17-Rapport-Ramb%C3%B8ll- Transporteffekter-av-ny-kommuneplan-for-Bergen.pdf
Land use development potential and E-bike analysis
16 Copyright © Institute of Transport Economics, 2019
The goal of the calculations was not so much to test how realistic these alternatives were (even if the estimated growth is achievable within the defined densities of the land use plan), but to estimate the effects on modal split according to different land use strategies.
Table 3: Population distribution according to two different land use scenarios for the City of Bergen: Old and new general plan
Zone Population growth Alternative 0:
Old plan
Population growth Alternative A:
New plan
Other urban area 9 600 1 800
Arna 350 3 300
Green field
developments 22 800 0
Fyllingsdalen 1 340 8 000
Loddefjord 480 3 300
Nesttun 1 300 3 400
Sentrum and
Bergensdalen 13 500 24 800
Ytrebygda 650 3 300
Åsane 1 200 3 300
Sum 51 300 51 300
Land use development potential and E-bike analysis
Copyright © Institute of Transport Economics, 2019 17
Figure 8: Visualization of growth areas in the City of Bergen according to the new general plan of 2016. Former green field developments removed from the plan are shown as striped areas.
Land use development potential and E-bike analysis
18 Copyright © Institute of Transport Economics, 2019
Table 4: Change in estimated vehicle kilometers travelled for private car driver according to different land use scenarios Bergen, Norway
Name SUM
Vehicle (1000) km
GROWTH Vehicle km 2016- 2040 (1000)
GROWTH
% 2016- 2040
REDUCED GROWTH Vehicle km Alternative: vs.
Former General Land
use plan
Today’s situation 5 195 - 0,00 % -
National transportation plan forecast 6 400 1 203 23,19 % 13 % Former general plan including green field
developments 6 577 1 382 26,59 % -
New general plan green fields excluded and growth redistributed to densification areas (only changed future distribution of inhabitants)
6 263 1 068 20,55 % 23 %
Optimized localizing according to
walkability, bike and public transport within growth limits of the general plan for future inhabitants
6 169 974 18,75 % 29 %
New general plan (distribution of future
inhabitants and parking) 5 986 791 15,22 % 43 %
New general plan (distribution of future
inhabitants, employees and parking) 5951 756 14,55% 45%
Source: Uteng and Kittilsen, 2017a
The results in Table 2, first and foremost, illustrate the importance of considering land use plans, and secondly, taking into account the new development areas. The difference between alternatives illustrate how green field developments disproportionately affect transportation demand, and further how densification and the following lower car parking accessibility per capita gives less car use.
Even if the results above are related to change in car usage and not E-bike, the results show the significance of taking account of land use plans or planned major housing developments while engaging in transportation analysis and planning.
The INMAP-tool however, allows for several ways of estimating or taking account of the growth potential. In short, the first task is to do analyses with INMAP and GIS based on the land use objectives/zoning, the extent of the surface area in the land use maps, allowed density, and the consumption of space per capita. The steps in the process are
schematically illustrated in Figure 9, and described in further detail in section 4.2. The second task is to plot an existing analysis into the INMAP-tool. The latter comes in handy when the local government has already made an estimate and analyses of growth potential.
The former is the more complex way of performing this task and is the one that we will describe more in depth in section 4.2. For Bergen and Stavanger, we originally used the former method. The Bergen General plan however has later been revised and thus we have made a revised and simplified estimate based on the new strategic general plan which is described in section 4.1. For Oslo and Trondheim, we have used the existing data generated by the cities themselves and only processed the data to the level of analysis (ward) in the INMAP-tool.
Rambøll had, prior to this study, already estimated growth potential for the cities of Bergen, Stavanger and Trondheim as well as their neighbouring municipalities using the INMAP-tool. These data sets have been used as a foundation to estimate the effects on transportation related to different land use scenarios for the City of Bergen, Trondheim and the Region of Greater Stavanger (Jæren).