Lotta, thank you for giving me the opportunity to continue this PhD and introducing me to the world of POPs. Members of the Systems Epidemiology research group (too long a list to list them all), thank you for all the academic and social gatherings we have had. Thank you for being strong for me, you are a fighter and I am proud of you.
Type 2 Diabetes Mellitus
- Definition
- History
- Epidemiology
- Etiology and pathophysiology
- Risk factors for T2DM
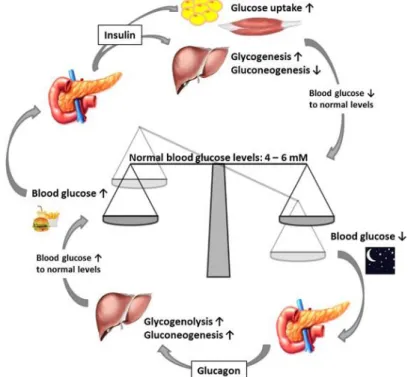
DM is characterized by elevated blood glucose levels (hyperglycemia) caused by insufficient insulin secretion, insulin resistance (IR), or a combination of both. In addition, glucagon promotes renal and hepatic gluconeogenesis (the synthesis of glucose from non-carbohydrate precursors) to increase endogenous blood glucose levels. Briefly, abnormally high blood glucose levels are caused by dysfunctional feedback loops between insulin secretion and insulin use.

Persistent Organic Pollutants
- Polychlorinated biphenyls and organochlorine pesticides
- Polybrominated diphenyl ethers
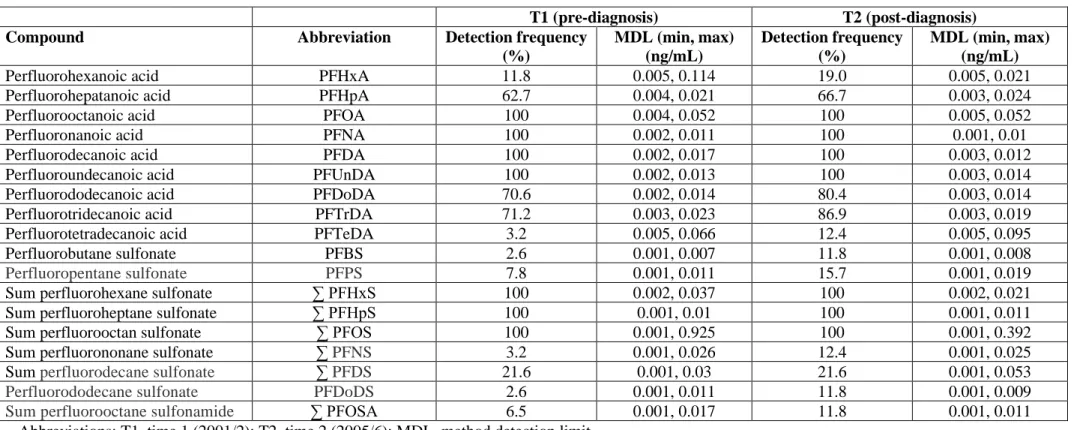
- Perfluoroalkyl acids
- Exposure and time trends of POPs in humans
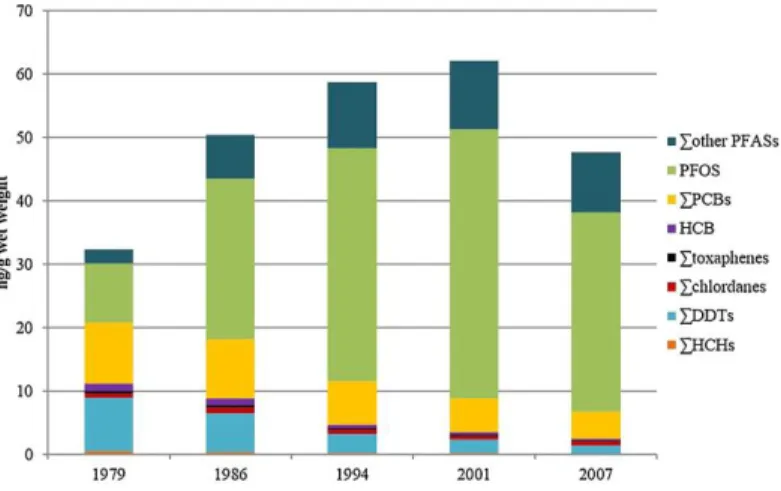
Wet weight concentrations of PCBs, OCPs and PFAAs from 1979 to 2007 for 53 men using repeated measurements in the Tromsø study. Specifically, a decrease in body weight and an increase in lipid levels lead to a slower decrease in the body burden of POPs (76, 77). In women, POP concentrations in the body are further affected by reproductive events: increasing parity and lactation period have been shown to be inversely related to POP concentrations (60, 79).
Health effects of POPs
- Associations between POPs and T2DM
- Obesogen hypothesis
- Molecular mechanisms linking POPs to T2DM
- Complexity of the POPs-T2DM relationship and rationale of the study
Longitudinal studies with repeated measures of POP in the same individuals that could address these issues were lacking. The relationship between POPs and T2DM is extremely complex due to the accumulation of POPs in adipose tissue, decreasing time trends in human concentrations of many POPs, and the constant rise in the prevalence of T2DM. Prospectively and cross-sectionally investigate the relationship between PCBs, OCPs, PBDEs, PFAAs and T2DM in the same subjects.
Study Populations
Norwegian Women and Cancer Study (NOWAC) – PFAAs paper
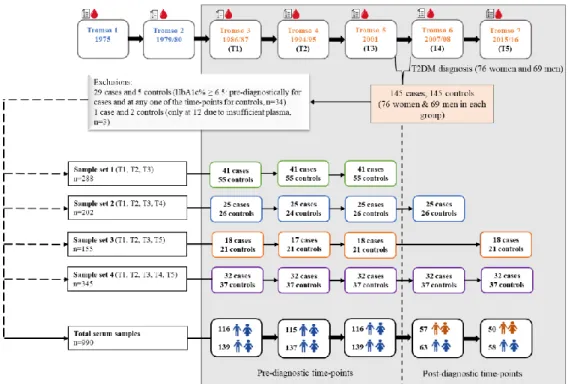
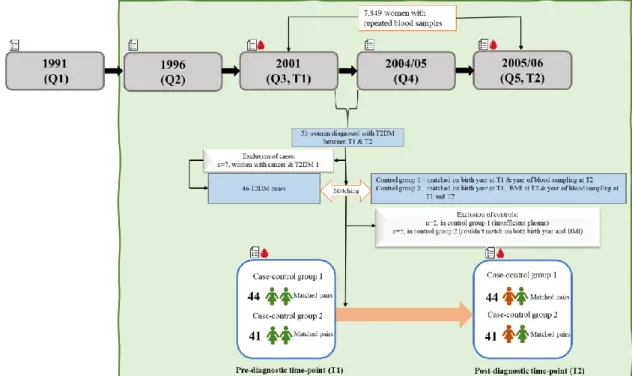
Two controls from control group 1 were excluded because of insufficient plasma, and five from control group 2 were excluded because matching was not possible. In total, there were forty-four matched pairs in case-control group 1 and forty-one matched pairs in case-control group 2 in the final sample (Figure 5). Gray boxes represent the years when questionnaires (Q) and blood samples (T) were given to the NOWAC study.
Tromsø Study – PCBs, OCPs, and PBDEs papers
Study design and study example for the papers (PCBs, OCPS and PBDEs) of Tromsø study. The gray box represents the questionnaires and blood samples (T1-T5) and the flow diagram for the different sample sets and the total study sample used in the two papers.
Analytical Methods
PFAAs analyses
The dotted line separates the pre-diagnostic time points (T1-T3) from the post-diagnostic time points (T4, T5). within three times the standard deviation of the reference concentrations, along with a relative standard deviation of .
PCBs, OCPs, and PBDEs analyses
Lipids analyses
Identification of Type 2 Diabetes Mellitus cases
Covariates
The covariates in the PFAA paper were age (years), breast feeding (months), and dietary factors (meat, fish, dairy, fruits and vegetables [xg/day]). All covariates were extracted directly or calculated from variables extracted from the Tromsø questionnaires at each time point. Although lipid measurements were available at the different time points in the Tromsø surveys, the measurements from the serum lipid analysis were used.
Statistical Analysis
- Data handling
- Assessment of associations between POPs and T2DM
- Assessment of time trends in POPs
- Additional analyses
For the articles on PCBs, OCPs and PBDEs, sex, age (years), weight change (kg), breastfeeding (months), parity, total lipids (g/L), physical activity (categorized in 0=inactive ; 1= active) and BMI (kg/m2) were the selected covariates to be included in the analyses. A large proportion of the PBDE concentrations in the study sample were below the sample-specific MDL. The associations between PBDEs and T2DM were also assessed using PBDE concentrations divided into tertiles in the multivariable logistic regression.
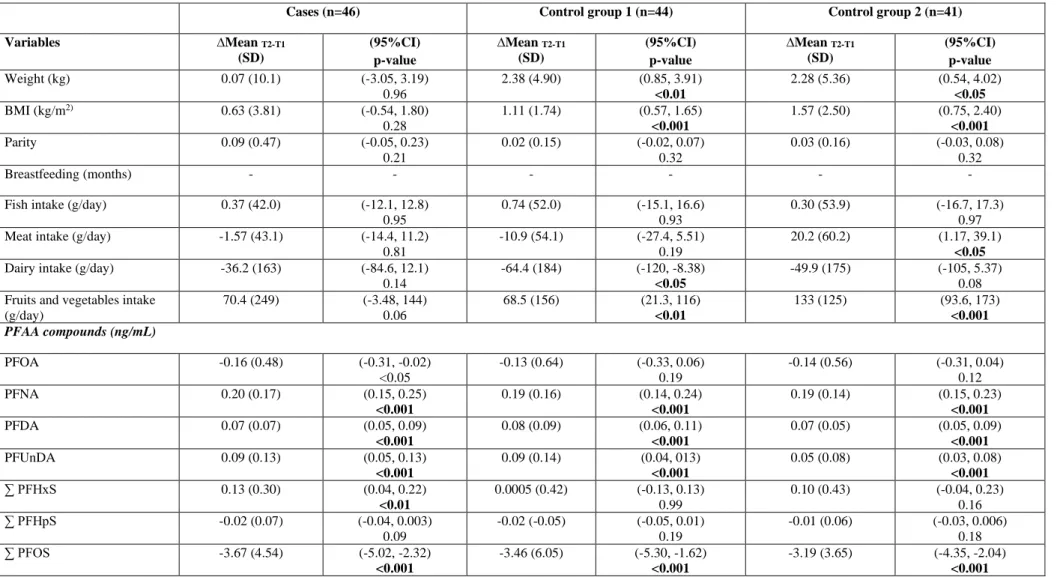
Ethics
In addition, we compared associations using the multiple imputation method with two other substitution methods for PBDE concentrations Study sample characteristics Spearman correlations between PBDEs and the PCBs and OCPs showed the strongest negative correlation between p,p'-DDT and BDE-183 (rs=-0.50) at T5 and the strongest positive correlation between ∑PCBs and BDE-47 (rs =0.56) at T1. Cases and controls had similar PBDE concentrations at all time points except BDE-99 at T1 and BDE-100 and BDE-183 at T4, for which controls had higher concentrations. Strong positive correlations were observed between the different PFAAs at both time points, most strongly between ∑PFOS and ∑PFHpS (rs=0.92) at T1 and between PFUnDA and PFDA (rs=0.90) at T2. At T1, no differences in mean PFAA concentrations were observed between cases and both control groups. Inverse associations were observed for case-control group 1 pre- and post-diagnostic for all PFAA concentrations. For case-control group 2, positive associations were observed for PFNA, PFDA, PFUnDA, PFHpS and PFOS at the pre-diagnostic time point and for PFDA and PFUnDA at the post-diagnostic time point. BDE-47, 99 and 100 mainly showed inverse associations with T2DM at the pre- and post-diagnostic time points, while BDE-153 and 154 showed positive associations. The results were comparable in the direction and strength of the associations for the different substitution methods. When comparing the cases and controls, T2DM status did not appear to influence time trends in any of the PFAA compounds, but was determined by age and dietary factors. In our study, we observed strong prediagnostic positive associations between cis-nonachlor, cis-heptachlor epoxide, p,p'-DDT and T2DM. In addition, cases also showed a slower decline in cis-heptachlor epoxide at pre-diagnosis time points. In our study, the slower time trends in cases before T2DM diagnosis continued at the postdiagnosis time point (T4), where cis-heptachlor epoxide showed a strong association. PFAAs and T2DM Further, matching may have disadvantages, for example, if stratified analysis is to be performed, then case-control pairs must be kept as paired in analyses. This can be done either by including age as a covariate in the analyzes or by performing a conditional logistic regression (142). In the papers with PCBs, OCPs and PBDEs, we did not match cases and controls. It was an inclusion criterion in the study design that controls participated in at least the same surveys as cases (but could have participated in more surveys), since otherwise, we could have had selection bias in the controls, which for example they did not more surveys do not participate due to serious illness or death. For PCBs, OCPs, and PBDEs, we adjusted for confounders in the statistical analyses. But we chose to adjust for the physical activity variable as it was less missing, and the questionnaires were validated in the Tromsø study (153). Thus, although physical activity is adjusted for in the analysis, residual confounding due to the physical activity variable may still be present. Residual confounding describes the situation where confounding is still present after adjustment for confounders in the design or analysis. For example, in the paper with PCBs and OCPs, according to DAG, we had to adjust for either physical activity or diet in the logistic regression models. In the Tromsø study, physical activity was measured using two different physical activity questionnaires at different examinations, namely the Saltin-Grimby Physical Activity Level Scale and The Physical Activity Frequency, Intensity, and Duration questionnaires. It is, for example, common to underreport weight or BMI in self-reported questionnaires, and this was also seen in the NOWAC study. Self-reported BMI in the NOWAC showed a small but statistically significant underreporting of weight among overweight and obese women, with the greatest degree of underreporting for those with obesity (156). In addition, cross-validation of self-reported information using medical records or registries may be beneficial to reduce such bias. In the distribution-based multiple imputation approach, different data sets are created by replacing each Recent research has also focused on other risk factors, such as persistent organic pollutants (POPs), and has identified positive associations between T2DM and various polychlorinated biphenyls (PCBs) and organochlorine pesticides (OCPs) (Magliano et al., 2014; Taylor et al., .The coefficients of variation (CVs) for the measured POPs ranged from 6 to 24% in the present study, which was within previously established acceptable limits (Huber et al., 2020).Only two previous studies have compared POP measures in one pre- and a post-diagnostic sample of the same T2DM cases and controls (Berg et al., 2021; Tornevi et al., 2019). PCBs, Tornevi and colleagues (Tornevi et al., 2019) reported that T2DM cases experienced smaller declines compared to controls. Odds ratios (ORs) and 95% confidence intervals (CIs) for associations between a one-standard deviation (SD) increase in wet weight concentrations of persistent organic pollutants (among controls) and type 2 diabetes mellitus in different time points (T ) in the Tromsø Study. In addition, research has addressed the links between T2DM and factors such as epigenetics, stress and environmental pollutants (Bellou et al., 2018). A detailed account of the study design, study participants and data collection has been published (Charles et al., 2022). The PBDE concentrations were lipid-normalized (ng/g lipid) by dividing the wet weight concentrations (pg/mL) by the total lipid concentrations (g/L) where, total lipids = 2.27*total cholesterol + triglycerides + 0.623 (g/L ) (Phillips et al., 1989). We used Spearman's rank correlations to determine monotonic relationships at each time point between the different PBDEs and other legacy POPs measured in the same samples and previously published (Charles et al., 2022). Sex directly affects concentrations of PBDEs in the body (Zhao et al., 2021), and may increase the risk of T2DM (Huebschmann et al., 2019). Odds ratios (ORs) with 95% confidence intervals (CIs) for the associations between a one-standard deviation (SD) increase in lipid-normalized concentrations of PBDEs (among controls) and type 2 diabetes mellitus at different time points (T) in the Tromsø - study. The lack of association between PBDEs and T2DM in pre-diagnostic samples is in line with one previous prospective study based on concentrations of PBDEs in serum samples (Turyk et al., 2015). Others have also reported weak or moderate correlations between PBDEs and PCBs in human breast milk (She et al., 2007). Odds ratios (ORs) and 95% confidence intervals (CIs) for the associations between one-standard deviation (SD) increase in lipid-normalized concentrations (ng/g lipid) of polybrominated diphenyl ethers (among controls) and type 2 diabetes mellitus ( T2DM ) at different time points (T) in the Tromsø study.Descriptive statistics for POPs
Associations between POPs and T2DM
Time trends in POPs
Discussion of the main results
PCBs, OCPs, PBDEs, and T2DM
Methodological Considerations
Study design
Selection bias
Confounding
Effect modification
Information Bias
Censored data and multiple imputation
Generalizability