The "Trends in risk level on the Norwegian Continental Shelf" project started in the year 1999. The industry has traditionally used a selection of indicators to illustrate safety trends in the petroleum activities. For the parties in the industry, it is important to establish methods to measure the impact of the industry's overall safety work.
There was a significant reduction in the number of hours of total outstanding corrective maintenance in 2019 compared to the previous year. Only one of the questions (about the frequency of sedentary work with little opportunity for variation) was rated more negatively in 2019 than in 2017. In addition, 20 of the questions in the survey dealt with the psychosocial and organizational work environment.
Work undertaken
- Performance of the work
- Use of risk indicators
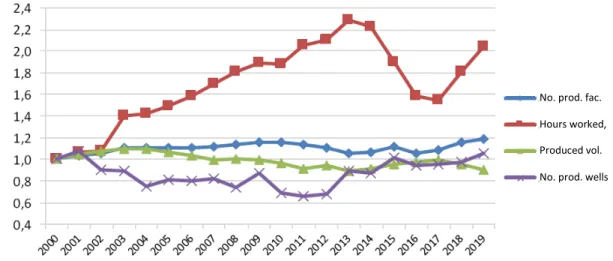
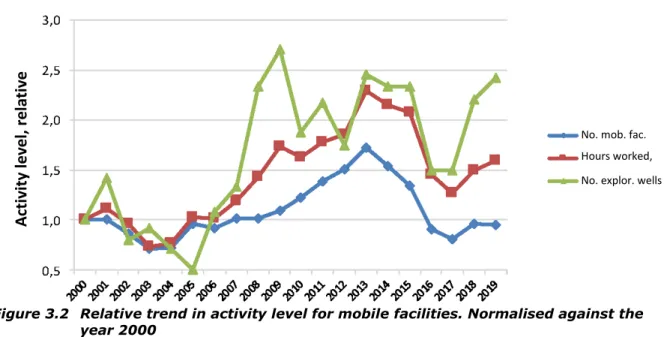
- Developments in the activity level
- Documentation
Test data related to the performance of major accident barriers at the facilities, including data on well status and maintenance management. A major accident is an accident caused by the failure of one or more of the system's built-in safety and preparation barriers. Viewed in the light of the definition of major accidents in the Seveso II Directive and in the PSA regulations, the definition used here is closer to a 'major accident'.
Data collection for the DFUs (defined hazard and accident conditions) in connection with major accidents is partly based on existing databases in the Petroleum Safety Agency (CODAM, DDRS etc.), but also to a significant extent on data collection carried out in collaboration with the operating companies and shipping companies. All incident data is quality assured by, for example, checking it against the incident register and other databases in Ptil. Report for acute releases to the sea for the Norwegian continental shelf 2019, to be published in autumn 2020.

Survey questionnaire
Both offshore and onshore, the percentage of women who responded to the survey compared to the percentage of men is lower in 2019 than in 2017. When it comes to work areas, maintenance is the largest group both offshore (31%) and on land (38.3%). Overall, we are seeing an improvement in the assessment of HSE at both offshore and onshore facilities.
HSE Index 7, "freedom to speak", has a significant improvement at both offshore and onshore facilities. In terms of the psychosocial work environment, we are also seeing generally positive changes abroad and onshore. For neck/shoulder/arm pain, 43% of employees at both offshore and onshore facilities perceive it to be related to their work situation.
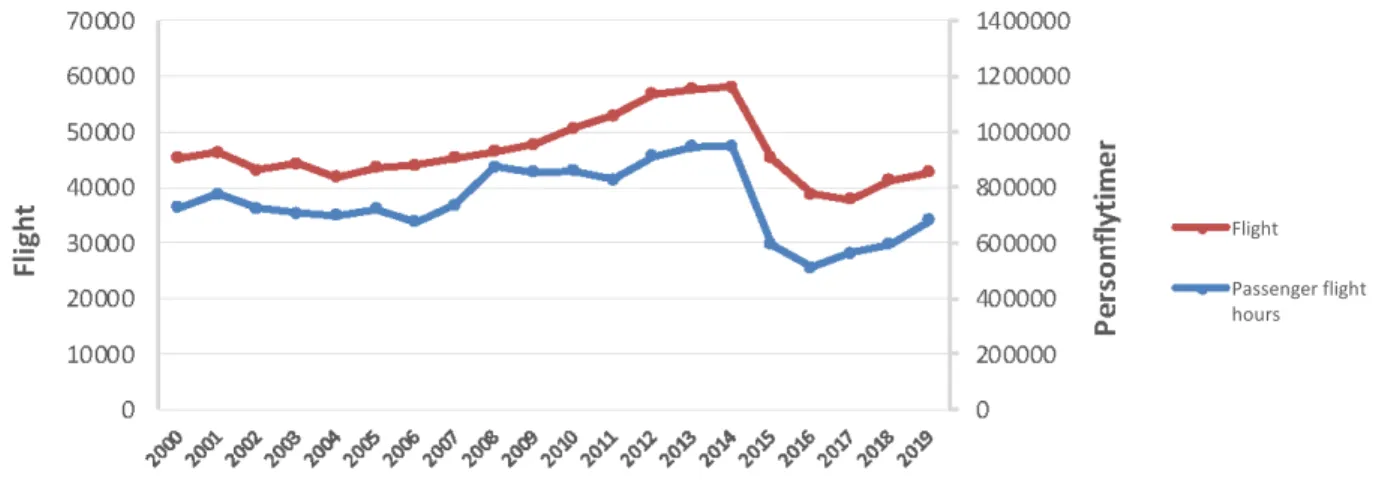
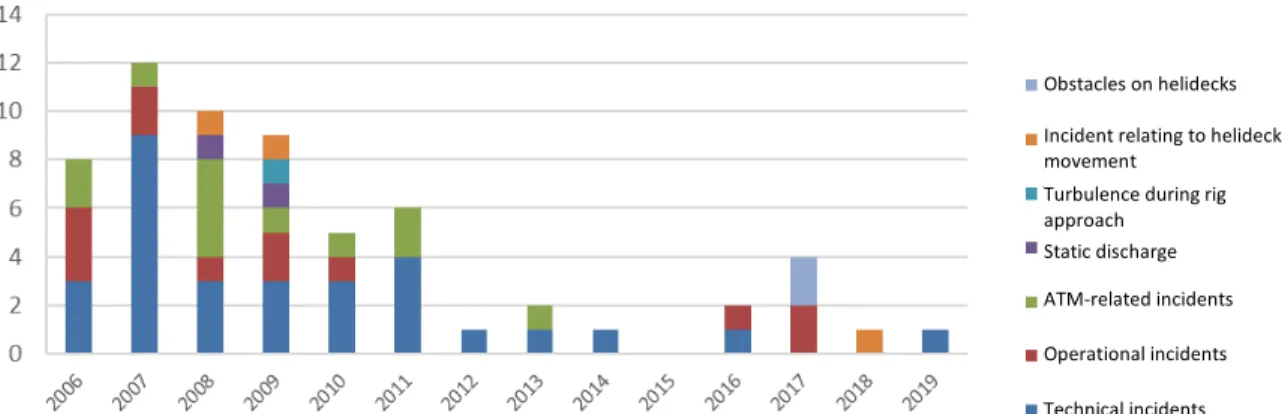
Status and trends – helicopter incidents
Activity indicators
Incident indicators
Status and trends – indicators for major accidents on facilities
DFUs associated with major accident risk
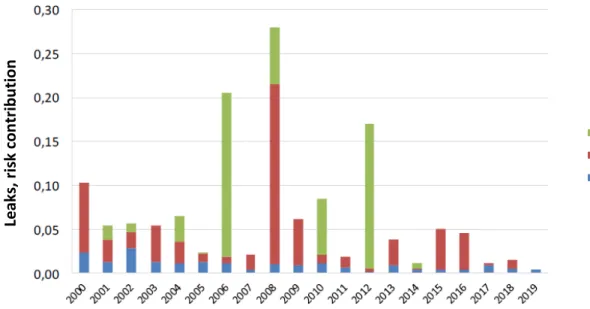
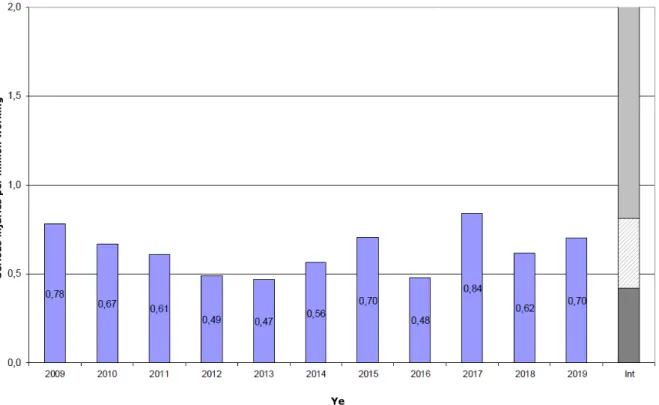
In simple terms, one can say that the risk contribution of each leakage is roughly proportional to the leakage rate expressed in kg/s. The risk contribution in 2019 is the lowest observed in the period, due to few leaks in general and no leaks exceeding 1 kg/s. The figure illustrates the technique used throughout to assess the statistical significance (validity) of trends.
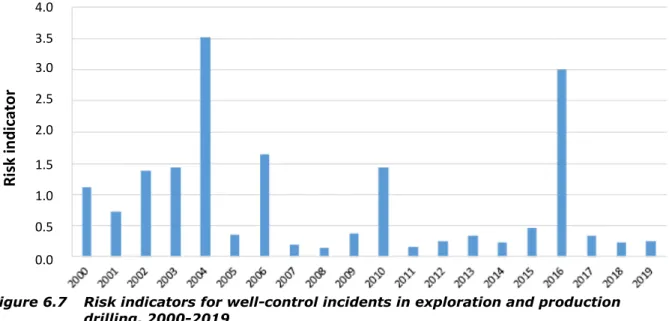
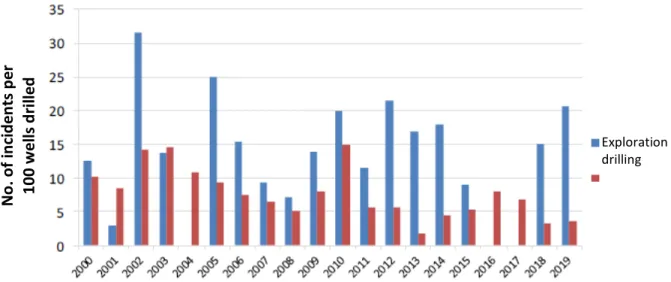
Furthermore, the figure shows that the number of leaks per year of the facility in 2019 is within the forecast range. The number of leaks is normalized against both the working hours and the number of facilities in the main report. There were 19 well control incidents in 2019, seven in production drilling and twelve in exploration drilling.
Eighteen of these fell into the lowest risk category, but one fell into the medium category. From 2018 to 2019, an increase in the number of incidents related to both production drilling and exploration drilling has been observed.
Leaks, risk contribution Number of incidents per mill working hours
2016 and 2017 were marked by zero exploratory drilling incidents, while 2018 and 2019 saw well control incidents for exploratory drilling dominate again. The figure shows that there was a relatively low risk associated with well control incidents in the NCS. The Norwegian Oil and Gas Association has continued to work on well integrity issues through the Well Integrity Forum (WIF), a working group of the Drilling Managers Forum.
Norwegian Oil and Gas Recommended Guidelines 117 also discusses recommendations regarding training, documents for the transfer of wells between different departments in the companies, including well barrier drawings and criteria for categorizing wells.
No. of incidents per 100 wells drilled Risk indicator
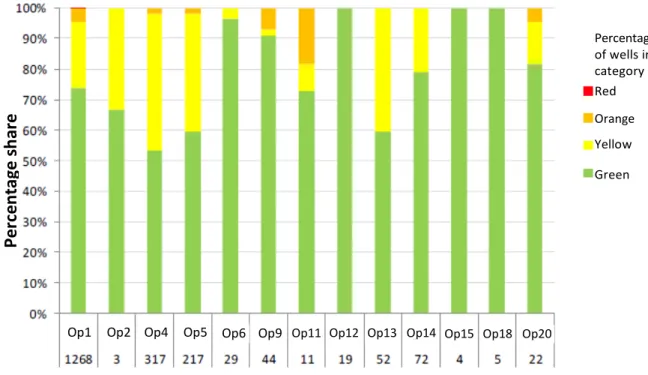
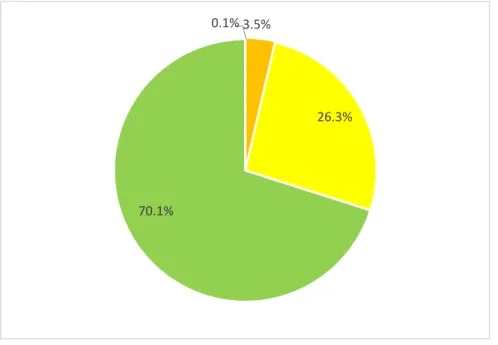
Red Failure of one barrier and the secondary is degraded/uncontrolled, or leaking to the surface. Orange Failure of one barrier and the secondary is intact, or single failure that may cause leakage to the surface. The mapping in Figure 6.8 shows an overview of well categorization according to percentage share of a total of 2,063 wells.
The categorization shows that about 30% of the wells included in the map have a poor degree of integrity. Wells in the red and orange categories have reduced quality relative to the two-barrier requirement. Yellow-category wells have reduced quality in terms of the two-barrier requirement, but companies have compensated for this with various measures that are thought to meet the two-barrier requirement.
There were also no serious pipeline leaks reported within the safety zones of surface facilities in 2019. Outside the safety zones of surface facilities, three incidents of pipeline leaks were reported. No hydrocarbon leaks were reported from subsea production plants in 2019, but some spills of hydraulic fluids and chemicals were reported, mostly related to valve operation.
In one case, a bend concealer came loose from the attachment and slid down the pipe, while in the other the anchor of a Mid Water Arch broke. Serious damage to risers and pipelines is included in the calculation of the total indicator, but with a lower weight than for leaks. The indicator for ships on potential collision courses is normalized by the number of facilities monitored from the traffic center at Sandsli, expressed as the total number of monitoring days for all facilities monitored by Statoil Marine at Sandsli.
Number of leaks from risers and pipelines
There are only a few production facilities and still only a few mobile facilities where the facility itself or the assistance vessel is responsible for monitoring passing ships on a potential collision course.
Number of serious instances of damage to risers and pipelines
Status and trends – barriers against major accidents
- Barriers in the production and process facilities
- Barriers associated with maritime systems
- Maintenance management
The differences are even greater when looking at each individual object, as is done for all the obstacle elements in the main body. ESDV rise leakage test and flood show a mid-period increase and a decrease from 2015 to 2017. ESDV surge leakage test and flood closure and rise are the barrier elements showing the greatest change and, for these, the trend in the percentage of failures is increasing.
There is considerable variation in the number of tests per facility, from daily tests to twice a year. The high accident potential means that safety work in general and the maintenance of safety-critical equipment in particular have received much emphasis in the petroleum industry. By getting an overview of the current situation and trends over time, the industry and the authorities can more easily prioritize areas in the work going forward.
The figure shows that some facilities have a significant number of hours of corrective maintenance that have not been performed so far and for some the number of hours is significantly higher than in previous years. We can see that the preventive and corrective maintenance hours performed in 2019 are slightly higher than the previous year. HSE's overall corrective maintenance outstanding is on par with the past three years.
The status is this context includes the remaining amount of preventive maintenance and outstanding corrective maintenance. Some facilities have not performed critical HSE corrective maintenance in accordance with their deadlines.

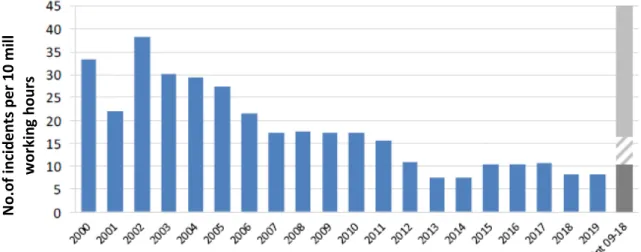
Work accidents involving fatalities and serious personal injuries
The level of activity on the NCS increased by 5.2 million to 45.7 million working hours last year. The level of damage is therefore within the expected values based on the past ten years. Over the entire period, in 3 out of 11 years, the rate stands out positively relative to the average4.
The remaining eight years fluctuate around the average and there is no improvement trend during this period. 4 The frequencies in 2009 and 2010 were lower than the expected value in relation to the previous ten-year periods at that time.
Other indicators
- DFU20 Crane and lifting operations
- DFU21 Falling objects
- Other DFUs
DFU21 Falling objects includes all incidents where an object falls within the safety zone of a facility, either on deck or in the sea, with the potential to become an accident, and which does not involve cranes and lifting equipment and their use. Incidents linked to cranes and lifting equipment and their use are presented in DFU20. From the 2015 report, a new DFU20, Crane and lifting operations, has been introduced for offshore installations, which has caused changes in DFU21 Falling objects.
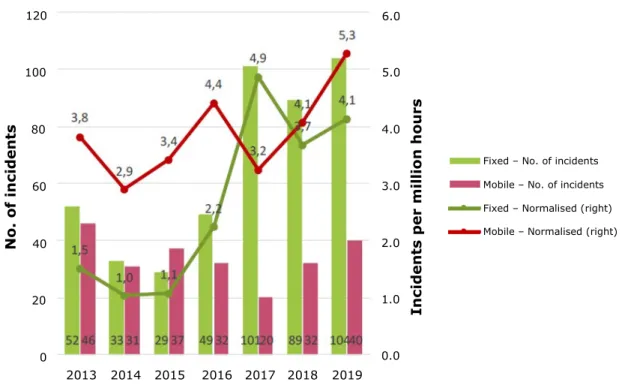
The number of reported incidents at fixed facilities has increased slightly and is higher in 2019 than in any previous year. 2019 saw the highest number of injury incidents over the entire observed period, with a total of 11 at fixed facilities in 2019 compared to 10 in 2018. In drilling areas, there is a very significant increase in the number of incidents >40 J from 2018 to 2019; a threefold increase.
The increase is mainly related to the work processes in operations and operations in the drilling area (see Figure 9.8). For scaffolding, there was also an increase in the number of incidents related to (dis)assembly and use of scaffolding in 2019, for incidents with both energy classes <40 J and >40 J. The normalized data (events per million working hours relevant for construction and maintenance) shows the same trend for both energy categories (see Figure 9.9).
For incidents without personal injury, but with the potential for injury, there is a negative trend, in that the proportion of incidents with exposed personnel (two persons and several persons) increases compared to 2018 (see Figure 9.10). In 2018, mobile facilities saw an increase in reported incidents after a number of years of a weak downward trend. This comes on top of an already strong increase from 2017 to 2018, and applies to both absolute and normalized numbers of incidents.
The increase relates mainly to work processes in operations in the drilling area (see Figure 9.12).
Definitions and abbreviations
- Definitions
- Abbreviations