The presence of NPs inside the cells was confirmed through fluorescence microscopy and DeltaVision™ deconvolution. These results will contribute to our understanding of the effects of nanoplastic exposure on fish health and generally provide valuable insights into the implications of nanoplastic pollution in aquatic ecosystems.
Salmon aquaculture
Over the past decade, a variety of frameworks, regulations and treatments have been implemented to make farmed salmon production more sustainable. Additionally, the physical handling of farmed salmon for parasites creates a risk of open skin wounds.
Atlantic Salmon (Salmo salar)
Teleost Head kidney
It is an important important organ in the immune system of fish and comprises lymphoid cells that produce cytokines and endocrine cells that secrete cortisol, catecholamines and thyroid hormones (Geven & Klaren, 2017) (Figure 1). The master kidney is special in that the immune and endocrine systems are tightly organized in a single organ, allowing bidirectional signaling.
A. salmon derived cell lines
HK is rich in macrophages, which play a particularly important role in innate and adaptive immunity (Cui et al., 2020).
Chinook salmon (Oncorhynchus tshawytscha)
CHSE-214 cells
As with SHK-1 cells, these cells have also been shown to internalize infectious pancreatic necrosis virus (Levicán-Asenjo et al., 2019). The CHSE-214 cell line is an epithelial-like cell line, originally from 1964, and since then it has been used in a number of studies mainly related to antiviral responses (Monjo et al., 2017).
Cell marker staining
Furthermore, embryonic cells from other aquatic species such as sea bass (Dicentrarchus labrax L.) (Picchietti et al., 2017) and zebrafish (Danio rerio) (Quevedo et al., 2021) have previously been shown to take up nanoparticles. The dyes accumulate in acidic compartments due to a negative membrane potential, and a higher negative membrane potential will result in higher accumulation (Perry et al., 2011).
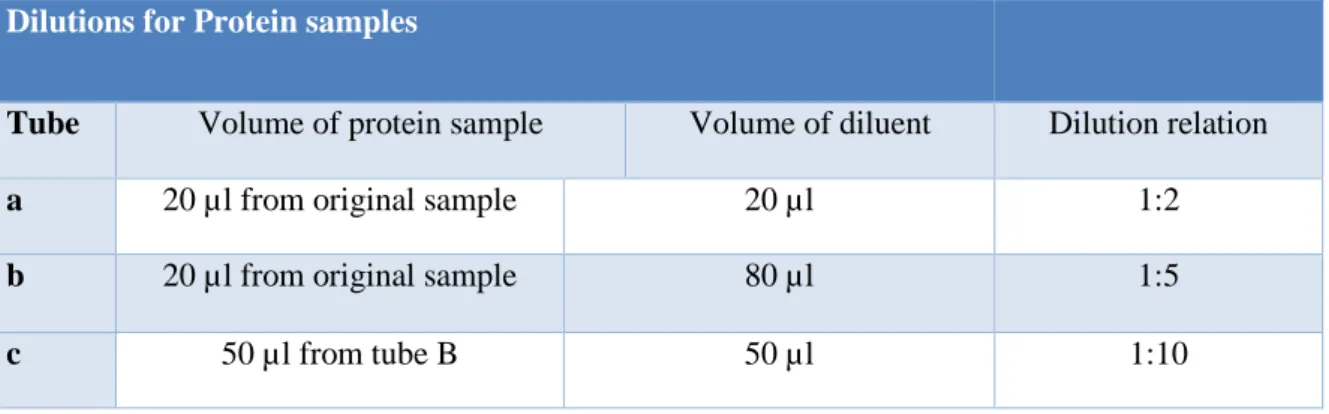
Plastics in marine environments
Nanoplastics
Recent advances in tools and knowledge to analyze marine pollutants have revealed the ubiquitous presence and accumulation of these small plastic particles, which has become a source of great concern (Quecholac-Piña et al., 2017). There is documentation of NP uptake in various cells of different species, including iris gill epithelial cells (Felix et al., 2017), epidermal keratocyte-like cells A.
Polystyrene
Particles were found to be adhered/taken up in fish skin and gills, muscles and liver (Yang et al., 2020). Indeed, macrophage-like immune cells from the gut, blood, and kidney have recently been shown to phagocytose microplastics to varying extents in vitro (Abihssira-García et al., 2020).
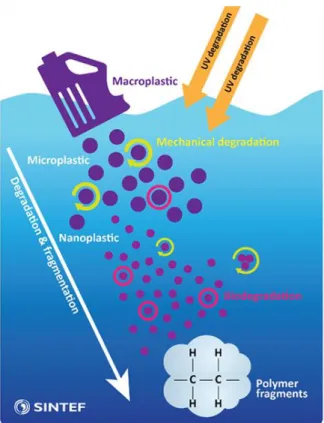
Cellular internalization and intracellular transportation
Oxidative stress is a state of imbalance in the production of reactive oxygen species (ROS) and the antioxidant defense (Birnie-Gauvin et al., 2017). Ingestion and accumulation of MPs in aquatic species has been shown to induce an increase in oxidative damage and inflammatory markers (Solomando et al., 2020).
Protein pathways implicated in cellular uptake and stress responses
- Apoptosis pathway (map04210)
- p53 signalling pathway (map04115)
- Autophagy pathway (map04140)
- Phagosome pathway (map04145)
Since apoptosis is responsible for the removal of infected cells, this means that the dysfunction of the mechanisms is involved in many pathological conditions (Papaliagkas et al., 2007). The p53 protein is a transcription factor that plays a key role in the regulation of apoptosis, cell cycle, cellular stress response, and genomic stability (Wang et al., 2023).
Cell imaging and microscopy
Fluorescence
This is termed direct phagolysosome fusion and is known to allow rapid delivery of captured cargo to the lysosome for further degradation (Greene et al., 2022). Fusion of the ER with the macrophage membrane has been found to act as a special form of phagocytosis based on the cooperation of ER-associated proteins (Gagnon et al., 2002).
Deconvolution microscopy and three-dimensional imaging
Fluorescence-activated Cell Sorting
Proteomic studies
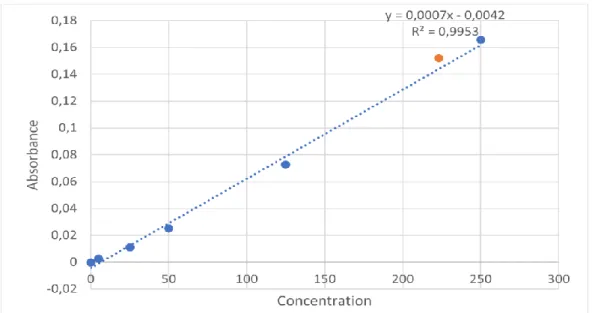
BCA protein assay
The color intensity of the reaction will be proportional to the amount of protein in the sample, and thus can be quantified by comparing the absorbance of the sample to a standard curve of known protein concentrations.
Label-free Quantification
Traditionally, the label-free approaches are divided into either spectral counting methods or peptide peak intensity-based proteomics (Arike & Peil, 2014). Label-free quantification allows for an unlimited number of samples and can be applied to any type of sample.
Transcriptomic studies
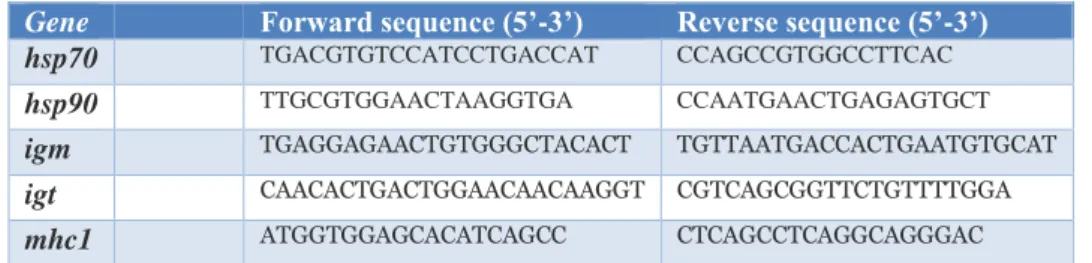
- RNA extraction/isolation
- cDNA synthesis
- Impact of NP on immune-related genes
- Real-time PCR
However, several of these proteins also play important roles in the immune defense system of fish (Xie et al., 2015). Traditionally, the production of immunoglobulin has been limited to B cells of the immune system (Chen et al., 2009).
Inspiration
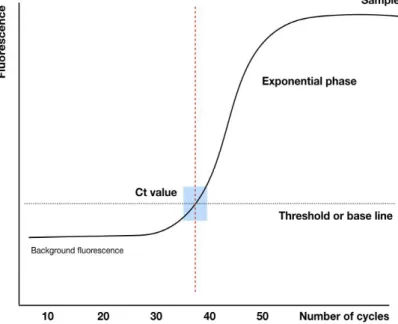
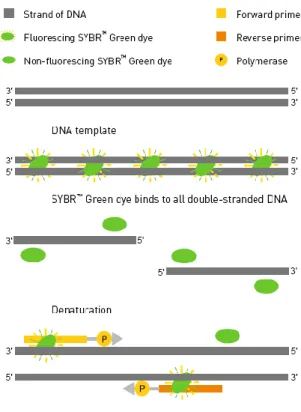
The Lightcycler® real-time PCR system calculates Cp values for samples in an experiment and generates a curve for each sample and standard. This equation calculates the relative expression ratio of a specific gene compared to a known reference gene and is based on PCR efficiency and Cp values.
Scientific aim
Biological material
Chemicals, kits
Media, buffers, solutions
Experimental description
Growing cell cultures
Exposure of fish cells to plastic particles
For the automated cell counter, 10 µl of the aliquoted cell culture was mixed with 10 µl of Tryphan blue. Then 10 µl of this mixture was added to each side of the cell counter slide and the slide was inserted into the cell counter.
Microscopy of cells
DeltaVision SoftWoRx™ (GE & Healthcare, 2014) was used to deconvolve the images, and Fiji was then used to perform image analysis.
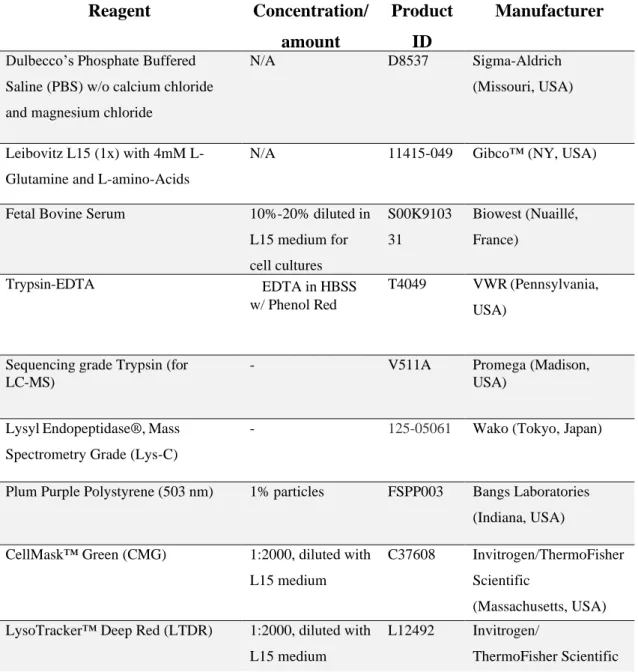
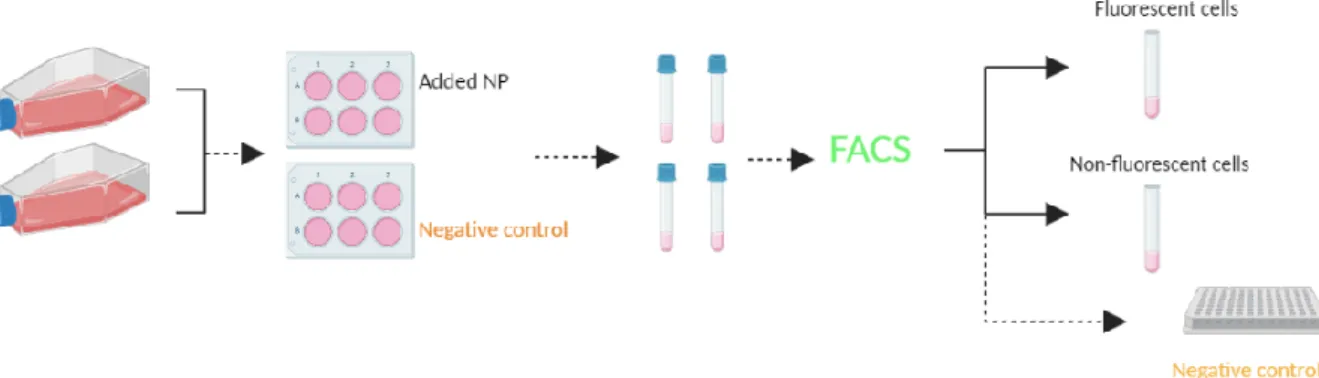
Flow cytometry: enrichment of fluorescent cells
As previously described, cells exposed to plastic were first sorted into two separate tubes and then plated into 96-well plates as described above. All surrounding wells in 96-well plates were filled with PBS, which prevented them from drying out.
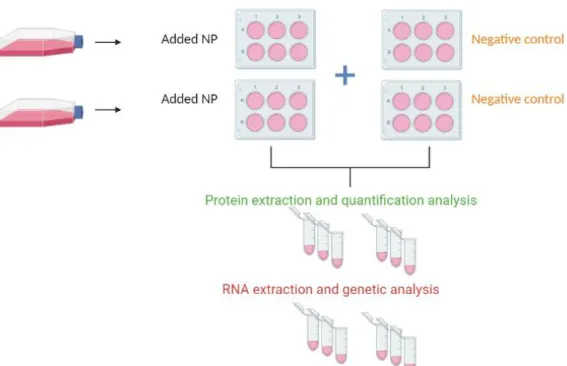
Label free proteomic analysis of NP-exposed vs. non-exposed ASK-1 cells
- Sample preparation and Mass spectrometry
- Protein pathway and network analysis
- Transcriptomics of NP-exposed and non-exposed ASK-1 cells
- cDNA synthesis
- Real-time qPCR
- Gene expression analysis
From the previously synthesized cDNA, a concentration of 2.5 ng/µl was made for each of the samples used in PCR. The master mix was vortexed before 15 µl was added to the wells of the 96-well PCR plate. Samples and standards were then vortexed before 5 µl of these were added to the master mix in the wells.
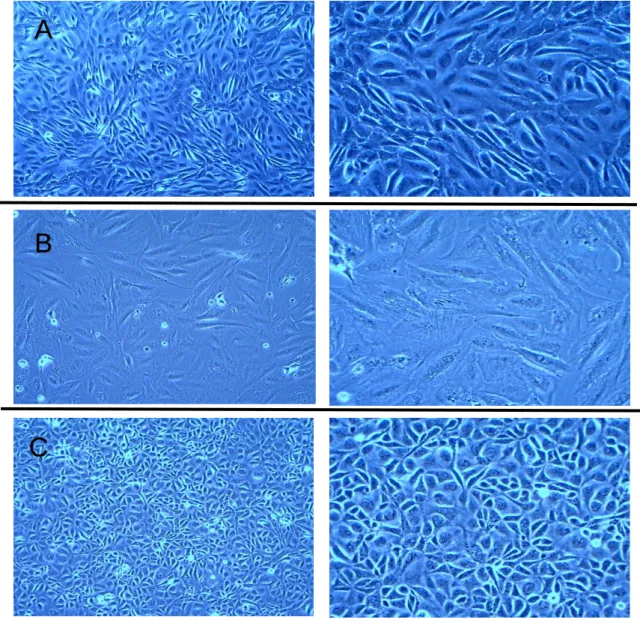
Cell culture
The growth characteristics of SHK-1 cells were found to be comparable to those of ASK-1 cells; however, culturing SHK-1 cells required some initial adjustments due to some distinct characteristics. In particular, SHK-1 cells showed a higher degree of sensitivity and a faster response to trypsin treatment during passage of cell cultures compared to ASK-1 cells.
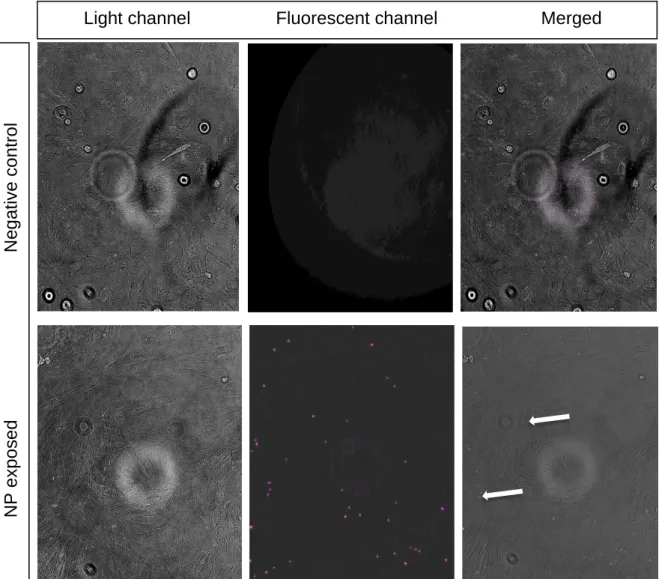
Uptake of fluorescent polystyrene particles in fish cells
Fluorescent microscopy
Although it was clear that some of the particles were in close proximity to some of the cells, it was still difficult to determine whether the particles were stuck to the cell surface or actually ingested it. The circle in the center of the light channel images is a microscope shadow and is not part of the cell cultures. However, significant changes were observed in the later stages of the exposure experiment when the procedure was repeated several times.
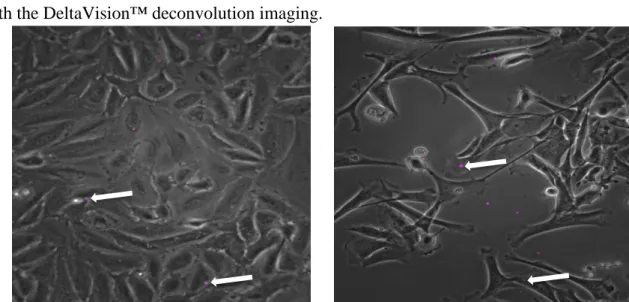
DeltaVision™ Imaging of polystyrene particles colocalized with lysosomes
Lysosomes are stained with LysoTracker™ Deep Red (LTDR) and modified to appear as magenta. Altogether, the results for all three cell lines show NPs binding to lysosomes, indicating that the particles have been ingested. The 3D view of cells shows particles in contact with lysosomes, which would support the assumption that NPs are transported to/in lysosomes.
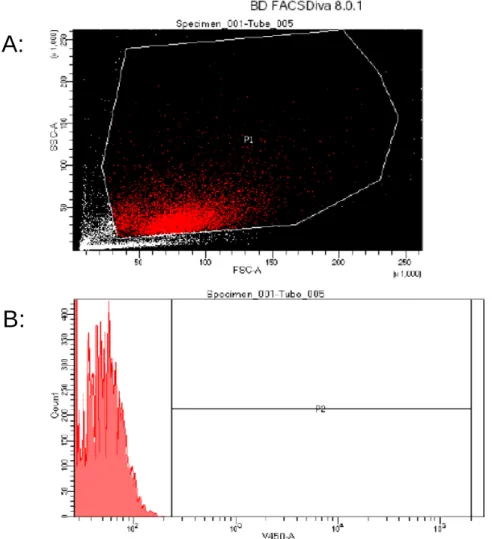
Enrichment of fluorescent cells
As such, a greater number of non-fluorescent cells were brought to the wells of the 96-well plates. The percentage of total fluorescent cells is calculated from the number of fluorescent cells divided by the total number of sorted cells. A total of 1000 fluorescent cells were sorted and cultured in a single well on a 96-well plate.
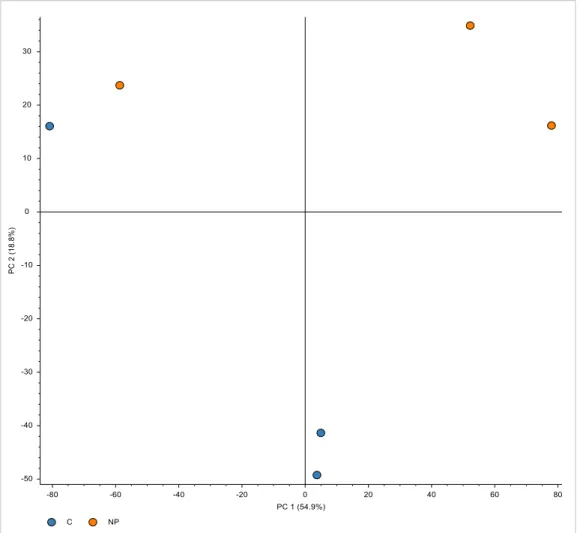
Differential protein expression of NP-exposed cells
Nevertheless, one could ignore these outliers because the placement of the other points on the graph could identify a difference between the two variables. A number of the proteins that are part of the apoptosis pathway (map 04210) (Figure 31) were differentially expressed in the ASK-1 samples (Table 11). A selection of proteins involved in the p53 signaling pathway (map04115) (Figure 32) were differentially expressed in the ASK-1 cells exposed to NPs (Table 12).
Differential gene expression of NP-exposed cells
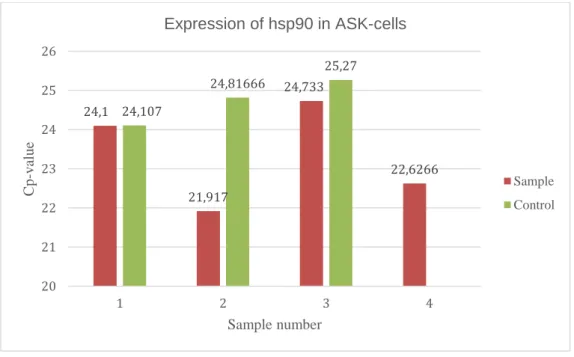
The relative expression of hsp90 was calculated from a standard curve generated for each of the qPCR runs (Appendix – C. From the PCR efficiency, the slope of the standard curve and the difference in cp values between control and sample, it was possible to calculate a relative expression value for four samples of hsp90 (Appendix – C. All samples gave positive relative expression values, which means that the expression of hsp90 was higher in all NP-exposed samples compared to the controls.
Microscopy and imaging of NP exposed Salmonid cells
It is known that some NPs can induce lysosomal dysfunction, and that lysosomal alkalinization as a response to the dysfunction is part of a bidirectional interaction with ROS production (Li et al., 2008; Stern et al., 2012) . The antioxidant and detoxifying defense to prevent excessive production of ROS is a complex network, but a variation in level of antioxidant enzyme activities has been proposed as biomarkers of water contamination (Solomando et al., 2020). The expression of the enzyme proteins CATA and SOD have been used as reference proteins to detect MP-induced oxidative stress and toxicological consequences, which in turn can lead to inflammation and cell death (Ding et al., 2018; Kim et al., 2021).
Flow cytometry supports the assertion of polystyrene internalization
There was an element of uncertainty associated with the behavior of cells after particle ingestion and sorting of ingested particles and whether it would be possible to perform proteomic analysis on sorted cells. This may be attributed to the relatively small number of well-sorted cells or to cell sorting stress. As this study can be considered novel in many aspects, there is some knowledge about the fate of cells after exposure to NPs.
Differential expression of proteins revealed intracellular response to NP exposure . 71
In addition, the overall change in the expression of a series of proteins related to oxidative stress and immune response of NP-exposed ASK-1 cells strongly indicated that NPs induced stress in the cells, leading to a cascade of tightly regulated intracellular responses. However, any disruption in the expression of such proteins would imply that the network of proteins involved in oxidative stress responses and thus cellular homeostasis is affected. Taken together, the perturbations of oxidative stress response proteins strongly suggest that NPs induced oxidative stress in ASK-1 cells.
Limitations and future perspectives
Expression profiling and validation of candidate reference genes in immune-relevant tissues and cells of Atlantic salmon (Salmo salar L.). Expression of MHC class I pathway genes in response to infectious salmon anemia virus in Atlantic salmon (Salmo salar L.) cells. Interaction of nano- and microparticles with cornea-like cells and epidermal keratocytes of Atlantic salmon (Salmo salar L.): High-resolution imaging using holotomographic microscopy UiT: Arctic University of Norway].
Atlantic salmon (Salmo salar L.) epidermal Malpighian cells—motile cells that clear latex beads in vitro. A0A1S3RLW4 Lysine-specific bifunctional demethylase and histidyl-hydroxylase OS=Salmo salar OX=8030 GN=mina PE=3 SV=1.