Annex 1.
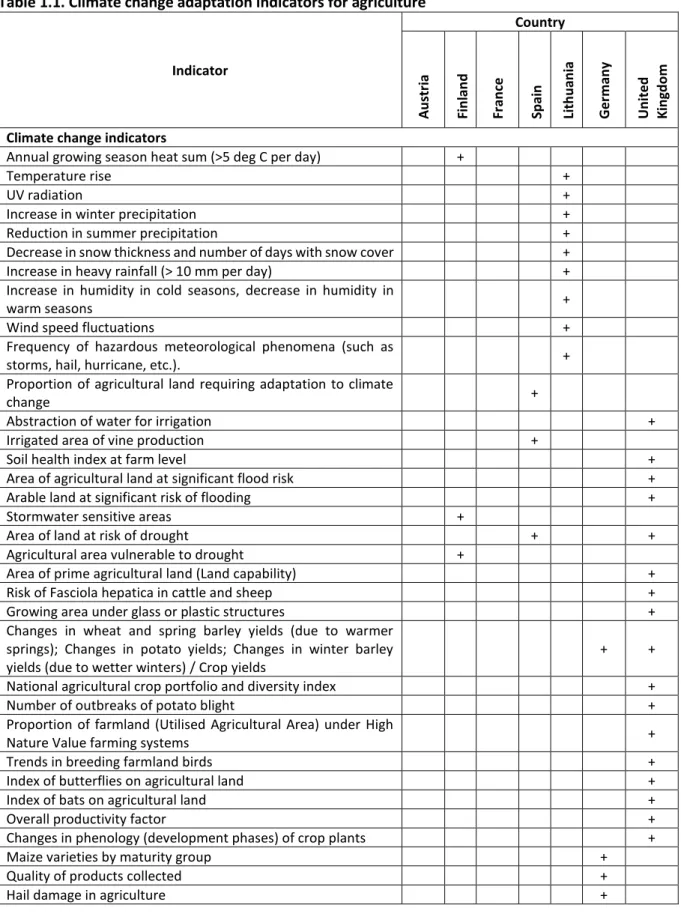
Tables 1.1 - 1.11 present the results of the review of climate change adaptation indicators for each sector respectively. Indicators marked as typical climate change indicators in the tables were excluded from further analysis.
Table 1.1. Climate change adaptation indicators for agriculture
Indicator
Country
Austria Finland France Spain Lithuania Germany United Kingdom
Climate change indicators
Annual growing season heat sum (>5 deg C per day) +
Temperature rise +
UV radiation +
Increase in winter precipitation +
Reduction in summer precipitation +
Decrease in snow thickness and number of days with snow cover +
Increase in heavy rainfall (> 10 mm per day) +
Increase in humidity in cold seasons, decrease in humidity in
warm seasons +
Wind speed fluctuations +
Frequency of hazardous meteorological phenomena (such as
storms, hail, hurricane, etc.). +
Proportion of agricultural land requiring adaptation to climate
change +
Abstraction of water for irrigation +
Irrigated area of vine production +
Soil health index at farm level +
Area of agricultural land at significant flood risk +
Arable land at significant risk of flooding +
Stormwater sensitive areas +
Area of land at risk of drought + +
Agricultural area vulnerable to drought +
Area of prime agricultural land (Land capability) +
Risk of Fasciola hepatica in cattle and sheep +
Growing area under glass or plastic structures +
Changes in wheat and spring barley yields (due to warmer springs); Changes in potato yields; Changes in winter barley yields (due to wetter winters) / Crop yields
+ +
National agricultural crop portfolio and diversity index +
Number of outbreaks of potato blight +
Proportion of farmland (Utilised Agricultural Area) under High
Nature Value farming systems +
Trends in breeding farmland birds +
Index of butterflies on agricultural land +
Index of bats on agricultural land +
Overall productivity factor +
Changes in phenology (development phases) of crop plants +
Maize varieties by maturity group +
Quality of products collected +
Hail damage in agriculture +
Austr Finlan France Spain Lithuan Germ Unite Kingd
Pest invasion + +
Organic matter content of soils +
Losses in agriculture due to animal and plant pathogens
(development of pathogens due to improved living conditions) +
Seed diversity +
Vulnerability and resilience of agricultural, horticultural and
forestry land to climate change +
Introduction of new crops and varieties, e.g. spring wheat, expansion of winter wheat, oilseed rape, -beans into new or currently unproductive areas
+
Occurrence of aphids +
Increased population migration due to agricultural disruption +
Residents in flood-prone areas +
Residents in drought-prone areas +
Residents of coastal risk areas (due to storms and cyclones) +
Residents of food insecure areas +
Change in soil structure and soil nutrient retention capacity as a result of climate change and increased precipitation (indicators:
soil organic matter, soil carbon stock, winter vegetation cover, drainage of arable and horticultural areas, nitrogen and phosphorus emissions to water, change in nutrient balance on arable land)
+
Proportion of protected habitats in agricultural areas +
Area under agri-environmental schemes + +
Organic land and organic farms +
Agricultural production methods which reduce erosion risk (Proportion of arable land cultivated with reduced/zero tillage;
with soil cover maintained)
+
Abstraction of water for irrigation + + + +
Use of climate adapted crops + +
Area of insured agricultural land +
Adaptation of management processes +
Adaptation of the spectrum of varieties +
Use of plant protection products +
Inputs for agriculture and forestry (inputs include seeds,
fertilisers, pesticides, machinery) +
Changes in farming practices +
Area under targeted agri-environmental schemes/ Proportion of farmland (Utilised Agricultural Area) under High Nature Value farming systems
+ +
Citizens' willingness to insure crops +
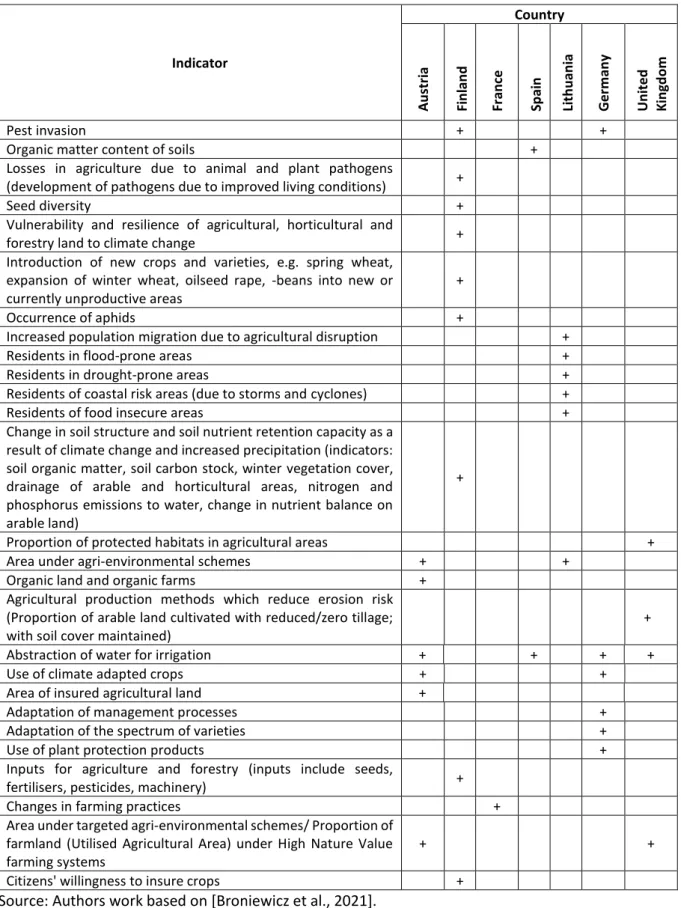
Source: Authors work based on [Broniewicz et al., 2021].
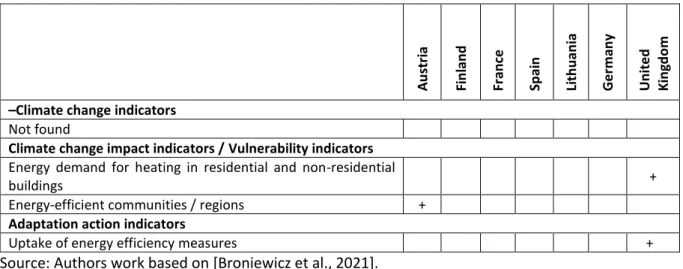
Table 1.2. Climate change adaptation indicators for energy efficiency
Indicator Country
Austria Finland France Spain Lithuania Germany United Kingdom –Climate change indicators
Not found
Climate change impact indicators / Vulnerability indicators Energy demand for heating in residential and non-residential
buildings +
Energy-efficient communities / regions +
Adaptation action indicators
Uptake of energy efficiency measures +
Source: Authors work based on [Broniewicz et al., 2021].
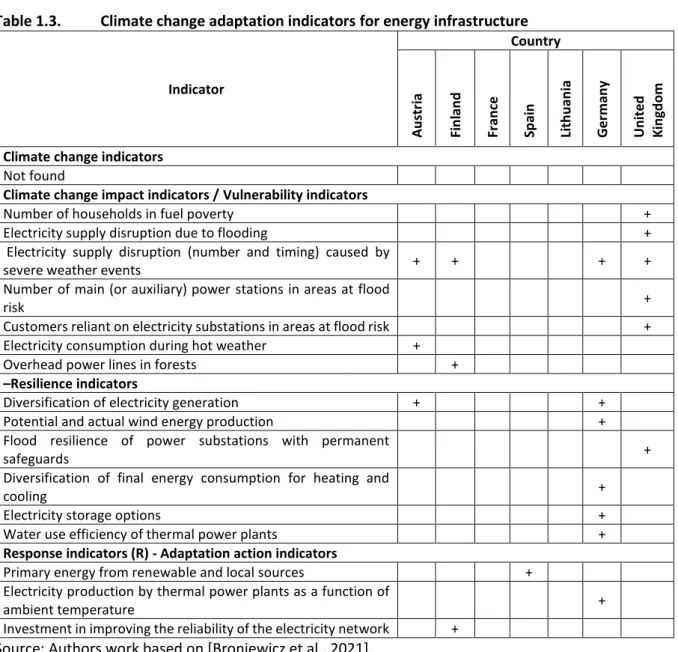
Table 1.3. Climate change adaptation indicators for energy infrastructure
Indicator
Country
Austria Finland France Spain Lithuania Germany United Kingdom
Climate change indicators Not found
Climate change impact indicators / Vulnerability indicators
Number of households in fuel poverty +
Electricity supply disruption due to flooding +
Electricity supply disruption (number and timing) caused by
severe weather events + + + +
Number of main (or auxiliary) power stations in areas at flood
risk +
Customers reliant on electricity substations in areas at flood risk +
Electricity consumption during hot weather +
Overhead power lines in forests +
–Resilience indicators
Diversification of electricity generation + +
Potential and actual wind energy production +
Flood resilience of power substations with permanent
safeguards +
Diversification of final energy consumption for heating and
cooling +
Electricity storage options +
Water use efficiency of thermal power plants +
Response indicators (R) - Adaptation action indicators
Primary energy from renewable and local sources +
Electricity production by thermal power plants as a function of
ambient temperature +
Investment in improving the reliability of the electricity network +
Source: Authors work based on [Broniewicz et al., 2021].
Table 1.4. Climate change adaptation indicators for construction, spatial planning and housing
Austr Finlan France Spain Lithuan Germ Unite Kingd Climate change indicators
Not found
Climate change impact indicators / Vulnerability indicators
Share of paved areas in the permanent settlement area +
Area and average intensity of urban heat islands +
Retention areas +
Proportion of buildings in disrepair due to climate change +
Dampness & condensation in housing stock +
Property at risk of flooding + +
Use of settlements in flood risk areas +
Settlement and transport areas at risk of flooding +
Number of households/people falling below the SHQS &
Tolerable Standard +
Proportion of residential and non-residential buildings in each
energy efficiency class +
–Resilience indicators
Number of properties protected from coastal erosion +
Proportion of green areas in the urban environment + +
Areas reserved for nature and landscape conservation +
Areas reserved for groundwater protection and drinking water
abstraction +
Areas reserved for flood protection purposes +
Areas reserved for special climate functions +
Adaptation action indicators
Net change in urban green space and blue zones + +
Number/area of green roofs installed in urban areas +
Surface area of permeable paving applied to properties + +
New housing supply +
Affordable housing supply +
People displaced due to climatic events +
Proportion of newly built facilities equipped with systems to
prevent the effects of heat waves +
Integrating climate change adaptation into the legal framework
conditions +
Consideration of gravitational natural hazards in land use
planning regulations +
Inclusion of climate change adaptation criteria in building
support programmes +
Construction and renovation of public buildings including
aspects relevant to adaptation +
Number of projects for infrastructure, residential and non- residential premises taking into account changes in meteorological conditions as a result of climate change and impact on human health
+ Sustainability and green infrastructure planning of settlements,
urban areas and spaces, ecosystem services assessment, nature conservation and resilience
+ Number of spatial planning documents addressing climate
change adaptation issues + +
Indicator
Country
Austria Finland France Spain Lithuania Germany United Kingdom
Availability of an up-to-date assessment of the territory's vulnerability (at municipal level) to the effects of climate change, Inclusion of measures to manage risks and hazards caused by climate change in municipal action plans
+ Number of municipal climate change adaptation plans
developed +
Cities with more than 20,000 inhabitants / municipalities that
have developed urban greening plans +
Loss ratio and loss-cost ratio for comprehensive homeowners'
life insurance +
Weather-related business insurance claims + +
Proportion of residential buildings covered by extended
insurance against natural hazards +
Average compensation per claim for extraordinary (weather)
risks +
Citizens' willingness to insure property +
Source: Authors work based on [Broniewicz et al., 2021].
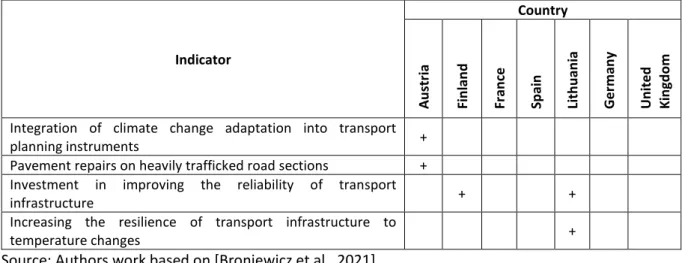
Table 1.5. Climate change adaptation indicators for transport
Indicator
Country
Austria Finland France Spain Lithuania Germany United Kingdom
Climate change indicators Not found
Climate change impact indicators / Vulnerability indicators
Road network at risk of flooding +
Rail network at risk of flooding +
Disruption risk to railway services as a result of flooding +
Failure of communication networks due to power cuts +
Risk of traffic disruption as a result of flooding +
Road and rail bridges vulnerable to scour +
Damage to transport infrastructure due to extreme events +
Landslide events affecting the road network +
Navigability of inland waterways +
Weather-related road accidents +
Reliability of the transport network (disruptions to the
communication network caused by "messy" roads and flooding) + Adaptation action indicators
Rail network benefiting from flood protection +
Road network benefiting from flood protection +
Increasing the share of walking, cycling and public transport
(excluding taxis) +
Austr Finlan France Spain Lithuan Germ Unite Kingd Integration of climate change adaptation into transport
planning instruments +
Pavement repairs on heavily trafficked road sections + Investment in improving the reliability of transport
infrastructure + +
Increasing the resilience of transport infrastructure to
temperature changes +
Source: Authors work based on [Broniewicz et al., 2021].
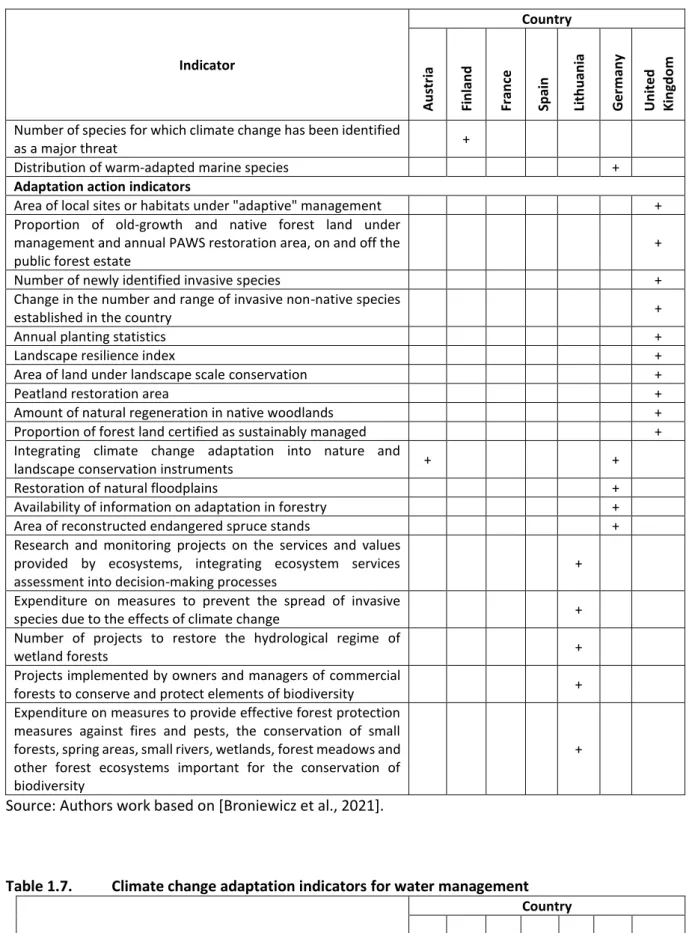
Table 1.6. Climate change adaptation indicators for nature and biodiversity conservation
Indicator
Country
Austria Finland France Spain Lithuania Germany United Kingdom
Climate change indicators
Number and area of reported wildfires in forests and key
habitats + +
Development of tropical and subtropical species +
Forest fires +
Climate change impact indicators
Proportion of notified habitats and species in ‘positive’ condition +
Protected areas at national and international level + + +
Farmland bird population +
Abundance and productivity of breeding seabirds +
Abundance of wintering water birds +
Natural Capital Asset Index +
Abundance/frequency of specialist and generalist species:
butterflies +
Proportion of notified habitats and species in ‘positive’ condition + Condition of key habitats: Proportion of notified habitats in
unfavourable condition +
Number of reported freshwater habitat features with invasive
non-native species +
Abundance/frequency of specialist and generalist species:
snow-bed species +
Extent of key semi-natural habitats: 1) terrestrial, 2) coastal, 3)
deep peat +
Proportion and area of pine woodland exposed to Dothistroma
needle blight (DNB) +
Forest bird species index +
Forest butterfly species index +
Indicator
Country
Austria Finland France Spain Lithuania Germany United Kingdom
Indicator of breeding wetland birds +
Bird distribution and wintering grounds +
Status and trends of selected climate-sensitive species and
habitat types +
Changes in the flora on Alpine summits +
Projects and measures that contribute to improving water
ecology +
Ecological and chemical status of surface waters + Phenological changes (in developmental stages) in wild plant
species +
Temperature index in the bird species community +
Species composition of trees +
Viability of forest stands + +
Soil condition +
Tree species composition in natural forest reserves +
Threatened spruce stands +
Increment of timber +
Damaged wood +
Wood damage and extent of expansion caused by the wood bark
beetle + +
Occurrence of the pine weevil +
Threats from the oak bark beetle +
Fire hazard of forest areas +
Area affected by major forest fires +
State of the forests +
Mixed stands +
Conservation of forest genetic resources +
Humus resources in forest soils +
Occurrence of heat-adapted species in inland waters +
Outbreaks of West Nile fever in equids +
Endangered wild species +
Invasive alien species +
Proportion of ancient woodlands with declining overall
suitability for lichen epiphytes +
Proportion of coniferous woodland on the National Forest
Estate with a high/medium-high risk of wind throw +
Proportion of Natura 2000 sites where climate change is a
pressure factor +
Dangerous, new and easily spreading animal diseases and pests + Losses in forestry due to plant and animal pathogens
(development of pathogens due to improved living conditions) + Municipalities where the presence or establishment of the
mosquito Aedes albopictus has been detected +
Increase in the proportion of deciduous trees in mixed forests + Extent of storm damage and forest owners' efforts to deal with
damage +
Climate severity index +
Number of moths and occurrence of multi-generational species +
Austr Finlan Fran Spain Lithu Germ Unite Kingd Number of species for which climate change has been identified
as a major threat +
Distribution of warm-adapted marine species +
Adaptation action indicators
Area of local sites or habitats under "adaptive" management +
Proportion of old-growth and native forest land under management and annual PAWS restoration area, on and off the public forest estate
+
Number of newly identified invasive species +
Change in the number and range of invasive non-native species
established in the country +
Annual planting statistics +
Landscape resilience index +
Area of land under landscape scale conservation +
Peatland restoration area +
Amount of natural regeneration in native woodlands +
Proportion of forest land certified as sustainably managed +
Integrating climate change adaptation into nature and
landscape conservation instruments + +
Restoration of natural floodplains +
Availability of information on adaptation in forestry +
Area of reconstructed endangered spruce stands +
Research and monitoring projects on the services and values provided by ecosystems, integrating ecosystem services assessment into decision-making processes
+ Expenditure on measures to prevent the spread of invasive
species due to the effects of climate change +
Number of projects to restore the hydrological regime of
wetland forests +
Projects implemented by owners and managers of commercial
forests to conserve and protect elements of biodiversity +
Expenditure on measures to provide effective forest protection measures against fires and pests, the conservation of small forests, spring areas, small rivers, wetlands, forest meadows and other forest ecosystems important for the conservation of biodiversity
+
Source: Authors work based on [Broniewicz et al., 2021].
Table 1.7. Climate change adaptation indicators for water management
Indicator
Country
Austria Finland France Spain Lithuania Germany United Kingdom
Climate change indicators
Water leakage and losses (quantity) +
Indicator
Country
Austria Finland France Spain Lithuania Germany United Kingdom
Domestic and non-domestic water usage + + +
Quantitative groundwater status +
Meteorological drought - number of standard deviations of
cumulative waste in a given period with respect to the average +
Drought index in metropolitan areas +
Water and food contamination (contamination with biotoxins
and pathogens) +
Average ocean levels measured by satellite altimetry + Dangerous extreme hydrological phenomena (floods, storms,
droughts, intense rainfall, etc.). +
Climate change impact indicators / Vulnerability indicators Occurrences of low summer flow in rivers Summer low flow
events in rivers (Normalised Flow Index) +
Average flow in rivers +
Status and distribution of climate-sensitive species:
abundance of Arctic charr (Arctic char) in freshwater lakes +
Number of reported freshwater habitat features with invasive
non-native species +
Changes in average sea surface temperature + + +
Number of harmful algal blooms (HABs) + +
Groundwater quantity and quality +
Retention areas +
Ecological and chemical status of surface waters + +
State of water resources +
Number/frequency of floods + +
Flooding outside risk areas +
Water outflow +
Standing water temperature +
Duration of thermal stratification (thermal layer system) in still
waters +
Sea level +
Storm tide intensity +
Episodes related to the occurrence/elimination of
microcystins in drinking water +
Outbreaks of water-borne diseases associated with droughts
and floods +
Number of situations of prolonged drought +
Number of residents in flood risk areas +
Population at risk within the floodplain +
Reliability of raw water supply in water utilities, especially in
emergency situations +
Reliability of the waste water disposal system +
Sea salinity +
Increased population migration due to flooding +
Residents of areas with limited access to water +
Adaptation action indicators
Projects and measures contributing to water quality
improvement +
Number of freshwater monitoring stations +
Austr Finlan France Spain Lithu Germ Unite Kingd Progress towards achieving the environmental objectives of
the river basin management plans +
Number of local flood strategies +
Number of staff assigned to local flood risk management +
Investment in coastal protection +
Compensation paid by insurance companies for floods (rain
floods, storm floods) +
Investment in improving the reliability of water supply +
Flood protection measures for all residents in flood-risk areas + Level of implementation of flood risk management
programmes +
Improving the management of surface water, groundwater
and the Baltic Sea and ensuring good water quality +
Upgrading surface (rainwater) wastewater management infrastructure and ensuring its development in urban areas to protect urban areas from excess water and prevent the release of pollutants into the environment
+ Reduction of the negative impact of rising water levels and
natural and catastrophic hydro-meteorological phenomena on the Baltic Sea coastal zone through natural coastal management measures
+ Implementation of the flood risk management plan +
Source: Authors work based on [Broniewicz et al., 2021].
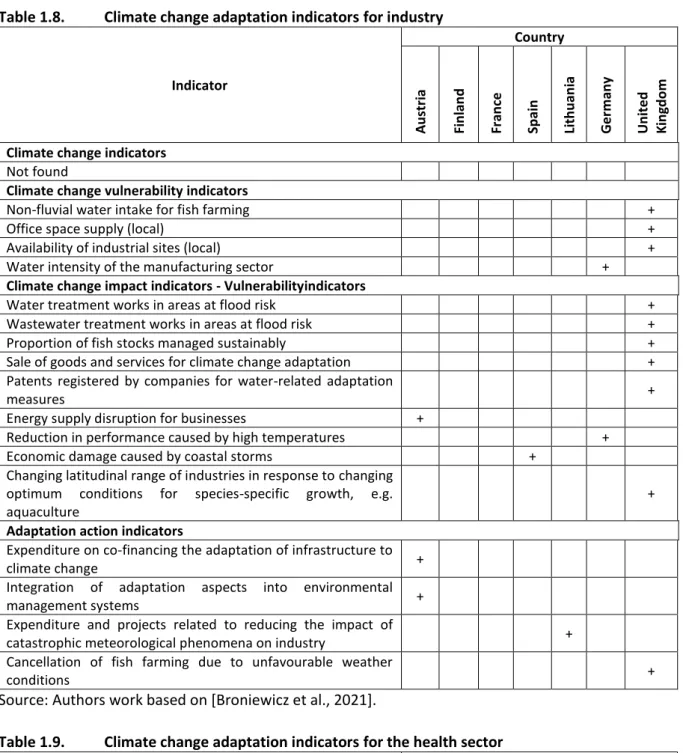
Table 1.8. Climate change adaptation indicators for industry
Indicator
Country
Austria Finland France Spain Lithuania Germany United Kingdom
Climate change indicators Not found
Climate change vulnerability indicators
Non-fluvial water intake for fish farming +
Office space supply (local) +
Availability of industrial sites (local) +
Water intensity of the manufacturing sector +
Climate change impact indicators - Vulnerabilityindicators
Water treatment works in areas at flood risk +
Wastewater treatment works in areas at flood risk +
Proportion of fish stocks managed sustainably +
Sale of goods and services for climate change adaptation +
Patents registered by companies for water-related adaptation
measures +
Energy supply disruption for businesses +
Reduction in performance caused by high temperatures +
Economic damage caused by coastal storms +
Changing latitudinal range of industries in response to changing optimum conditions for species-specific growth, e.g.
aquaculture
+ Adaptation action indicators
Expenditure on co-financing the adaptation of infrastructure to
climate change +
Integration of adaptation aspects into environmental
management systems +
Expenditure and projects related to reducing the impact of
catastrophic meteorological phenomena on industry +
Cancellation of fish farming due to unfavourable weather
conditions +
Source: Authors work based on [Broniewicz et al., 2021].
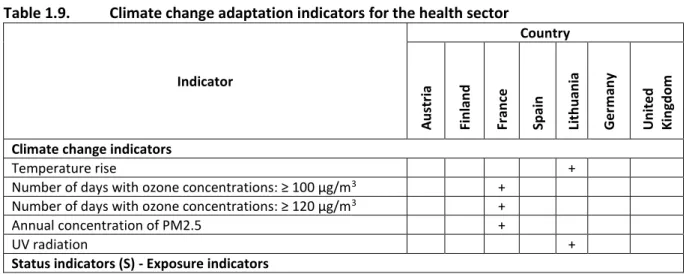
Table 1.9. Climate change adaptation indicators for the health sector
Indicator
Country
Austria Finland France Spain Lithuania Germany United Kingdom
Climate change indicators
Temperature rise +
Number of days with ozone concentrations: ≥ 100 μg/m3 + Number of days with ozone concentrations: ≥ 120 μg/m3 +
Annual concentration of PM2.5 +
UV radiation +
Status indicators (S) - Exposure indicators
Austr Finlan France Spain Lithuan Germ Unite Kingd Proportion of the population directly or indirectly exposed to
risks related to climate change: avalanches, cyclones, storms, forest fires, floods, etc.
+ Population exposed to the effects of a changing climate (taking
into account the vulnerability of age groups and the number of hot and cold days)
+ + +
Number of temperature exceedances above warning thresholds
(severity) +
Concentration of potentially allergenic pollen in the air +
Length of pollen season (including birch, walnut, hay, willow,
alder) + + +
Atmospheric concentrations of allergenic fungal spores + +
Climate change impact indicators
Allergic diseases: dermatitis, eye inflammation, skin
sensitivity/irritation + +
Diseases caused by blood-sucking insects: malaria, dengue fever, yellow fever, West Nile fever, West Valley fever, tularemia, Chikungunia virus, syndicate virus, Tahyna virus
+ Diseases caused by other insects: visceral and cutaneous
leishmaniasis, chandipura virus, Sicilian virus, tularemia, Tuscan virus, Neapolitan virus
+ Tick-borne diseases: Lyme disease, tick-borne encephalitis,
ehrlichiosis, Mediterranean spotted fever, Crimean-Congo haemorrhagic fever, tularemia
+ + +
Diseases caused by protozoa: visceral leishmaniasis;
schistosomiasis +
Rodent-borne diseases: leptospirosis, Hanta virus, haemorrhagic fever (with HFRS syndrome), plague, vasculitis and meningitis virus, smallpox virus, Lhasa virus
+
Autochthonous cases of dengue +
Indigenous cases of Chikungunya virus disease +
Cases of Mediterranean rash fever (exothermic) +
Impact of floods on mental health +
Indigenous cases of malaria +
Indigenous cases of West Nile virus +
Pathogen carriers +
Blue algae contamination in bathing waters +
Emergency room visits for hyperthermia/heatstroke +
Hospital admission due to effects of hot weather +
Emergency hospital admissions for chronic obstructive
pulmonary disease +
Emergency hospital admissions for allergic asthma +
Water-borne epidemics and heat wave caused by climate change (number of food poisoning outbreaks by pathogen, e.g.
salmonella, Campylobacter)
+ Morbidity and mortality from cardiovascular and respiratory
diseases, kidney disease, diabetes, mental illness and behavioural disorders
+
Food- and water-borne diseases +
Indicator
Country
Austria Finland France Spain Lithuania Germany United Kingdom
Heat shock injury, starvation, exhaustion, death +
Skin cancer, cataracts of the eye +
Diseases of the stomach, digestive system, liver disease, kidney
disease diabetes, mental and behavioural disorders +
Diseases caused by parasites: fascioliosis, gardenia. Diseases caused by viruses and bacteria: hepatitis A, E, diarrhoea, cholera, legionellosis, typhoid fever, shigellosis, campylobacteriosis, E. coli rotovirus, salmonellosis, botulism, cryptosporidiosis, yersiniosis
+
Oncological diseases +
Patients with tuberculosis, exhausted by starvation, patients with infectious diseases, patients with chronic diseases, patients with mental or physical disabilities
+ Health disorders caused by insufficient water and deteriorating
water quality +
Changes in public health as a result of forest fires +
Health disorders related to hunger, malnutrition and important
trace element loss +
Increased health risks during rest +
Anxiety and depression over economic losses due to drought + Increased mortality due to lack of food, heat, suicide, outbreaks
of violence +
Summer mortality due to high temperatures +
Winter mortality due to low temperatures +
Mortality from exposure to excessive natural cold +
Number of rescues per year due to natural phenomena + Mortality due to high ozone concentrations (2 groups: ≥ 100
μg/m3, ≥ 120 μg/m3) +
Mortality due to PM2.5 concentrations ≥ 10 μg/m3 + Excess of observed overall mortality over expected mortality +
Mortality rate from respiratory causes +
Cardiovascular mortality rate +
Fatalities from forest fires, floods and coastal storms + Average duration of rescue operations due to natural
phenomena and total duration of +
Adaptation action indicators
% of clinical areas covered by thermal monitoring +
% of health care providers reporting adaptation to change in
annual reports +
Number of overheating risk assessments carried out in clinical areas of NHS trust (required when temperature exceeds 26 degrees C)
+
Monitoring and early warning systems + +
High temperature warning service + +
Heat warning system activity +
Pollen information +
Activity of the coastal warning system +
Improve public information on climate change and the risks it
poses to human health +
Austr Finlan France Spain Lithuan Germ Unite Kingd Pollen monitoring and forecasting, ticks, phenological
observations and indicators relevant to determining the impact of climate change on human health
+ Increase in the number of nursing staff in the region +
Increase in the length of cycle ways and number of cycle parking
facilities +
Prevention of diseases that can arise and spread as a result of
climate change +
Source: Authors work based on [Broniewicz et al., 2021].
Table 1.10. Climate change adaptation indicators for tourism
Indicator
Country
Austria Finland France Spain Lithuania Germany United Kingdom
Climate change indicators
Snow cover for winter sports +
Climate change impact indicators / vulnerability indicators
Seasonal schedule of accommodation +
Accommodation in a coastal tourist area +
Seasonal accommodation in German tourist regions +
Seasonal concentration of tourist traffic +
Accommodation in winter sports centres +
Preferences for places of rest +
Cultural heritage in flood risk areas +
Ecotourism +
Bathing temperatures at the coast +
Heat stress in climatic spas +
Episodes related to the occurrence/elimination of microcystins
and/or cyanobacteria in bath water +
Adaptation action indicators
Integration of climate change adaptation into the tourism
concept/strategy +
Mainstreaming climate change adaptation into tourism
subsidies +
Source: Authors work based on [Broniewicz et al., 2021].
Table 1.11. Climate change adaptation indicators for risk management
Indicator
Country
Austria Finland France Spain Lithuania Germany United Kingdom
Climate change indicators No
Indicator
Country
Austria Finland France Spain Lithuania Germany United Kingdom
Climate change impact indicators / Vulnerabilityindicators Hours of operation in case of weather and weather-related
damage +
Active disaster relief workers +
Adaptation action indicators
Civil society and local preparedness (local preparedness of people for emergencies - number of people working in regional voluntary civil protection organisations)
+ +
Volunteering to protect against hazards + +
Training to improve the competencies of those involved in
disaster management +
Civil protection exercises +
Integration of climate change adaptation into disaster
protection legislation +
Information on natural hazards +
Information on behaviour in the event of a disaster +
Source: Authors work based on [Broniewicz et al., 2021].
similar one) was identified.
Indicators with the maximum number of points (3 points) in each of the five criteria (except for the prevalence) are marked in green.
Indicators with a lower number of points but considered important for the sector are marked in blue.
Table 2.1. Assessment of climate change adaptation indicators for agriculture
Indicator
Evaluation criteria
Total point
s Prevale
nce
Relevan ce and adequac
y
Suitabil ity
Recogni zability
Meas urabil ity
Reliabili ty Climate change impact indicators / vulnerability indicators
Non-flowing water abstraction for
agricultural purposes 1 3 3 3 3 3 16
Irrigated area of vine production 1 3 1 3 3 3 14
Soil health index at farm level 1 1 3 2 2 2 11
Area of land at risk of drought 2 3 3 3 3 3 17
Agricultural land area 1 1 3 3 3 3 14
Risk of liver fluke (Fasciola hepatica) in cattle
and sheep 1 1 3 2 3 3 13
Growing area under glass or plastic
structures 1 1 3 1 3 1 10
Area of soils at risk of flooding in km2 1 3 3 3 2 3 15
Changes in wheat and spring barley yields (due to warmer springs); Changes in potato yields; Changes in winter barley yields (due to wetter winters) / Crop yields
2 3 3 3 3 3 17
Number of outbreaks of potato blight 1 2 3 3 2 2 13
Changes in the national agricultural crop mix
and diversity index 1 3 3 3 3 3 16
Proportion of agricultural land (utilised agricultural land) within high nature value agricultural systems
1 2 3 1 3 2 12
Arable land at significant risk of flooding 1 3 3 3 2 2 14
Index of farmland bird abundance (Farmland
Bird Index) 1 1 3 2 2 2 11
Index of butterflies on agricultural land 1 1 3 2 2 2 11
Index of bats on agricultural land 1 1 3 2 2 2 11
Overall productivity factor 1 1 3 2 3 2 12
Changes in phenology (development phases)
of crop plants 1 3 3 2 2 2 13
Maize varieties by maturity group 1 3 3 2 2 2 13
Quality of products collected 1 1 2 1 2 2 9
Hail damage in agriculture 1 3 3 3 3 2 15
Pest invasion 2 3 3 3 3 3 17
Organic matter content of soils 1 1 3 2 3 3 13
Stormwater sensitive areas 1 3 3 2 2 2 13
Indicator
Evaluation criteria
Total point
s Prevale
nce
Relevan ce and adequac
y
Suitabil ity
Recogni zability
Meas urabil ity
Reliabili ty Losses in agriculture due to animal and plant
pathogens (development of pathogens due to improved living conditions)
1 3 3 3 3 2 15
Seed diversity 1 2 3 1 2 2 11
Vulnerability and resilience of agricultural, horticultural and forestry land to climate change
1 3 3 1 1 1 10
Introduction of new crops and varieties, e.g.
spring wheat, expansion of winter wheat, oilseed rape, faba bean into new or currently unproductive areas
1 3 3 3 2 3 15
Occurrence of aphids 1 3 3 3 2 2 14
Increased population migration due to
agricultural disruption 1 3 2 2 1 1 10
Residents in flood-prone areas 1 3 3 3 3 2 15
Residents in drought-prone areas 1 3 3 3 3 2 15
Residents of coastal risk areas (due to storms
and cyclones) 1 3 2 3 3 2 14
Residents of food insecure areas 1 2 1 2 2 1 9
Change in soil structure and soil nutrient retention capacity due to climate change and increased precipitation (indicators: soil organic matter, soil carbon stock, winter vegetation cover, drainage of arable and horticultural areas, nitrogen and phosphorus emissions to water, change in nutrient balance on arable land)
1 2 3 2 2 2 12
Proportion of protected habitats in
agricultural areas 2 2 3 2 3 3 15
Area under agri-environmental schemes 2 2 3 1 3 3 14
Organic land and organic farms 1 2 3 2 3 2 13
Adaptation action indicators
Agricultural production methods which reduce erosion risk (proportion of arable land cultivated with reduced/zero tillage;
with soil cover maintained)
1 2 3 1 2 2 11
Abstraction of water for irrigation 4 3 3 3 3 3 19
Use of climate-adapted crops 2 3 3 2 2 2 14
Area of insured agricultural land 1 3 3 3 3 3 16
Adaptation of management processes 1 2 3 1 1 1 9
Adaptation of the spectrum of varieties 1 3 3 2 2 2 13
Use of plant protection products 1 1 3 2 2 2 11
y ity Inputs for agriculture and forestry (inputs
include seeds, fertilisers, pesticides, machinery)
1 1 3 1 3 2 11
Changes in farming practices 1 1 3 1 1 2 9
Area under targeted agri-environmental schemes / / Proportion of farmland (Utilised Agricultural Area) under High Nature Value farming systems
2 2 3 1 3 2 13
Citizens' willingness to insure crops 1 2 3 2 3 2 13
Source: Authors work based on [Broniewicz et al., 2021].
Table 2.2. Assessment of climate change adaptation indicators for energy efficiency
Indicator
Evaluation criteria
Total points Prevalen
ce
Relevan ce and adequac
y
Suitabilit y
Recogni zability
Meas urabil ity
Reliabili ty Response indicators
Use of national funds for energy efficiency
improvements 1 1 3 2 3 2 12
Energy-efficient communities / regions 1 1 3 1 2 1 9
Source: Authors work based on [Broniewicz et al., 2021].
Table 2.3. Assessment of climate change adaptation indicators for energy infrastructure
Indicator
Evaluation criteria
Total point
s Prevalen
ce
Relevance and adequacy
Suitabili ty
Recogniza bility
Meas urabil ity
Reliabil ity Climate change impact indicators
Number of households in fuel poverty 1 1 3 2 3 3 13
Electricity supply disruption due to flooding 1 3 3 3 3 3 16
Electricity supply disruption (number and
timing) caused by severe weather events 4 3 3 3 3 3 19
Number of main (or auxiliary) power stations
in areas at flood drought risk 1 3 3 3 3 3 16
Customers reliant on electricity substations
in areas at flood risk 1 3 3 3 3 3 16
Electricity consumption during hot weather 1 3 3 3 3 2 15
Overhead power lines in forests 1 2 3 3 3 3 15
–Resilience indicators
Diversification of electricity generation 2 3 3 2 3 3 16
Potential and actual wind energy production 1 3 3 3 3 2 15
Flood resilience of power substations with
permanent safeguards 1 3 3 2 2 2 13
Diversification of final energy consumption
for heating and cooling 1 3 3 2 2 2 13
Electricity storage options 1 3 3 3 3 3 16
Water use efficiency in thermal power plants 1 1 3 1 2 2 10
Adaptation action indicators
Primary energy from renewable and local
sources 1 3 3 3 3 3 16
Electricity production by thermal power
plants as a function of ambient temperature 1 3 3 2 3 2 14
Investment in improving the reliability of the
electricity network 1 1 3 3 3 3 14
Source: Authors work based on [Broniewicz et al., 2021].
Indicator Total points Prevalen
ce
Relevance and adequacy
Suitabili ty
Recogni zability
Measu rabilit y
Reliabil ity Climate change impact indicators / vulnerability indicators
Share of paved areas in the permanent
settlement area 1 3 3 3 2 2 14
Proportion of buildings damaged by climate
change 1 3 3 2 2 1 12
Dampness & condensation in housing stock 1 2 3 2 1 1 10
Proportion of dwellings below housing
quality standard (including energy efficiency) 1 1 3 1 2 2 10
Property at risk of flooding 2 3 3 3 3 3 17
Settlement and transport areas at risk of
flooding 1 2 3 2 2 2 12
Residential areas in flood risk areas 1 3 3 3 3 3 16
Proportion of residential and non-residential
buildings in each energy efficiency class 1 2 3 3 2 2 13
Area and average intensity of urban heat
islands 1 3 3 2 2 2 13
–Resilience indicators
Number of properties protected from
coastal erosion 1 2 2 3 2 2 12
Proportion of green areas in the urban
environment 2 3 3 3 3 3 17
Areas reserved for nature and landscape
conservation 1 2 3 2 2 2 12
Areas reserved for groundwater protection
and drinking water abstraction 1 3 3 2 2 2 13
Areas reserved for flood protection purposes 1 3 3 3 2 2 14
Areas reserved for special climate functions 1 3 3 2 2 1 12
Adaptation action indicators
Net change in urban green space and blue
zones 2 3 3 3 2 2 15
Number/area of green roofs installed in
urban areas 1 3 3 3 3 2 15
Surface area of permeable paving applied to
properties 2 3 3 3 2 2 15
Weather-related business insurance claims 2 3 3 3 3 2 16
New housing supply 1 1 3 1 2 2 10
Affordable housing supply 1 1 3 1 2 1 9
Integrating climate change adaptation into
the legal framework conditions 1 3 3 3 2 2 14
Consideration of gravitational natural
hazards in land use planning regulations 1 2 2 2 2 2 11
Inclusion of climate change adaptation
criteria in building support programmes 1 3 3 3 2 2 14
Construction and renovation of public buildings including aspects relevant to adaptation
1 3 3 3 3 3 16
Loss ratio and loss-cost ratio for
comprehensive homeowners' life insurance 1 2 3 2 3 2 13
Indicator
Evaluation criteria
Total points Prevalen
ce
Relevance and adequacy
Suitabili ty
Recogni zability
Measu rabilit y
Reliabil ity Proportion of residential buildings covered
by extended insurance against natural hazards
1 3 3 3 3 3 16
People displaced due to climatic events 1 3 2 3 3 2 14
Average compensation per claim for
extraordinary (weather) risks 1 3 3 3 3 3 16
Number of municipalities that have
developed greening plans 1 3 3 2 3 2 14
Number of projects for infrastructure, residential and non-residential premises taking into account changes in meteorological conditions as a result of climate change and impact on human health
1 3 3 2 3 2 14
Proportion of newly built facilities equipped with systems to prevent the effects of heat waves
1 3 3 3 2 2 14
Sustainability and green infrastructure planning of settlements, urban areas and spaces, ecosystem services assessment, nature conservation and resilience
1 3 3 2 2 2 13
Number of spatial planning documents taking into account climate change adaptation issues
2 3 3 3 3 2 16
Availability of an up-to-date assessment of the territory's vulnerability (at municipal level) to the effects of climate change, Inclusion of measures to manage climate change risks and hazards in municipal action plans
1 3 3 2 2 2 13
Number of municipal climate change
adaptation plans developed 1 3 3 3 3 3 16
Citizens' willingness to insure property 1 2 3 2 2 1 11
Source: Authors work based on [Broniewicz et al., 2021].
Table 1.5. Assessment of climate change adaptation indicators for transport
IndicatorEvaluation criteria
Evalu ation Prevalen
ce
Relevance and adequacy
Suitabili ty
Recogniz ability
Meas urabi lity
Reliabil ity Climate change impact indicators - Vulnerability indicators
Road network at risk of flooding 1 3 3 2 3 2 14
Rail network at risk of flooding 1 3 3 2 3 2 14
Disruption risk to railway services as a result
of flooding 1 3 3 1 2 2 12
Failure of communication networks due to
power cuts 1 3 3 2 2 2 13
Risk of traffic disruption as a result of
flooding 1 3 3 2 2 2 13
Number of road and rail bridges at risk 1 3 3 2 3 2 14
Damage to transport infrastructure due to
extreme events 1 3 3 3 2 2 14
Landslide events affecting the road network 1 2 3 2 2 2 12
Navigability of inland waterways 1 2 2 1 2 2 10
Weather-related road accidents 1 2 3 2 2 2 12
Reliability of the transport network (disruptions to the communication network caused by "messy" roads and flooding)
1 2 3 1 1 1 9
Adaptation action indicators
Rail network benefiting from flood
protection 1 3 3 2 2 2 13
Road network benefiting from flood
protection 1 3 3 2 2 2 13
Increasing the share of walking, cycling and
public transport (excluding taxis) 1 2 3 3 3 2 14
Integration of climate change adaptation
into transport planning instruments 1 3 3 2 2 2 13
Pavement repairs on heavily trafficked road
sections 1 1 3 2 2 2 11
Investment in improving the reliability of
transport infrastructure 2 1 3 1 2 2 11
Increasing the resilience of transport
infrastructure to temperature changes 1 3 3 1 2 2 12
Source: Authors work based on [Broniewicz et al., 2021].
Table 2.6. Assessment of climate change adaptation indicators for nature and biodiversity conservation
Indicator
Evaluation criteria
Total point
s Prevalen
ce
Relevance and adequacy
Suitabil ity
Recogniz ability
Meas urabi lity
Reliabi lity Adaptation action indicators
Proportion of notified habitats and species in
‘positive’ or improving condition 1 2 3 1 2 2 11
Protected areas at national and international
level 3 3 3 3 3 3 16
Farmland bird population 1 2 3 1 3 2 12
Abundance and productivity of breeding
seabirds 1 2 3 1 3 2 12
Abundance of wintering water birds 1 2 3 1 3 2 12
Natural Capital Asset Index 1 1 3 1 2 2 10
Abundance/frequency of butterflies:
indicator and total species 1 2 3 1 2 2 11
Proportion of notified habitats and species in
‘positive’ condition 1 1 3 1 2 2 10
Proportion of reported habitats in
unfavourable condition 1 1 3 1 2 2 10
Number of reported freshwater habitat
features with invasive non-native species 1 3 3 1 2 2 12
Abundance/frequency of Arctic species 1 3 2 2 2 2 12
Extent of key semi-natural habitats: 1)
terrestrial, 2) coastal, 3) deep peat 1 3 3 3 2 2 14
Proportion of pine woodland exposed to
Dothistroma needle blight (DNB) 1 3 3 3 2 2 14
Forest bird species index 1 2 3 2 3 2 13
Forest butterfly species index 1 2 3 2 3 2 13
Indicator of breeding wetland birds 1 3 3 3 3 3 16
Bird distribution and wintering grounds 1 3 3 2 3 2 14
Status and trends of selected climate-
sensitive species and habitat types 1 3 3 2 2 2 13
Changes in the flora on Alpine summits 1 3 1 2 2 2 11
Projects and measures that contribute to
improving water ecology 1 2 3 1 2 1 10
Ecological and chemical status of surface
waters 1 2 3 3 3 3 15
Phenological changes (development phases)
in wild plant species 1 3 3 2 2 2 13
Temperature index in the bird species
community 1 2 3 2 2 2 12
Species composition of trees 1 3 3 2 3 3 15
Viability of forest stands 2 3 3 2 3 3 16
Soil condition 1 2 3 2 3 3 14
Tree species composition in natural forest
reserves 1 3 3 2 3 3 15
Threatened spruce stands 1 3 3 3 3 2 15
Increment of timber 1 2 3 2 3 3 14
Damaged wood 1 2 3 2 3 3 14
Wood damage and extent of expansion
caused by the wood bark beetle 2 3 3 3 3 3 17
Occurrence of the pine weevil 1 3 3 3 3 3 16
Threats from the oak bark beetle 1 3 3 3 3 3 16
Fire hazard of forest areas 1 3 3 3 3 3 16
Area affected by major forest fires 1 3 3 3 3 3 16
State of the forests 1 2 3 2 3 3 14
Mixed stands 1 2 3 2 3 3 14
Conservation of forest genetic resources 1 3 3 2 3 3 15
Humus resources in forest soils 1 2 3 2 3 3 14
Occurrence of heat-adapted species in
inland waters 1 3 3 3 3 3 16
Outbreaks of West Nile fever in equids 1 3 2 2 3 3 14
Endangered wild species 1 2 3 3 3 3 15
Invasive alien species 1 3 3 3 3 3 16
Proportion of ancient woodlands with declining overall suitability for lichen epiphytes
1 2 3 2 2 2 12
Proportion of coniferous forests in
medium/high wind risk areas 1 3 3 2 3 3 15
Proportion of Natura 2000 sites where
climate change is a pressure factor 1 3 3 3 3 3 16
Dangerous, new and easily spreading animal
diseases and pests 1 2 3 2 3 3 14
Losses in forestry due to plant and animal pathogens (development of pathogens due to improved living conditions)
1 3 3 3 2 2 14
Municipalities where the presence or establishment of the mosquito Aedes albopictus has been detected
1 3 2 3 3 2 14
Increase in the proportion of deciduous trees
in mixed forests 1 2 3 2 3 3 14
Extent of storm damage and forest owners'
efforts to deal with damage 1 3 3 3 2 2 14
Palmer drought severity index 1 3 3 3 3 3 16
Number of moths and occurrence of multi-
generational species 1 2 2 2 2 2 11
Number of species for which climate change
has been identified as a major threat 1 3 3 3 3 3 16
Distribution of warm-adapted marine
species 1 3 3 3 2 2 14
Response indicators (R) - Adaptation action indicators Area of local sites or habitats under adaptive
management 1 3 3 2 3 2 14
Indicator
Evaluation criteria
Total point
s Prevalen
ce
Relevance and adequacy
Suitabil ity
Recogniz ability
Meas urabi lity
Reliabi lity Proportion of managed ancient and native
woodland sites and annual PAWS (Planted
Ancient Woodland Sites) restoration area 1 1 3 1 2 2 10
Number of newly identified invasive species 1 3 3 3 3 3 16
Change in the number and range of invasive non-native species established in the country
1 3 3 3 3 3 16
Annual afforestation 1 2 3 2 3 3 14
Landscape resilience index 1 2 3 1 1 1 9
Area of land under landscape protection 1 1 3 2 3 3 13
Area of reclaimed peat bogs 1 3 3 3 3 3 16
Natural regeneration rate in forests 1 2 3 2 3 3 14
Proportion of forest land with sustainable
management certification 1 2 3 3 3 3 15
Integrating climate change adaptation into nature and landscape conservation instruments
2 3 3 3 2 2 15
Restoration of natural floodplains 1 3 3 3 3 3 16
Availability of information on adaptation in
forestry 1 3 3 2 2 2 13
Area of reconstructed endangered spruce
stands 1 2 3 2 3 3 14
Research and monitoring projects on the ecosystems services and values , integrating ecosystem services assessment into decision-making processes
1 2 3 2 3 3 14
Expenditure on measures to prevent the spread of invasive species due to the effects of climate change
1 3 3 3 2 2 14
Number of projects to restore the
hydrological regime of wetland forests 1 3 3 3 3 2 15
Projects implemented by owners and managers of commercial forests to conserve and protect elements of biodiversity
1 2 3 2 3 2 13
Expenditure on measures to provide effective forest protection measures against fires and pests, the conservation of small forests, spring areas, small rivers, wetlands, forest meadows and other forest ecosystems important for the conservation of biodiversity
1 3 3 2 3 2 14
Source: Authors work based on [Broniewicz et al., 2021].
s
ce adequac
y
Suitability
ability urabil
ity ity Pressure indicators
Water losses 1 1 3 3 2 2 12
Domestic and non-domestic water usage 3 2 3 3 3 3 17
Water and food contamination (contamination with biotoxins and pathogens
1 2 3 3 3 3 15
Climate change impact indicators / Vulnerability indicators
Occurrences of low summer flow in rivers 1 3 3 3 3 3 16
Average flow in rivers 1 3 3 3 3 3 16
Status and distribution of climate-sensitive species: abundance of Arcticcharr (Arctic char) in freshwater lakes
1 3 3 3 3 3 16
Number of reported freshwater habitat
features with invasive non-native species 1 3 3 2 3 2 14
Number of harmful algal blooms (HABs) 2 3 3 3 3 3 17
Groundwater quantity and quality 1 2 3 2 3 3 14
Retention areas 1 3 3 3 3 3 16
Ecological and chemical status of surface
waters 2 2 3 3 3 3 16
State of water resources 1 3 3 3 3 3 16
Number/frequency of floods 2 3 3 3 3 3 17
Flooding outside risk areas 1 3 3 3 3 3 16
Water outflow 1 2 3 2 2 2 12
Storm tide intensity 1 2 2 2 3 3 13
Episodes related to the
occurrence/elimination of microcystins in drinking water
1 3 3 3 3 3 16
Outbreaks of water-borne diseases
associated with droughts and floods 1 3 3 2 2 2 13
Number of situations of prolonged drought 1 3 3 3 3 3 16
Number of residents in flood risk areas 1 3 3 3 3 3 16
Population at risk within the floodplain 1 3 3 3 3 3 16
Reliability of raw water supply in water
utilities, especially in emergency situations 1 3 3 2 2 2 13
Reliability of the waste water disposal
system 1 2 3 2 2 2 12
Increased population migration due to
flooding 1 3 3 3 2 2 14
Residents of areas with limited access to
water 1 3 3 3 3 3 16
Adaptation action indicators
Projects and measures contributing to water
quality improvement 1 1 3 2 3 2 12
Number of freshwater monitoring stations 1 2 3 2 3 3 14
Progress towards the environmental objectives of the river basin management plans
1 2 3 2 2 2 12
Number of local flood strategies 1 3 3 3 3 3 16
Indicator
Evaluation criteria
Total point s Prevalen
ce
Relevan ce and adequac
y
Suitability Recogniz ability
Meas urabil ity
Reliabil ity Number of staff assigned to local flood risk
management 1 3 3 3 3 2 15
Investment in coastal protection 1 2 3 3 3 2 14
Compensation paid by insurance companies
for floods (rain floods, storm floods) 1 3 3 3 3 3 16
Capital expenditure to improve water supply
reliability 1 2 3 3 3 3 15
Flood protection measures for all residents
in flood-prone areas 1 3 3 3 3 3 16
Level of implementation of flood risk
management programmes 1 3 3 2 2 2 13
Improving the management of surface water, groundwater and the Baltic Sea and ensuring good water quality
1 2 3 1 1 1 9
Upgrading surface (rainwater) wastewater management infrastructure and ensuring its development in urban areas to protect urban areas from excess water and prevent the release of pollutants into the environment
1 2 3 2 3 3 14
Reduction of the negative impact of rising water levels and natural and catastrophic hydro-meteorological phenomena on the Baltic Sea coastal zone through natural coastal management measures
1 3 3 1 2 2 12
Implementation of the flood risk
management plan 1 3 3 3 2 2 14
Source: Authors work based on [Broniewicz et al., 2021].
Table 2.8. Assessment of climate change adaptation indicators within the economy sector for industry
Indicator
Evaluation criteria
Total point
s Prevalen
ce
Relevance and adequacy
Suitabili ty
Recogniz ability
Meas urabi lity
Reliabi lity Pressure indicators
Non-fluvial water intake for fish farming 1 2 3 2 3 2 13
Office space supply (local) 1 1 3 1 2 2 10
Availability of industrial sites (local) 1 1 3 1 2 2 10
Water consumption in the manufacturing
sector 1 2 3 3 3 3 15
Climate change impact indicators / Vulnerability indicators
Water treatment plants in flood risk areas 1 3 3 3 3 3 16
Wastewater treatment plants in flood risk
areas 1 3 3 3 3 3 16
Proportion of fish stocks managed
sustainably 1 2 3 2 2 2 12
Sale of goods and services for climate change
adaptation 1 3 2 2 1 1 10
Patents registered by companies for water-
related adaptation measures 1 3 3 2 3 3 15
Energy supply disruption for businesses 1 2 3 3 3 3 15
Reduction in performance caused by high
temperatures 1 3 3 1 1 1 10
Economic damage caused by coastal storms 1 3 3 3 2 2 14
Changing latitudinal range of industries in response to changing optimum conditions for species-specific growth, e.g. aquaculture
1 3 3 2 2 2 13
Adaptation action indicators
Expenditure on co-financing the adaptation
of infrastructure to climate change 1 3 3 3 3 2 15
Integration of adaptation aspects into
environmental management systems 1 3 3 2 2 2 13
Expenditure and projects related to reducing the impact of catastrophic meteorological events on industry
1 3 3 3 2 2 14
Resignation of fish farming due to
unfavourable weather conditions 1 3 3 3 2 2 14
Source: Authors work based on [Broniewicz et al., 2021].
Table 2.9. Assessment of climate change adaptation indicators for the health sector
Indicator
Evaluation criteria
Total points Prevalen
ce
Relevance and adequacy
Suitabilit y
Recogn izabilit
y
Meas urabil ity
Reliabil ity Exposure indicators
Number of days with ozone concentrations:
≥ 100 μg/m3 1 2 3 2 3 3 14
Number of days with ozone concentrations:
≥ 120 μg/m3 1 2 3 2 3 3 14
Annual concentration of PM2.5 1 2 3 2 3 3 14
UV radiation 1 2 3 2 3 3 14
Proportion of the population directly or indirectly exposed to risks related to climate change: avalanches, cyclones, storms, forest fires, floods, etc.
1 3 3 3 2 2 14
Population exposed to the effects of a changing climate (taking into account the vulnerability of age groups and the number of hot and cold days)
3 3 3 3 2 2 16
Number of temperature exceedances above
warning thresholds (severity) 1 3 3 3 3 3 16
Concentration of potentially allergenic
pollen in the air 1 2 3 3 3 3 15
Length of pollen season (including birch,
walnut, hay, willow, alder) 3 3 3 3 3 3 18
Concentration of allergenic fungal spores in
the atmosphere 2 3 3 3 3 3 17
Indicator
Evaluation criteria
Total points Prevalen
ce
Relevance and adequacy
Suitabilit y
Recogn izabilit
y
Meas urabil ity
Reliabil ity Climate change impact indicators
Allergic diseases: dermatitis, eye
inflammation, skin sensitivity/irritation 2 2 3 2 2 2 13
Diseases caused by blood-sucking insects:
malaria, dengue fever, yellow fever, West Nile fever, West Valley fever, tularemia, Chikungunia virus, syndicate virus, Tahyna virus
1 3 2 3 3 3 15
Diseases caused by other insects: visceral and cutaneous leishmaniasis, chandipura virus, Sicilian virus, tularemia, Tuscan virus, Neapolitan virus
1 3 2 3 3 3 15
Tick-borne diseases: Lyme disease, tick- borne encephalitis, ehrlichiosis, Mediterranean spotted fever, Crimean- Congo haemorrhagic fever, tularemia
3 3 3 3 3 3 18
Diseases caused by protozoa: visceral
leishmaniasis; schistosomiasis 1 3 3 3 3 3 16
Rodent-borne diseases: leptospirosis, Hanta virus, haemorrhagic fever (with HFRS syndrome), plague, vasculitis and meningitis virus, smallpox virus, Lhasa virus
1 3 3 3 3 3 16
Summer mortality due to high temperatures 1 3 3 3 2 2 14
Winter mortality due to low temperatures 2 3 3 3 3 3 16
Impact of floods on mental health 1 3 3 2 1 2 12
Indigenous cases of malaria 1 3 2 3 3 3 15
Indigenous cases of West Nile virus 1 3 2 3 3 3 15
Mortality due to high ozone concentrations
(2 groups: ≥ 100 μg/m3, ≥ 120 μg/m3) 1 2 3 2 2 2 12
Mortality due to PM2.5 concentrations ≥ 10
μg/m3 1 2 3 2 2 2 12
Pathogen carriers 1 1 3 1 2 2 10
Blue algae contamination in bathing waters 1 3 3 3 3 3 16
Emergency room visits for
hyperthermia/heatstroke 1 3 3 3 3 3 16
Hospital admission due to effects of hot
weather 1 3 3 3 3 3 16
Excess of observed overall mortality over
expected mortality 1 1 3 2 3 2 12
Mortality rate from respiratory causes 1 2 3 2 3 3 14
Cardiovascular mortality rate 1 2 3 2 3 3 14
Emergency hospital admissions for chronic
obstructive pulmonary disease 1 2 3 2 3 3 14
Emergency hospital admissions for allergic
asthma 1 1 3 2 3 3 13
Indigenous dengue cases 1 3 2 3 3 3 15
Indigenous cases of Chikungunya virus
disease 1 3 2 3 3 3 15
Cases of Mediterranean rash fever
(exothermic) 1 3 2 3 3 3 15
adequacy y
ity Fatalities from forest fires, flooding and
coastal storms 1 3 3 3 3 3 16
Water-borne epidemics and heat wave caused by climate change (number of food poisoning outbreaks by pathogen, e.g.
salmonella, Campylobacter)
1 3 3 2 3 2 14
Number of rescues per year due to natural
phenomena 1 3 3 3 3 3 16
Average duration of rescue operations due to natural phenomena and total duration per year
1 3 3 3 3 3 16
Morbidity and mortality from cardiovascular and respiratory diseases, kidney disease, diabetes, mental illness and behavioural disorders
1 2 3 1 3 3 13
Food- and water-borne diseases 1 3 3 2 3 2 14
Heat shock, injury, starvation, exhaustion,
death 1 3 3 2 3 2 14
Skin cancer, cataracts of the eye 1 3 3 3 3 3 16
Diseases of the stomach, digestive system, liver disease, kidney disease diabetes, mental and behavioural disorders
1 1 3 2 3 3 13
Diseases caused by parasites: fascioliosis, gardenia. Diseases caused by viruses and bacteria: hepatitis A, E, diarrhoea, cholera, legionellosis, typhoid fever, shigellosis, campylobacteriosis, E. coli rotovirus, salmonellosis, botulism, cryptosporidiosis, yersiniosis
1 2 3 2 3 3 14
Oncological diseases 1 1 3 2 3 2 12
Health disorders caused by insufficient water
and deteriorating water quality 1 2 3 2 2 2 12
Changes in public health as a result of forest
fires 1 3 3 1 2 2 12
Health disorders related to hunger, malnutrition and important trace element loss
1 3 3 2 2 2 13
Increased mortality due to lack of food, heat,
suicide, outbreaks of violence 1 3 3 2 2 2 13
Increased health risks during tourist activity 1 2 2 2 2 2 11
Anxiety and depression over economic
losses due to drought 1 3 3 2 1 2 12
Patients with tuberculosis, exhausted by starvation, patients with infectious diseases, patients with chronic diseases, patients with mental or physical disabilities
1 2 3 2 2 2 12
Adaptation action indicators
% of clinical areas covered by thermal
monitoring 1 3 3 3 3 3 16
% of health care providers reporting
adaptation to change in annual reports 1 3 3 1 2 2 12
Indicator
Evaluation criteria
Total points Prevalen
ce
Relevance and adequacy
Suitabilit y
Recogn izabilit
y
Meas urabil ity
Reliabil ity Number of overheating risk assessments
carried out in clinical areas of NHS trust (required when temperature exceeds 26 degrees C)
1 3 3 2 2 2 13
Increasing the length of cycle paths and
number of cycle parking facilities 1 2 3 2 3 3 14
Monitoring and early warning systems 2 3 3 3 3 3 17
High temperature warning service 2 3 3 3 3 3 17
Heat warning system activity 1 3 3 2 3 3 15
Pollen information 1 2 3 3 3 3 15
Activity of the coastal warning system 1 3 3 2 3 3 15
Increasing the number of nursing staff in the
region 1 1 3 2 3 3 13
Improve public information on climate change and the risks it poses to human health
1 3 3 1 1 2 11
Pollen monitoring and forecasting, ticks, phenological observations and indicators relevant to determining the impact of climate change on human health
1 3 3 2 3 3 15
Prevention of diseases that can arise and
spread as a result of climate change 1 3 3 1 1 2 11
Source: Authors work based on [Broniewicz et al., 2021].
Table 2.10. Assessment of climate change adaptation indicators for tourism
IndicatorEvaluation criteria
Total point s Prevale
nce
Relevance and adequacy
Suitabili ty
Recogni zability
Meas urabi lity
Reliabi lity Climate change impact indicators / vulnerability indicators
Cultural heritage in flood-risk areas 1 2 3 2 3 3 14
Seasonal schedule of accommodation 1 2 3 3 3 3 15
Ecotourism 1 2 3 1 2 2 11
Accommodation in a coastal tourist area 1 1 3 3 2 2 12
Heat stress in climatic spas 1 3 3 2 3 3 15
Accommodatio