A Comparative Analysis on Awareness Among Female Students of Technical and Medical Field Associated within Colleges From Tamilnadu and Pondicherry regarding gynaecological Cancers by Random Sampling
Method Using Statistical Analysis
Mohamed Adil A.A1,2*, Saba Fathima1, Hari priya2, Ashok Kumar pandurangan3 , Shyam kumar4, Revathi. K2*, Anandraj Vaithy5, Nibeditha dey2, Dannie Macrin2
1Meenakshi academy of higher education and research, chennai, India
2Saveetha School of Engineering, Saveetha Institute of Medical and Technical Sciences, Thandalam, Chennai – India
3. B.S.Abdur Rahman Crescent institute of science and technology, Chennai, India 4. School of medicine, John Hopkins University, Baltimore, Maryland, United states of America 5. Faculty of Medicine, Mahatma Gandhi medical college and research institute (SBV), Pondicherry,
India Correspondence:
Mohamed Adil A.A, Associate professor, Meenakshi academy of higher education and research, Chennai, India. [email protected], [email protected], [email protected]
Abstract:
Aim: Comparative analysis on awareness of cervical cancer among female students perceiving technical and medical field associated education.
Materials and Methods: This study employs a validated questionnaire to investigate knowledge and attitudes relating to cervical cancer. N= 300 samples were analysed with SPSS software for investigating the parameters such as the awareness of cervical cancer prevention, knowledge on screening, awareness on risk factors, and family history. The sample size was calculated by maintaining G-power 80%, α=0.05, and a confidence interval of 95%.
Results: The knowledge on cervical cancer from the survey was found that technical students (62.8%) had a higher understanding of self-effort compared to medical students (37.2%). The knowledge on ovarian cancer from the survey found that technical students (62.8%) had a higher understanding of self-effort compared to medical students (37.2%). The knowledge on uterine cancer from the survey was found that technical students (62.8%) had a higher understanding of self-effort compared to medical students (37.2%). The knowledge on vaginal cancer from the survey portrays that the technical students (62.8%) seem to have a higher understanding through self-effort when compared to medical students (37.2%). The statistical value by chi-square analysis was found to be statistically insignificant between the datasets. The significance value is P=0.807.
Conclusion: The medical students had retarded awareness when compared with the technical students. The significant gap with inadequate awareness on gynaecological cancer and lack of understanding due to social stigma was found to have retarded knowledge among medical students and technical students.
Keywords: Awareness, Risk Factors, Screening Techniques, Innovative Knowledge, Cervical Cancer Prevention, Community Medicine, Public Health, Medical Informatics.
1. Introduction
The cervical cancer symptoms are often attributed to other conditions affecting women. The previous studies showed that the frameworks regarding the particular knowledge and its determinants among the public and this study indicates factors contributing to the high morbidity and mortality rates of cervical cancer (McTiernan, Irwin, and VonGruenigen 2010). Creating awareness, providing knowledge about cervical cancer and the need for early detection is crucial for cervical cancer screening and health care applications (Nyengidiki 2015). Improving the result of cervical cancer screening and recovery by early diagnosis is the application-focused in this study (Aref-Adib and Freeman-Wang 2014)
Evaluation of preoperative symptoms and factors that may contribute to delayed diagnosis for women with ovarian carcinoma (Deligdisch, Kase, and Cohen 2013). When women are diagnosed with cancer limited to the ovary that has not spread their chance of survival is often high (Lacey et al. 2002). Ovarian cancer at a molecular level could reveal potential biomarkers of disease diagnosis and progression as well as possible therapeutic targets in areas (Pereira et al. 2016). Awareness of ovarian cancer symptoms and risk factors among women in the general population is low. Ovarian cancer is often diagnosed at late stages, when cure is difficult; consequently, heightening women's awareness of risk factors and symptoms might help to reduce delays in diagnosis (Lockwood-Rayermann et al. 2009).
Uterine cancer is the most rapidly increasing malignancy and the second most common gynecological malignancy (Lee et al. 2015). Uterine carcinomas account for the majority of cases of uterine cancer, while uterine sarcomas are rare and only account for 4.2% of all corpus uteri malignancies (Boll et al. 2012). Because of the rarity of papillary serous carcinomas, clear cell carcinomas and carcinosarcomas, only a few population-based follow- up studies on the outcomes of these types of uterine cancer have been reported (Creasman et al. 2004). Most of the outcome studies on uterine sarcomas have been based on small retrospective series from a single institution, which lacks the power to make significant conclusions (Oláh et al. 1991). This exploratory cross-sectional survey was conducted to understand the attitude towards awareness and perseverance towards disease management of uterine cancer among technical and medical fields associated, female students in universities.
It will have potential applications in the field of community medicine to have a centralised database based on the area and locality of the patient. This will guide the medical practitioners and clinicians to approach patients well depending on their understanding about the disease (Tannock and Hill 1998)
About 161 research studies were found to be relevant to cervical cancer awareness in google scholar. Similarly, around 1,005 studies were found relevant in PubMed. The objective of a study conducted in 2019 was to assess the knowledge and attitudes towards cervical cancer screening and prevention. They suggested that cervical cancer is highly preventable and can be easily treated if detected at early stages (Mohamed adil a.a et al. 2019). A similar study by Efard and team suggested that the effects of some characteristics and risk factors associated with cervical cancer will aid in diagnosis and treatment on women’s sexual life, quality, and
functional status (Efared et al. 2019; Akkuzu, Talas, and Erdogan 2012). Women with secondary and tertiary levels of education were more likely to have heard of cervical cancer (Mitiku and Tefera 2016). In the same way, students associated with patients with malignant metastatic diseases were more likely to know about the disease (Hailu and Mariam 2013).
Vaginal cancer is an uncommon gynecologic malignancy. The diagnosis of primary vaginal cancer is rare because most of these lesions will be metastatic from another primary site.
Primary vaginal cancer is rare, making up 1% to 2% of all female reproductive tract cancers (Adams and Cuello 2018). The vaginal fornices are denoted as anterior, posterior, and lateral concerning the cervix (Gardner et al. 2015). The majority of these metastases arise from other reproductive organs such as the cervix, endometrium, or ovary, although they can also metastasize from distant sites such as the colon, breast, and pancreas (Ng et al. 2015). The human papillomavirus (HPV) is a known carcinogen for the tumor of the vagina, however, non-HPV based carcinogenic factors also exist. A study of this kind will hold potential application towards fabricating a medical database specific for diseases and individuals that can be of great use to medical practitioners and government public health agencies (Ng et al.
2015; Siegler et al. 2016) (Mohamed Adil et al 2014, 2019).
The variation in the primitive knowledge towards preliminary understanding pertaining to the disease management and medical screening methods of various gynaecological cancers have not been functionally identified. The need for awareness about the parameters leading to gynaecological cancer will pave the way to early diagnosis and ultimately save millions of lives. This exploratory, descriptive, cross-sectional survey is to understand the awareness, knowledge and perseverance towards disease management towards cervical cancer among technical and medical fields associated with female students in universities. Our study aims to examine and compare the female technical and medical field associated with students' awareness and perspectives on gynaecological cancer.
3.Materials and methods
The current study was initiated and data analysis was conducted in Saveetha school of Engineering with concern form from every parrticipants. Descriptive, online, self- administered survey questionnaires were circulated among female students of colleges in Chennai, pondicherry and Kanchipuram regions. The information was collected from the responses given by students regarding cervical cancer. Survey collected data based on viewpoint, attitude, or action held on a given topic by a group of individuals. The sample size was calculated using a sample size calculator for incidence values reported in the cited base paper (Kashyap et al. 2019)). The calculated sample size was found to be 34 which we felt was very low for a survey-based study. Hence keeping the base paper as a reference we increased the overall sample size to 300. Group 1 had 190 responses from technical students and group 2 had 110 responses for medical field-associated students. The sample size was calculated by maintaining G-power 80%, α=0.05, and confidence interval 95%
(clinical.com/samplesize.aspn; (Kashyap et al. 2019).
A self-administered questionnaire was developed using previously published papers. (Chaka et al. 2018). It was a questionnaire that has been deliberately designed to be answered by a respondent without the data collection involvement of the researchers and was a cost- effective way to easily gather vast quantities of information in a relatively brief period from a large number of participants. A total of 300 female students participated in this survey and the information was collected from the responses of each individual for data analysis.
Participants were female students from different departments of the university. Group 1 students were from technical universities and group 2 students were from medical universities. The link for the questionnaire was shared with students online and the responses were recorded. All the data collected from the responses were entered into Microsoft excel.
The data were analyzed using descriptive statistics to evaluate the participant’s demographic data and responses.
Statistical Analysis:
The statistical software used to analyze the data was SPSS version 21. The dependent variables in our study were the risk factors and the type of educational universities under survey. A Chi-square test was performed to predict the association between the outlined variables.
Results:
Cervical cancer:
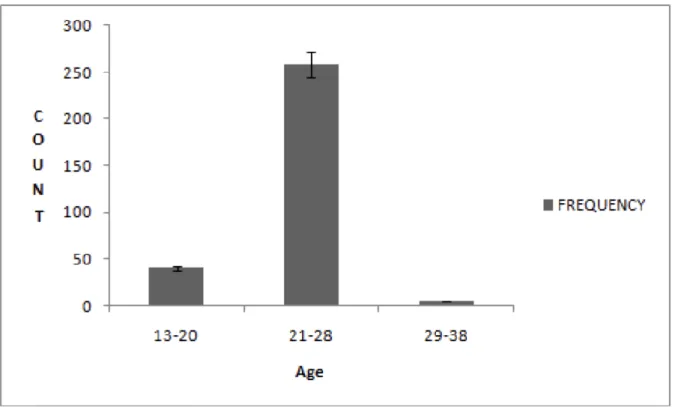
Table 1 represents the distribution of age among female students in universities between the ages of 13 to 38. A total of 300 participants responded. 85.8% of the respondents were in their 20s. Fig. 1 represents the distribution of age among females and students in universities.
The respondent ranged from 13-20 (12.6%), 21-28 (85.8%) and 29-38 (1.6%) age groups.
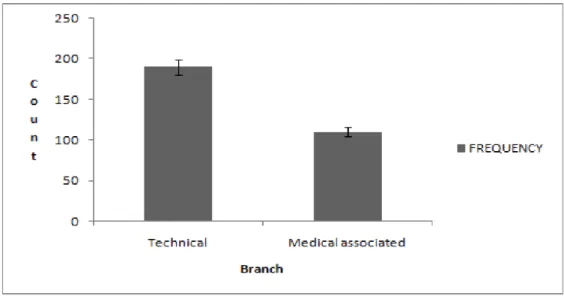
Table 2 suggests a comparison between the awareness responses given by both technical students and medical field-associated students in universities. This table showed technical students contributed to 62.8% and medical field associated students contributed to 37.2%.
The contribution of technical students is high compared to medical field associate students.
Fig. 2 represents the comparison of respondents between the technical students and the medical field associated students. A maximum number of students were from technical institutes (62.8%).
Table 3 depicts the list of questions used in the survey related to experience and knowledge on cervical cancer among female students in universities. The viral nature of cervical cancer was very evident to most of the participants (59.5%). Table 4, 4a represents the knowledge on the hereditary transmission of cervical cancer between technical and medical associated students. 63.1% of the student population was well aware of this fact. Table 5, 5a depicts the knowledge of students towards symptoms and risk factors associated with cervical cancer.
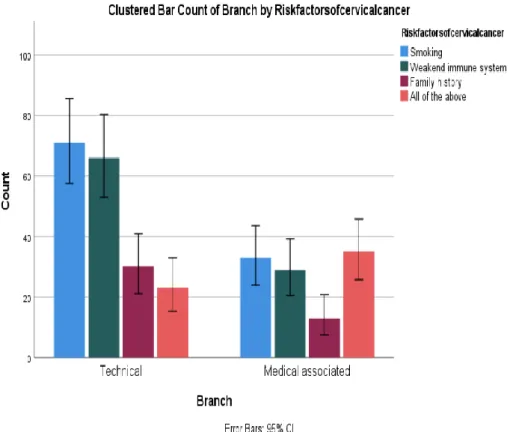
Human papillomavirus being the causative agent got the maximum responses (37.6%). For risk factors smoking bagged the maximum responses (35.1%). Table. 6, 6a represents the comparison between the branch of education and the knowledge on risk factors of cervical cancer. There was a statistically significant difference between the data. Fig. 3 represents bar
chart comparison between the branch and the risk factors of cervical cancer. Smoking was found to be the highest risk factor as per technical students (70%), whereas medical associates claim all the risk factors have an almost equal share in causing cancer.
Table 7 suggests the comparison of branch and family history. There is an insignificant difference between the data. Fig 4, 4a is a bar chart that represents the comparison between the branch and family history of cervical cancer (P value was statistically insignificant).
Technical students had more knowledge on family history when compared to medical associated students (140 responses). Tables 8, 8a suggest the relationship between branch and knowledge on screening. The bar chart in Fig. 5 represents the relation between branch and knowledge of screening are significantly different. Technical students had more awareness of the same when compared to their counterparts.
In Table 9, 9a the knowledge on the study branch and the prevention methods on cervical cancer is represented. Fig. 6 represents the comparison between the branch and knowledge on cervical cancer prevention. This data was statistically insignificant. Here too technical students seemed to have more awareness of the prevention measures that need to have opted for cervical cancer.
Ovarian cancer:
Table 1 represents the distribution of age among female students in universities between the ages of 13 to 38. A total of 300 participants responded. 85.8% of the respondents were in their 20s. Fig. 1 represents the distribution of age among females and students in universities.
The respondent ranged from 13-20 (12.6%), 21-28 (85.8%) and 29-38 (1.6%) age groups.
Table 2 suggests a comparison between the awareness responses given by both technical students and medical field-associated students in universities.
This Table 2 showed technical students contributed to 62.8% and medical field associated students contributed to 37.2%. The contribution of technical students is high compared to medical field associate students. Figure 2 represents the comparison of respondents between the technical students and the medical field associated students. A maximum number of students were from technical institutes (62.8%). Table 3 depicts the list of questions used in the survey related to experience and knowledge on ovarian cancer among female students in universities. The viral nature of ovarian cancer was very evident to most of the participants (60.6%).
Table 4 represents the knowledge on ovarian cancer between the technical and medical associated students. 41.4% of the student population was well aware of this fact. Table 5a and 5b depicts the knowledge of students towards symptoms and risk factors associated with ovarian cancer. Figure 3 represents a bar chart comparison between the branch and the risk factors of ovarian cancer. Table 6a and 6b represents the comparison of branch and knowledge on ovarian cysts. Figure 4 represents a bar chart comparison between the branch and knowledge on ovarian cysts. Technical students have more knowledge compared to medical-associated students.
Uterine cancer
Table 1 represents the distribution of age among female students in universities between the ages of 13 to 38. A total of 300 participants responded. 85.8% of the respondents were in their 20s. Figure 1 represents the distribution of age among females and students in universities. The respondent ranged from 13-20 (12.6%), 21-28 (85.8%) and 29-38 (1.6%) age groups. Table 2 suggests a comparison between the awareness responses given by both technical students and medical field associated students in universities. This table showed technical students contributed to 62.8% and medical field associated students contributed to 37.2%. The contribution of technical students is high compared to medical field associate students. Figure 2 represents the comparison of respondents between the technical students and the medical field associated students. A maximum number of students were from technical institutes (62.8%).
Table 3 depicts the list of questions used in the survey related to experience and knowledge on uterine cancer among female students in universities. Table 4 represents the knowledge on uterine cancer between the technical and medical associated students. 37.8% of the student population was well aware of this fact. Table 5a, 5b depict the knowledge of students towards symptoms associated with uterine cancer. Figure 3 represents a bar chart comparison between the technical and medical associated with the symptoms of uterine cancer. Table 6a, 6b represents the comparison of technical and medical knowledge associated with knowledge on uterine cancer diagnosis. Figure 4 represents a bar chart comparison between the technical and medical associated with knowledge on uterine cancer diagnosis. Table 7a, 7b depict the knowledge of students towards detection by pap test associated with uterine cancer. Figure 5 represents a bar chart comparison between the technical and medical associated with the knowledge of uterine cancer detection by pap test. Technical students have more knowledge compared to medical field associated students.
Vaginal Cancer
Table 1 represents the distribution of age among female students in universities between the ages of 13 to 38. A total of 300 participants responded. 85.8% of the respondents seemed to be in their 20s. Figure 1 represents the distribution of age among females and students in universities. The respondent ranged from 13-20 (12.6%), 21-28 (85.8%) and 29-38 (1.6%) age groups. Table 2 suggests a comparison between the awareness responses given by both technical students and medical field-associated students in universities. This showed technical students seemed to contribute 62.8% of the total responses and medical field associated students seemed to contribute to 37.2%. The contribution of technical students appeared to be high compared to medical field associate students. Figure 2 represents the comparison of respondents between the technical students and the medical field associated students. A maximum number of students seemed to be from technical institutes (62.8%).
Table 3 depicts the list of questions used in the survey related to experience and risk factors of vaginal cancer among female students in universities. Table 4 represents the knowledge on
vaginal cancer between the technical and medical associated students. 65.2% of the student population seemed to be well aware of this fact. Table 5a and Table 5b depicts the knowledge of students towards risk factors associated with vaginal cancer. Figure 3 represents a bar chart comparison between the technical and medical associated with risk factors of vaginal cancer.
Table 6a and Table 6b represent the comparison of technical and medical knowledge associated with knowledge on vaginal cancer. Figure 4 represents a bar chart comparison between the technical and medical associated with knowledge on vaginal cancer. Technical students seemed to have more knowledge compared to medical-associated students.
3. Discussion Cervical cancer
Our study suggests the awareness and knowledge, specifically for cervical cancer among women medical associated students, was found to be extremely poor. Most of the study was found to be statistically insignificant except for the responses for awareness on risk factors.
Women with secondary and tertiary levels of education were more likely to have heard of cervical cancer (Mitiku and Tefera 2016); (Getahun et al. 2013); (Woldeamanuel, Girma, and Teklu 2013); (Mitiku and Tefera 2016). Students associated with patients with malignant metastatic diseases were more likely to know about the disease (Hailu and Mariam 2013).
The Chi-square test and P-value of technical and medical field associated students were accustomed to ascertain the significant relationship between the variables. The technical students showed statistical insignificance with the knowledge on various gynecological cancers like cervical cancer compared with medical field-associated students. The medical field-associated women (37.2%) were found to have retarded awareness of cervical cancer even though they had exposure to the disease through the course of their education. On the contrary technical female students had better awareness of cervical cancer and on early prevention and treatment of the same (62.8%). This has been depicted in Fig. 2 Such awareness of problems would offer new perspectives on the topic such as medical screening.
This helped us to quantify the effect of our observation on the general community we were studying, as well as the shifts in the beliefs, perceptions, and activities of our respondents over time.
The previous studies showed that the frameworks regarding the particular knowledge-based awareness and its determinants among people indicated various parameters and factors that contribute to the high morbidity and mortality rates of cervical cancer among women (Chaka et al. 2018). The research conducted in 2013 on awareness, risk factors, background knowledge, and screening programs on cervical cancer suggested regular training towards the exposure of disease is required in the management of the disease (Viens et al. 2017); (Hailu and Mariam 2013). This study was planned to determine the level of concern among university students about gynecological cancers (Ng’ang'a et al. 2018). We focused primarily on views of the triggers of gynecological cancer, adverse outcomes associated with gynecological cancer, and understanding of methods of gynecological review (Kasting et al.
2017). Since most of the studies favor the efficiency and efficacy of survey-based study on
cervical cancer awareness and prognosis, hence we were unable to cite a negative article on the same.
Ovarian cancer
The technical students showed statistical insignificance with the knowledge on various gynecological cancers like ovarian cancer compared with medical field associated students.
The medical field-associated women (37.2%) were found to have retarded awareness of ovarian cancer even though they had exposure to the disease through the course of their education. On the contrary technical female students had better awareness of ovarian cancer and on early prevention and treatment of the same (62.8%). Such awareness of problems would offer new perspectives on the topic such as risk factors. This helped us quantify the effect of our observation on the general community we were studying and the shifts in the beliefs, perceptions, and activities of our respondents over time. This study suggests the awareness and knowledge of ovarian cancer among women technical and medical associated students. This study was found to be statistically insignificant. The risk of developing ovarian cancer increases with age, yet poor knowledge and absence of concern about ovarian cancer may mean that symptoms experienced by older women are attributed to other causes such as the menopause or aging process, rather than recognized as the potential threat to health (Ramirez et al. 2019). Improving women's confidence may be necessary to bridge the gap between ovarian cancer symptom awareness and earlier presentation, for example by providing an explicit action plan that describes how and when to act on potential ovarian symptoms (Diaz-Padilla 2013). The chi-square test and P-value of technical and female associated students were accustomed to ascertain the significant relationship between variables.
This study shows that the frameworks regarding the particular knowledge-based awareness and its determinants among people indicated various parameters and factors. The relationship between cancer symptom awareness and actual presentation would ideally be tested in large- scale prospective studies (Andersen et al. 2009; Freij et al. 2018). Comparison with women at increased risk due to a family history of ovarian cancer would help to illuminate the role of emotions in appraising and acting on ovarian symptoms (Brain et al. 2014; Sapkota, and Abhyankar 2019). Most of the studies favor the efficiency and efficacy of survey-based analysis on ovarian cancer towards its awareness and disease prognosis.
Uterine cancer
The chi-square test and P-value of technical and female associated students were accustomed to ascertain the significant relationship between variables. The technical students showed statistical insignificance with the knowledge on various gynecological cancers like uterine cancer compared with medical field associated students. The medical field-associated women (37.2%) were found to have retarded awareness of uterine cancer even though they had exposure to the disease through the course of their education. On the contrary technical female students had better awareness of uterine cancer and on early prevention and treatment of the same (62.8%). Such awareness of problems would offer new perspectives on the topic such as risk factors. This helped us quantify the effect of the observation on the general
community. The shifts in the beliefs, perceptions, and activities of the respondents over time were analysed. This study was found to be statistically insignificant. It demonstrates the risk of uterine cancer in women with PCOS in a national population-based cohort study (Colafranceschi et al. 2019).
Women with PCOS have several risk factors for uterine cancer including chronic anovulation, obesity, and hyperinsulinemia, and therefore may be at increased risk of developing uterine cancer (Shafiee et al. 2020). Endometrial cancer is the most common type of uterine cancer, and studies have shown that most cases of endometrial cancer occur between the ages of 60 and 70 years (Jick, et al 2008). This study shows that the frameworks regarding the particular knowledge-based awareness and its determinants among people indicated various parameters and factors. Previous studies have demonstrated that obesity is associated with earlier age at diagnosis of endometrial cancers (Al-Wahab et al. 2011). The risk factor for uterine cancer because fat tissues tend to produce higher levels of estrogen (Nevadunsky et al. 2014). The young age of onset of these patients’ uterine cancer highlights the need for additional study to better understand PCOS and to determine what uterine cancer screening and preventive strategies are needed (Pierpoint et al. 2011). The association between dysregulated thyroid hormone function and cancer risk is inconclusive, especially among different age groups and uncommon malignancies (Krashin et al. 2021). Since, most of the consensus supported the benefits of survey based study on diagnosis and health care, hence no negative citations were provided for the same.
Vaginal cancer
The medical field-associated women (37.2%) seemed to have retarded awareness vaginal cancer even though they had exposure to the disease through the course of their education.
On the contrary, technical female students appeared to have better awareness of vaginal cancer and on early prevention and treatment of the same (62.8%). Maximum respondents seemed to be from the age group of 21-28 (85.8%). 65.2% of the student population appears to be well aware of the knowledge on vaginal cancer. The statistical value by chi-square analysis appears to be statistically insignificant between the datasets. The significance value is P=0.807.
Such awareness of problems would offer new perspectives on the topic such as risk factors.
This helped us quantify the effect of our observation on the general community we were studying and the shifts in the beliefs, perceptions, and activities of our respondents over time.
The chi-square test and P-value of technical and female associated students were accustomed to ascertain the significant relationship between variables. The technical students showed statistical insignificance with the knowledge on various gynecological cancers like vaginal cancer compared with medical field associated students This study suggests the awareness, attitude and innovative knowledge on vaginal cancer among women technical as well as medical field associated students. This study of the risk factors is found to be statistically significant. Vaginal cancer is not a common gynecological cancer. Some report rising trends especially in women beyond 75 (Daling et al. 2002). The known risk factors for vaginal
cancer, particularly the prevalence of oncogenic HPV infection (Khan et al. 2005).
Concerning clinical characteristics, the majority of vaginal cancer cases are Stage 1 and have squamous cell histology as has been previously described (Khan et al. 2005; Creasman et al.
2015). This study shows that the frameworks regarding the particular knowledge-based awareness and its determinants among people indicated various parameters and factors.
Vaginal cancer has often been treated similarly to cervical cancer (Henson and Tarone 2018).
They partially contain the same epithelium, are embryologically similar, and share many of the same exposures as risk factors (Davis et al. 2013). However, there is a dearth of data on the population-based level on the impact of concurrent chemo-radiation in women with vaginal cancer (Grigsby 2019). Most of the studies seem to favor the efficiency and efficacy of survey-based analysis on awareness and attitude of vaginal cancer. Hence a negative consensus on the same is not cited.
Participants of the study had different attitudes and less experience towards the early examination of vaginal cancer. The social stigma is a primary factor among women, resulting in lack of medical examination due to the feminine social stigma towards vaginal cancer and associated questions in the survey. The analysis provides useful information based on vaginal cancers perseverance.
Tables and Figures for cervical cancer
Table 1: Distribution of age among females and students in universities between the ages of 13 to 38. A total of 300 participants responded. This table shows the age group of females.
AGE FREQUENCY PERCENTAGE
13-20 40 12.6
21-28 258 85.8
29-38 5 1.6
Table 2: Comparison between both technical students and medical field associate students in universities. This table shows technical students contribute 62.8% and medical field- associated students contribute 37.2%. The contribution of technical students is high compared
to medical field associate students.
BRANCH FREQUENCY PERCENTAGE
Technical 190 62.8
Medical associates 110 37.2
Total 300 100
Table 3: List of questions of the survey related to experience and knowledge of cervical cancer among female students in universities.
VARIABLE
Percentage of population who are aware (%)
Percentage of population who are not aware (%) Is cervical cancer caused by a
virus 175(59.5%) 119(40.5%)
Is cervical cancer can occur at
any age even in childhood 158(53.6%) 137(46.5%)
Have you be screened for
cervical cancer 154(52.4%) 140(47.6%)
Is cervical cancer preventable 154(51.8%) 135(45.9%)
Table 4: This table represents the knowledge on the family history between technical and medical associated students and cervical cancer.
Variable
Percentage of population who are aware (%)
Percentage of population who are not aware (%) Family history of
cervical cancer 188(63.1%) 77(25.8%)
Have you ever heard of
cervical cancer 77(25.9%) 220(74.1%)
Table 5: Knowledge of cervical cancer and symptoms and risk factors of cervical cancer among participants. It is determined in frequency and percentage.
VARIABLE FREQUENCY PERCENTAGE
The common cause of cervical cancer:
1.HPV
2.Radiation exposure 3.Pollution
4. Using intravenous drugs
111 99 58 27
37.6 33.6 19.7 9.2
Risk factors for developing cervical cancer 1.Smoking
2.weakened immune system 3.family history of cervical cancer
4.All the above
104 95 45 54
35.1 32.1 14.5
18.2
Table 6: Represents the comparison between branch and risk factors of cervical cancer.
Variable
Risk Factors Of Cervical Cancer
Total Smoking
Weakened immune system
Family history
All of the above
Branch Technical 71 66 30 23 190
Medical associates
33 29 13 35 110
Total 104 95 43 58 300
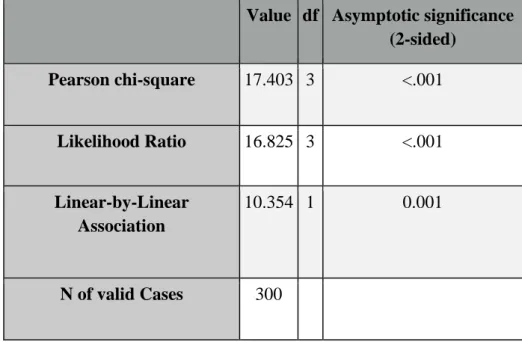
Table 6a: Represents the statistical value by chi square analysis for comparison between branch and risk factors of cervical cancer and the P-value is statistically significant. (P<0.01).
Value df Asymptotic significance (2-sided)
Pearson chi-square 17.403 3 <.001
Likelihood Ratio 16.825 3 <.001
Linear-by-Linear Association
10.354 1 0.001
N of valid Cases 300
Table 7: Represents the comparison between branch and family history of cervical cancer.
The chi-square result is statistically insignificant. (P>0.05) Count
Family History
Total Aware Not aware
Branch Technical 52 138 190
Medical field associated 40 70 110
Total 92 208 300
Table 7a: Represents the statistical value by chi square analysis by comparison between branch and family history of cervical cancer.
Value df Asymptotic significance (2-sided)
Exact Sig (2- 2- sided)
Exact sig (1- Sided)
Pearson chi-square 2.651 1 0.130
Continuity correction 2.245 1 0.134
Likelihood Ratio 2.621 1 0.105
Fisher’s Exact Test 0.119 0.068
Linear-by-Linear Association
2.642 1 0.104
N of valid Cases 300
Table 8: This table shows the relationship between branch and knowledge on screening(P>0.05)
Count
Knowledge Screening Total Agree Disagree
Branch Technical 110 80 190
Medical associated 48 62 110
Total 158 142 300
Table 8a: Represents the statistical value by chi square analysis for relationship between branch and knowledge on screening
Value df Asymptotic significance (2-sided)
Exact Sig (2- 2- sided)
Exact sig (1- Sided)
Pearson chi-square 5.681 1 0.017
Continuity correction 5.124 1 0.024
Likelihood Ratio 5.690 1 0.017
Fisher’s Exact Test 0.022 0.012
Linear-by-Linear Association
5.663 1 0.017
N of valid Cases 300
Table 9: Represents the comparison between a branch and cervical cancer prevention (P>0.05)
Count
cervical cancer prevention knowledge Total
Agree Dis agree
Branch Technical 102 86 188
Medical associated 52 58 110
Total 154 144 298
Table 9a: Represents the statistical value by chi square analysis by comparison between a branch and cervical cancer prevention
Value df Asymptotic significance (2-sided)
Exact Sig (2-2- sidedd)
Exact sig (1- Sided)
Pearson chi-square 1.355 1 0.244
Continuity correction 1.090 1 0.297
Likelihood Ratio 1.355 1 0.244
Fisher’s Exact Test 0.280 0.148
Linear-by-Linear Association
1.350 1 0.245
N of valid Cases 299
Fig. 1: Represents the distribution of age among females and students in universities. 13-20 age grp (12.6%), 21-28 (85.8%) and 29-38 (1.6%). The X axis represents the variable count
and Y axis represents the age frequency ±1 SD
Fig. 2: Represents the comparison of respondents between the technical students and the medical field associated students X axis represents count and Y axis represents Branch of the
study ±1 SD
Fig. 3: Bar chart represents the comparison between the branch and the risk factors of cervical cancer (P<0.01 chi-square analysis). The deviation shows technical students have more knowledge than medical associated students. X-axis technical vs medical associated
students Y-axis count ± 1 SD.
Fig. 4: Bar chart represents the comparison between the branch and family history of cervical cancer (P>0.05 chi-square analysis is statistically insignificant). The deviation shows
technical students have more knowledge than medical associated students. X-axis technical vs medical associated students Y-axis count ± 1SD.
Fig. 5: This bar chart represents the relation between branch and knowledge of screening are significantly different. (P>0.05 chi-square analysis). The deviation shows technical students
have more knowledge than medical associated students. X-axis technical vs medical associated students Y-axis count ± 1SD.
Fig. 6: Bar chart represents the comparison between the branch and knowledge on cervical cancer prevention. This data is statistically insignificant. (P>0.05 chi-square analysis). The deviation shows technical students have more knowledge than medical associated students.
X-axis technical vs medical associated students Y-axis count ± 1SD.
Table 1 Distribution of age among females and students in universities between the ages of 13 to 38. A total of 300 participants responded.
AGE FREQUENCY PERCENTAGE
13-20 40 12.6
21-28 258 85.8
29-38 5 1.6
Table 2 Comparison between both technical students and medical field associate students in universities.
BRANCH FREQUENCY PERCENTAGE
Technical 190 62.8 Medical field
associated 110 37.2
Total 300 100
Table 3 Depicts the list of questions used in the survey related to experience and knowledge on ovarian cancer among female students in universities. The virulence of ovarian cancer was
very evident to most of the participants (60.6%).
VARIABLE
Percentage of population who are
aware(%)
Percentage of population who are not
aware (%) Women who typically experience
symptoms of ovarian cancer are
diagnosed late 176 (60%) 117 (39.9%)
The majority of ovarian cancer
diagnosed late 173 (58.9%) 121 (41.2%)
Ovarian cancer can occur at any age,
even in childhood 160 (55%) 131 (45%)
Some early symptoms of ovarian cancer
may be recognized 177 (60.6%) 115 (39.4%)
Most ovarian cysts are cancerous 152 (52.3%) 139 (47.7%)
Students have shown an approximate 40% reduction in mortality screening for
ovarian cancer 186 (63.7%) 106 (36.3%)
Genes are responsible for some cases of
ovarian cancer 174 (59.4%) 119 (40.6%)
Table 4 Represents the knowledge on ovarian cancer between the technical and medical associated students. 41.4% of the student population was well aware of this fact.
VARIABLE FREQUENCY PERCENTAGE
Where does ovarian cancer can occur 1.on tissue within the ovary 2.on the surface of the ovary
3.in egg forming germ cell within the ovary 4.any of the above
55 92 93 54
18.7%
31.3%
31.6%
18.4%
Risk for developing ovarian cancer 1.women who had multiple children
2.women who are underweight 3.women over the age of 30
4.any of the above
65 99 70 58
22.3%
33.9%
24%
19.9%
In how many stages ovarian cancer is classified depending upon the extent of spread
1.2 2.3 3.4 4.5
77 120
73 21
26.5%
41.2%
25.1%
7.2%
Usually, the first treatment for ovarian cancer is 1.surgery
2.chemotherapy 3.radiation 4.any of the above
53 119
75 45
18%
40.5%
25.5%
16%
Risk factors for ovarian cancer 1.young age
2.null parity 3.multiple pregnancies
4.use of oral pills
55 99 96 42
18.8%
33.9%
32.9%
14.4%
Symptoms uncommon in ovarian cancer 1.abdominal pain
2.chest pain 3.weight loss 4.abdominal digestion
96 123
54 20
32.8%
42%
18.4%
6.8%
Staging of ovarian cancer 1.stage 3 disease 2.stage 1 tumors 3.stage 4 disease
120 134 36
41.4%
46.2%
12.4%
In metastatic epithelial ovarian cancer 1.ascites
2.bowel obstruction 3.opioid analgesics
4.lymphedema
62 184
28 15
21.3%
63.2%
9.6%
21.3%
The most type of ovarian cancer 1.epithelial tumor
2.germ cell tumor 3.sex chord tumor 4.Kruckenberg cancer
50 81 106
54
17.2%
27.8%
36.4%
18.6%
Out of 100 women, how many will probably develop ovarian cancer
1.2 2.5 3.10 4.22
38 108 116 28
13.1%
37.2%
40%
9.7%
Table 5a Represents the comparison between branch and risk factors of ovarian cancer.
Count
Risk Factors Of Ovarian Cancer Total
Young age
Null parity
Multiple pregnancies
prolonged use of oral contraceptive pills
Branch Technical 40 64 62 23 189
Medical field associated
22 35 34 19 110
Total 62 99 96 42 299
Table 5b Represents the statistical value by chi-square analysis for comparison between branch and risk factors of ovarian cancer and the P-value is statistically insignificant.
(P>0.05).
Chi-Square Tests
Value df Asymptotic Significance (2-sided)
Pearson Chi-Square 1.500a 3 0.682
Likelihood Ratio 1.468 3 0.69
Linear-by-Linear Association 0.666 1 0.415
N of Valid Cases 299
a. 0 cells (0.0%) have an expected count of less than 5. The minimum expected count is 15.45.
Table 6a Represents the comparison between branch and knowledge on ovarian cysts.
Count
Attitude towards Ovarian Cysts Total Agree Disagree
Branch Technical 94 96 190
Medical field associated 58 52 110
Total 152 148 300
Table 6b Represents the statistical value by chi-square analysis for comparison between branch and knowledge on ovarian cysts and the P-value is statistically insignificant. (P>0.05).
Chi-Square Tests
Value df Asymptotic Significance (2-sided) Exact Sig. (2-sided) Exact Sig. (1-sided) Pearson Chi-Square .295a 1 0.587
Continuity Correction 0.179 1 0.672 Likelihood Ratio 0.295 1 0.587
Fisher's Exact Test 0.632 0.336
Linear-by-Linear Association 0.294 1 0.588 No of Valid Cases 300
a. 0 cells (0.0%) have an expected count of less than 5. The minimum expected count is 54.27.
b. Computed only for a 2x2 table
Fig. 1 Represents the distribution of age among females and students in universities. 13-20 age grp (12.6%), 21-28 (85.8%) and 29-38 (1.6%). The X-axis represents the variable count
and the Y-axis represents the age frequency ±1 SD
Fig. 2 Represents the comparison of respondents between the technical students and the medical field associated students X-axis represents count and Y-axis represents Branch of the
study ±1 SD
Fig. 3 Bar chart represents the comparison between the branch and the risk factors of ovarian cancer (P>0.05 chi-square analysis). The deviation shows technical students have more
knowledge than medical associated students. X-axis technical vs medical associated students Y-axis count ± 1 SD.
Fig. 4 Bar chart represents the comparison between the branch and knowledge on ovarian cysts (P>0.05 chi-square analysis is statistically insignificant). The deviation shows technical students have more knowledge than medical associated students. X-axis technical vs medical
associated students Y-axis count ± 1SD.
Tables and Figures for uterine cancer
Table 1: Distribution of age among females and students in universities between the ages of 13 to 38. A total of 300 participants responded. This table shows the age group of females.
AGE FREQUENCY PERCENTAGE
13-20 40 12.6
21-28 258 85.8
29-38 5 1.6
Table 2: Comparison between both technical students and medical field associate students in universities. This table shows technical students contribute 62.8% and medical field- associated students contribute 37.2%. The contribution of technical students is high compared
to medical field associate students.
BRANCH FREQUENCY PERCENTAGE
Technical 190 62.8
Medical associates 110 37.2
Total 300 100
Table 3: The list of questions used in the survey related to experience and knowledge on uterine cancer among female students in universities.
VARIABLE The population who
are aware (%)
The population who are not aware (%) Uterine cancer that forms in the inner lining of a
uterus is considered endometrial cancer
164(56.4%) 127(43.6%)
Is obesity increasing the risk for cancer of the uterus
145(50.2%) 144(49.8%) Is uterus cancer detected by a pap test 129(44.5%) 161(55.5%)
Is uterine cancer treatment affect the ability to conceive
119(41%) 171(59%)
Is endometrial cancer is twice as common in overweight
172(59.1%) 119(40.9%)
Is chemotherapy treatment uses anti-cancer drugs targeted to a specific location
194(66.7%) 97(33.3%)
Is staging used to determine the severity or extent of the cancer
102(35.1%) 189(64.9%) Most chemotherapy treatments are done in
repeated cycles of drug administration followed by a rest period
188(64.9%) 102(35.2%)
Hormone therapy is not used on uterine cancer cells that require another hormone for growth
180(62.5%) 108(37.5%)
Is endometrial cancer is a disease in which malignant cells form in the tissues of the
endometrium
124(42.6%) 167(57.4%)
Is endometrial cancer diagnosed early 132(45.4%) 159(54.6%)
Table 4: The knowledge on uterine cancer between the technical and medical associated students. 37.8% of the student population was well aware of this fact.
VARIABLE FREQUENC
Y
PERCENTAG E How can reduce the cancer of the uterus
1.maintaining a healthy weight 2.taking birth control pills 3.monitoring blood sugar levels
4.all of the above
36 87 106
60
12.5%
30.1%
36.7%
20.8%
How is uterus cancer diagnosed 1.pelvic examination
2.biopsy 3.CT scan 4.all of the above
33 69 104
33
11.3%
23.6%
29.5%
35.6%
The common surgical procedures to treat uterine cancer 1.hysterectomy
2.radial hysterectomy 3.lymphadenectomy
4.all the above
37 88 90 77
12.7%
30.1%
30.8%
26.4%
The common signs and symptoms of uterine cancer are 1.abdominal bleeding
2.vaginal discharge 3.pelvic pains 4.all the above
44 87 85 75
15.1%
29.9%
29.2%
25.8%
Exposure of endometrial tissue to estrogen made by the body may be caused by
1.never giving birth 2.menstruating early stage 3.menopause at a later stage
4.all the above
50 94 85 61
17.2%
32.4%
29.3%
21%
Risk factors for endometrial cancer 1.obesity
2.metabolic syndrome 3.type 2 diabetes
4.all the above
36 88 71 96
12.4%
30.2%
24.4%
33%
What are the following stages are used for endometrial cancer
1.stage 1,2 2.stage 3,4 3.both of them 4.none of the above
40 91 110
50
13.7%
31.3%
37.8%
17.2%
Endometrial cancer may be grouped for treatment as follows
1.low risk 2.high risk 3.both of them 4.none of the above
43 118 100 31
14.7%
40.4%
34.2%
10.6%
The symptoms of endometriosis may include 1.pelvic pain
2.painful intercourse 3.infertility 4.all the above
29 98 102
62
10%
33.7%
35.1%
21.3%
Table 5a: Comparison between technical and medical associated with risk factors of uterine cancer.
Variable
Symptoms Of Uterine Cancer
Total Vaginal
discharge
Abdominal vaginal bleeding
pelvic pains
All the above
Branch Technical 59 29 60 41 189
Medical field associated
28 15 25 41 109
Total 87 44 85 82 298
Table 5b: The statistical value by chi-square analysis for comparison between Technical and medical field associated students towards risk factors of uterine cancer and the P-value is
statistically significant. (P<0.05).
Chi-Square Tests
Value Asymptotic Significance (2-sided) df
Pearson Chi-Square 9.091a 3 0.028
Likelihood Ratio 8.933 3 0.03
Linear-by-Linear Association 4.066 1 0.044
N of Valid Cases 298
a. 0 cells (0.0%) have an expected count of less than 5. The minimum expected count is 16.09.
Table 6a: Comparison between technical and medical-associated towards knowledge on uterine cancer diagnosis.
Variable
Knowledgeonuteruscancerdiagnoised
Total Biopsy
Pelvic examination
CT scan
All of the above
Branch Technical 49 19 54 68 190
Medical field associated
28 14 32 36 110
Total 77 33 86 104 300
Table 6b: The statistical value by chi-square analysis for comparison between technical and medical associated knowledge on uterine cancer diagnosed and the P-value is statistically
insignificant.
Chi-Square Tests
Value Asymptotic Significance (2-sided) df
Pearson Chi-Square .673a 3 0.879
Likelihood Ratio 0.666 3 0.881
Linear-by-Linear Association 0.129 1 0.719
N of Valid Cases 300
a. 0 cells (0.0%) have an expected count of less than 5. The minimum expected count is 12.10.
Table 7a: Comparison between technical and medical field associated students with knowledge on uterine cancer detection by pap test.
Variable
knowledge on uterus cancer detection by a pap test
Total
Aware Not Aware
Branch Technical 90 100 190
Medical field associated
49 61 110
Total 139 161 300
Table 7b: The statistical value by chi-square analysis for comparison between Technical and medical associated towards knowledge on uterine cancer detection by pap test and the P-
value is statistically insignificant.
Chi-Square Tests
Value df
Asymptotic Significance (2- sided)
Exact Sig. (2-
sided) Exact Sig. (1-sided) Pearson Chi-Square .223a 1 0.637
Continuity Correction 0.124 1 0.725 Likelihood Ratio 0.223 1 0.636
Fisher's Exact Test 0.719 0.363
Linear-by-Linear Association
0.223 1 0.637
N of Valid Cases 300
a. 0 cells (0.0%) have an expected count of less than 5. The minimum expected count is 50.97.
b. Computed only for a 2x2 table
Fig. 1. Distribution of age among females and students in universities. 13-20 age grp (12.6%), 21-28 (85.8%) and 29-38 (1.6%). The X-axis represents the variable count and the
Y-axis represents the age frequency ±1 SD
Fig. 2. Comparison of respondents between the technical students and the medical field associated students X-axis represents count and Y-axis represents Branch of the study ±1 SD
Fig. 3. Comparison between the branch and the symptoms of uterine cancer (chi-square analysis). The deviation shows technical students have more knowledge than medical associated students. X-axis technical vs medical associated students Y-axis count ± 1 SD.
Fig. 4. Comparison between the branch and the knowledge of uterine cancer diagnosed (P>0.05 chi-square analysis). The deviation shows technical students have more knowledge
than medical associated students. X-axis technical vs medical associated students Y-axis count ± 1 SD.
Fig. 5. Comparison between the branch and the knowledge of uterine cancer detection by pap test (P>0.05 chi-square analysis). The deviation shows technical students have more knowledge than medical associated students. X-axis technical vs medical associated students
Y-axis count ± 1 SD.
Tables and figures for vaginal cancer
Table 1. Distribution of age among females and students in universities between the ages of 13 to 38. A total of 300 participants responded. This table shows the age group of females.
AGE FREQUENCY PERCENTAGE
13-20 40 12.6
21-28 258 85.8
29-38 5 1.6
Table 2. Comparison between both technical students and medical field associate students in universities. This table shows technical students contribute 62.8% and medical field- associated students contribute 37.2%. The contribution of technical students is high compared
to medical field associate students.
BRANCH FREQUENCY PERCENTAGE
Technical 190 62.8
Medical-associates 110 37.2
Total 300 100
Table 3. The list of questions used in the survey related to experience and knowledge on vaginal cancer among female technical and medical associated students in universities.
VARIABLE FREQUENCY PERCENTAGE
How many ways are there, that cancer spread in the body 1.2
2.3 3.4 4.5
47 100
94 50
16.2%
34.4%
32.3%
17.2%
How many types of standard treatments are used 1.2
2.3 3.4 4.5
66 139
66 20
22.7%
47.8%
22.7%
6.9%
Risk factors for vaginal cancer 1.tobacco use
2.sexual initiation 3.HPV 4.all the above
28 85 78 28
9.6%
29.2%
34.4%
26.8%
How many types of grades are given to cancers to provide prognostic information about the tumor
1.2 2.3 3.4 4.5
78 153
42 17
26.9%
52.8%
14.5%
5.9%
Table 4. The knowledge on vaginal cancer between the technical and medical associated students. 65.2% of the student population was well aware of this fact.
VARIABLE YES (%) NO (%)
Is cancer travels through the blood vessels to the other parts of the body
143(49%) 149(51%)
Is a cancer tumor forms in the lymph vessels 201(68.8%) 91(31.2%)
For reducing risk, the combinations of contraceptive pills are used for the treatment or not
189(65.2%) 101(34.8%)
Is biopsy remains the gold standard to diagnose vaginal cancer 171(58.6%) 121(41.4%)
Is targeted molecular analysis confirms an overall rate of oncogenic mutations
167(57.4%) 124(42.6%)
Table 5a. The comparison between technical and medical associated with risk factors of vaginal cancer.
Variables Count
Risk factors of vaginal cancer
Total Tobacco use Human papillomavirus
Branch Technical 86 104 190
Medical field associated 27 83 110
Total 113 187 300
Table 5b. The statistical value by chi-square analysis for comparison between technical and medical associated with risk factors of vaginal cancer and the P-value is statistically
significant. (P<0.01).
Chi-Square Tests
Value df
Asymptotic Significance (2- sided)
Exact Sig. (2-
sided) Exact Sig. (1-sided) Pearson Chi-Square 12.736a 1 0
Continuity Correction 11.869 1 0.001 Likelihood Ratio 13.154 1 0
Fisher's Exact Test 0 0
Linear-by-Linear Association
12.693 1 0
N of Valid Cases 300
a. 0 cells (0.0%) have an expected count of less than 5. The minimum expected count is 41.43.
b. Computed only for a 2x2 table
Table 6a. The comparison between technical and medical associated with knowledge on vaginal cancer.
Variables Count
Knowledge on vaginal cancer Total Aware Not Aware
Branch Technical 111 78 189
Medical field associated 67 43 110
Total 178 121 299
Table 6b. The statistical value by chi-square analysis for comparison between technical and medical associated with knowledge on vaginal cancer and the P-value is statistically
insignificant.
Chi-Square Tests
Value df
Asymptotic Significance (2- sided)
Exact Sig. (2-
sided) Exact Sig. (1-sided) Pearson Chi-Square .137a 1 0.711
Continuity Correction 0.062 1 0.804 Likelihood Ratio 0.137 1 0.711
Fisher's Exact Test 0.807 0.403
Linear-by-Linear Association
0.137 1 0.712
N of Valid Cases 299
a. 0 cells (0.0%) have expected count less than 5. The minimum expected count is 44.52.
b. Computed only for a 2x2 table
Fig. 1. The distribution of age among females and students in universities. 13-20 age grp (12.6%), 21-28 (85.8%) and 29-38 (1.6%). The X axis represents the variable count and Y
axis represents the age frequency ±1 SD.
Fig. 2. The comparison of respondents between the technical students and the medical field associated students X axis represents count and Y axis represents Branch of the study ±1 SD.
Fig. 3. Comparison between the branch and the risk factors of vaginal cancer (P<0.01 chi- square analysis). The deviation shows technical students have more knowledge than medical
associated students. X-axis technical vs medical associated students Y-axis count ± 1 SD.
Fig. 4. Comparison between the branch and knowledge on ovarian cysts (P>0.05 chi-square analysis is statistically insignificant). The deviation shows technical students have more knowledge than medical associated students. X-axis technical vs medical associated students
Y-axis count ± 1SD.
4. Conclusion
The study suggests the awareness and innovative knowledge, specifically for cervical cancer among women students, was found to be extremely low. Lack of cancer awareness with high feminine stigma towards gynecological cancers is the most potent barrier and should be addressed through multifaceted innovative strategies-based interventions. Comparative Innovative analysis of technical and medical field associated students' suggested Innovative parameters towards knowledge, awareness, perspective risk factors, and medical screening programs for gynecological cancer.
DECLARATIONS:
Conflict of interests
No conflict of interest in this manuscript.
Authors Contribution
Author RH was involved in data collection and manuscript writing. Author MAAA was involved in conceptualization, data validation, and critical review of the manuscript.
References
1. Akkuzu, G., S. Talas, and B. Erdogan. 2012. “66 An Evaluation of the Functional Status of Women With a Diagnosis of Gynaecological Oncological Disease.”
European Journal of Oncology Nursing. https://doi.org/10.1016/s1462- 3889(12)70080-7.
2. Aref-Adib, Mehrnoosh, and Theresa Freeman-Wang. 2014. “Human Papillomavirus and Cervical Cytology.” Recent Advances in Obstetrics and Gynaecology 25.
https://doi.org/10.5005/jp/books/12313_10.
3. Chaka, Bekele, Abdul-Rauf Sayed, Bridgette Goeieman, and Sarah Rayne. 2018. “A Survey of Knowledge and Attitudes Relating to Cervical and Breast Cancer among Women in Ethiopia.” BMC Public Health. https://doi.org/10.1186/s12889-018-5958- 8.
4. Chandrasekar, Raghavan, Shyamala Chandrasekhar, K. K. Shantha Sundari, and Poornima Ravi. 2020. “Development and Validation of a Formula for Objective Assessment of Cervical Vertebral Bone Age.” Progress in Orthodontics 21 (1): 38.
5. Efared, Boubacar, Ibrahim S. Sidibé, Fatimazahra Erregad, Nawal Hammas, Laila Chbani, and Hinde El Fatemi. 2019. “Extra-Uterine Low Grade Endometrioid Stromal Sarcoma Arising from Ovarian Endometriosis: A Case Report and Review of the Literature.” Gynecologic Oncology Research and Practice 6 (January): 2.
6. Ezhilarasan, Devaraj, Velluru S. Apoorva, and Nandhigam Ashok Vardhan. 2019.
“Syzygium Cumini Extract Induced Reactive Oxygen Species-Mediated Apoptosis in Human Oral Squamous Carcinoma Cells.” Journal of Oral Pathology & Medicine:
Official Publication of the International Association of Oral Pathologists and the American Academy of Oral Pathology 48 (2): 115–21.
7. Getahun, Frehiwot, Fekadu Mazengia, Mulunesh Abuhay, and Zelalem Birhanu.
2013. “Comprehensive Knowledge about Cervical Cancer Is Low among Women in Northwest Ethiopia.” BMC Cancer 13 (January): 2.
8. Govindaraju, Lavanya, Ganesh Jeevanandan, and Emg Subramanian. 2017. “Clinical Evaluation of Quality of Obturation and Instrumentation Time Using Two Modified Rotary File Systems with Manual Instrumentation in Primary Teeth.” Journal of Clinical and Diagnostic Research: JCDR 11 (9): ZC55–58.
9. Hailu, Alemayehu, and Damen Haile Mariam. 2013. “Patient Side Cost and Its Predictors for Cervical Cancer in Ethiopia: A Cross Sectional Hospital Based Study.”
BMC Cancer. https://doi.org/10.1186/1471-2407-13-69.
10. Janani, Krishnamachari, Ajitha Palanivelu, and Raghu Sandhya. 2020. “Diagnostic Accuracy of Dental Pulse Oximeter with Customized Sensor Holder, Thermal Test and Electric Pulp Test for the Evaluation of Pulp Vitality: An in Vivo Study.”
Brazilian Dental Science 23 (1). https://doi.org/10.14295/bds.2020.v23i1.1805.
11. Jeevanandan, Ganesh. 2017. “Kedo-S Paediatric Rotary Files for Root Canal Preparation in Primary Teeth - Case Report.” Journal of Clinical and Diagnostic Research: JCDR 11 (3): ZR03–05.
12. Jose, Jerry, Ajitha, and Haripriya Subbaiyan. 2020. “Different Treatment Modalities Followed by Dental Practitioners for Ellis Class 2 Fracture – A Questionnaire-Based Survey.” The Open Dentistry Journal 14 (1): 59–65.
13. Kashyap, Nainakshi, Nadiya Krishnan, Sukhpal Kaur, and Sandhya Ghai. 2019. “Risk Factors of Cervical Cancer: A Case-Control Study.” Asia-Pacific Journal of Oncology Nursing 6 (3): 308–14.
14. Kasting, Monica L., Shannon Wilson, Terrell W. Zollinger, Brian E. Dixon, Nathan W. Stupiansky, and Gregory D. Zimet. 2017. “Differences in Cervical Cancer Screening Knowledge, Practices, and Beliefs: An Examination of Survey Responses.”
Preventive Medicine Reports 5 (March): 169–74.
15. Kumar, Dhinesh, and S. Delphine Priscilla Antony. 2018. “Calcified Canal and Negotiation-A Review.” Journal of Advanced Pharmaceutical Technology &
Research 11 (8): 3727.
16. Manikandan, Saranya, Subasish Behera, Nageswaraomadhulika Naidu, Vignesswary Angamuthu, Omarfarooq Burhanuddin Mohammed, and Abhitosh Debata. 2019.
“Knowledge and Awareness toward Cervical Cancer Screening and Prevention among the Professional College Female Students.” Journal of Pharmacy And Bioallied Sciences. https://doi.org/10.4103/jpbs.jpbs_21_19.
17. Marimuthu, Madhulaxmi, Manoharan Andiappan, Abdul Wahab, M. R. Muthusekhar, Anandan Balakrishnan, and Sambandham Shanmugam. 2018. “Canonical Wnt Pathway Gene Expression and Their Clinical Correlation in Oral Squamous Cell Carcinoma.” Indian Journal of Dental Research: Official Publication of Indian Society for Dental Research 29 (3): 291–97.
18. Mathew, Mebin George, S. R. Samuel, Ashu Jagdish Soni, and Korishettar Basavaraj Roopa. 2020. “Evaluation of Adhesion of Streptococcus Mutans, Plaque Accumulation on Zirconia and Stainless Steel Crowns, and Surrounding Gingival Inflammation in Primary Molars: Randomized Controlled Trial.” Clinical Oral Investigations, 1–6.
19. McTiernan, Anne, Melinda Irwin, and Vivian VonGruenigen. 2010. “Weight, Physical Activity, Diet, and Prognosis in Breast and Gynecologic Cancers.” Journal of Clinical Oncology. https://doi.org/10.1200/jco.2010.27.9752.
20. Mitiku, Israel, and Fasika Tefera. 2016. “Knowledge about Cervical Cancer and Associated Factors among 15-49 Year Old Women in Dessie Town, Northeast Ethiopia.” PloS One 11 (9): e0163136.
21. Ng’ang'a, Anne, Mary Nyangasi, Nancy G. Nkonge, Eunice Gathitu, Joseph Kibachio, Peter Gichangi, Richard G. Wamai, and Catherine Kyobutungi. 2018.
“Predictors of Cervical Cancer Screening among Kenyan Women: Results of a Nested Case-Control Study in a Nationally Representative Survey.” BMC Public Health 18 (Suppl 3): 1221.
22. Nyengidiki, Tamunomie K. 2015. “Screening Methods for Gynaecological Cancers.”
Contemporary Gynecologic Practice. https://doi.org/10.5772/58947.
23. Patil, Sandeep B., D. Durairaj, G. Suresh Kumar, D. Karthikeyan, and D. Pradeep.
2017. “Comparison of Extended Nasolabial Flap Versus Buccal Fat Pad Graft in the