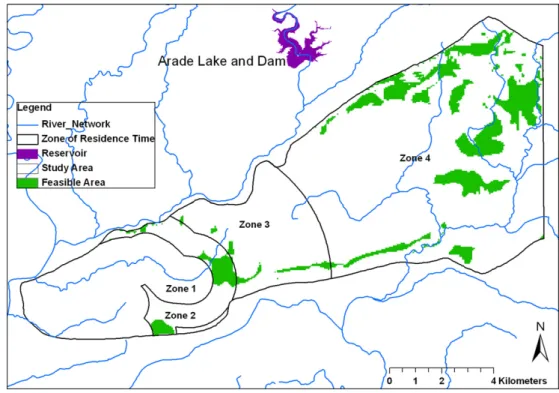
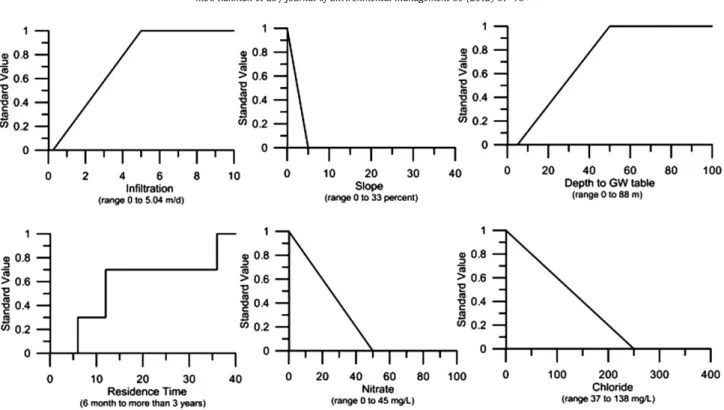
When a¼1 (linguistic quantifier is categorized as "half of the criteria meet"), the results give the full trade-off (WLC) (Fig. 3). These are average values using the average rainfall values in the area, therefore the recharge is also much lower when the rainfall is much less (eg the hydrological year when the rainfall was more than half of the average).

Author's personal copy
Current trends and future challenges in groundwater
General concepts for groundwater vulnerability assessment
Concepts and Methods for Vulnerability Assessment The concept of aquifer vulnerability mainly includes two specific concepts: intrinsic vulnerability and specific vulnerability. European specialists of COST Action 620 “vulnerability and risk mapping for the protection of carbonate (karst) aquifers”, agreed that intrinsic vulnerability is a “term used to define the vulnerability of groundwater to pollutants”. by human activities”, taking into account “the inherent geological, hydrological and hydrogeological characteristics of an area”, but “independent of the nature of the pollutants”. Rather, the notion of specific vulnerability is used “to define the vulnerability of groundwater to a particular pollutant or group of pollutants”, taking into account “the properties of the pollutant and their relationship to the various components of intrinsic vulnerability ”.
Vulnerability assessment considering only the soil and unsaturated zone without considering transport processes within the saturated zone. In this case, the assessment is limited to the relative probability that the pollutant concentrations of concern will reach the saturated zone. Many classic vulnerability methods are based on this approach: the GOD method (Foster 1987), the Irish approach (Daly and Drew 1999) or the AVI method (Van Stempvoort and others 1993).
An approach based on the delineation of protection zones for groundwater supply systems, where groundwater flow and contaminant transport processes within the saturated zone are considered to some extent (including dispersion transport, as practiced in the Walloon region of Belgium, Derouane and Dassargues 1998). . Based on these different approaches, different groundwater vulnerability assessment methods have been developed. This paper only discusses the current methods used to assess groundwater vulnerability.
Current trends in vulnerability assessment using overlay and
Three main parameters are taken into account: the presence of groundwater, the lithology of the upper layers and the depth of the groundwater (in closed or confined conditions). The vulnerability index (Figure 1) is the result of the values assigned to these three parameters. In the special case where two parameters have a value equal to 1, the vulnerability score is equal to the score of the third parameter.
This method considers the following seven parameters: depth to water, net recharge, aquifer media, soil media, topography, vadose zone influence, and hydraulic conductivity. Estimates of aquifer media and vadose zone are subjective and may vary for a given region. ISIS is a hybrid method, based on the comparative assessment of existing hydrogeological situations.
EPIK method was specifically created for the vulnerability assessment of the karst aquifers (Doerfliger and Zwahlen 1997) in Switzerland. One of the few cases where an attempt was made to compare methods was by an Italian research team. To determine the vulnerability of the aquifer in this area, four methods were tested: DRASTIC, SINTACS, GOD and the AVI model.
Future challenges in groundwater vulnerability assessment
A sensitivity analysis to evaluate the influence of a single parameter on the assessment of aquifer vulnerability was carried out on the same “Piana Campana” region by Napolitano and Fabbri (1996). Comparing SINTACS and DRASTIC methods, they observed that removing each of the seven parameters one by one created relevant and significant. To determine circumstances where properties of the intermediate vadose zone are critical for vulnerability assessment and to develop methods to characterize this zone with more accuracy.
A better quantification of the physical and chemical processes taking place in this zone and the relationship with other important factors affecting vulnerability will contribute to better results of the assessment process. Establish unified models that incorporate soil data and geological data into vulnerability assessment models. This correlation should be carried out by integrating information related to potential pollutants (for example, industrial activity, traffic parameters of highways, etc.) and data on the indirect impact of human activities (artificial drainage created by agricultural activities).
They mostly include a comprehensive description of the physical, chemical and biological processes that affect groundwater vulnerability, they require extensive data sets, which are often not available. Furthermore, based on the Representative Elementary Volume (REV) concept, these models simulate the flow and transport processes at the spatial scale of the selected REV. One of the most important future challenges for hydrogeology is to establish the conceptual and operational basis for combining vulnerability methods and the results of process-based models.
Conclusions
To define more meaningful categories of vulnerability and to determine which processes are most important to include in vulnerability assessment at different spatial scales. Create tools to combine data obtained at different spatial and temporal scales into a common vulnerability assessment scale. To find useful benchmarking techniques and procedures for evaluating assessment methods and groundwater quality monitoring data.
For example, some overlay and index methods attempted to address contamination (which may occur at wells and boreholes) by mapping these properties in combination with results derived from other assessment methods. To improve analytical tools in GIS software for effective integration of assessment methods with spatial at-. Process-based simulation models are used to predict groundwater flow and contaminant transport in both space and time.
This should be achieved, first at the theoretical level and later as a complex expert tool that can combine data from spatial databases, vulnerability methods and process-based and statistical models into an integrated assessment concept. To meet such a challenge, it will be necessary to use the results of the numerical model in order to provide parameter values in the vulnerability assessment analysis (for DRASTIC: hydraulic conductivity, aquifer media, vadose zone influence, recharge of the aquifer). This work was supported by the OSI/HESP Research Support Scheme (RSS), grant no.
Integrated studies of active volcanic systems for the purpose of long-term monitoring and prediction and short-term eruption prediction require a large number of data sets from different disciplines. A modern database concept has been developed for the management and analysis of multidisciplinary volcanological datasets. The GEOWARN project (choosing "Kos-Yali-Nisyros-Tilos volcanic field, Greece" and "Campi Flegrei, Italy" as test sites) is oriented towards potentially active volcanoes located in regions of high geodynamic disturbance.
This article describes the volcanological database of the spatial and temporal data acquired within the GEOWARN project. The database schema includes various information layers containing geographic data (e.g. seabed and land elevation model, satellite images, man-made structures, land use), geophysical data (e.g. from active and passive seismicity, gravity, tomography, SAR interferometry, thermal images , differential GPS), geological data (e.g. lithology, structural geology, oceanography) and geochemical data (e.g. from hydrothermal fluid chemistry and diffuse degassing features). As a second step based on the presented database, spatial data analysis has been performed using specially programmed interfaces that execute query scripts, resulting in a graphical visualization of data.
These search tools are designed and constructed according to scenarios of known "behaviors" of dormant volcanoes and first possible signs of potential unrest. The spatial database and query approach is intended to facilitate scientific research on volcanic processes and phenomena and volcanic surveillance. The main goal of the GEOWARN project funded by Europe was to develop a multimedia-based geospatial warning system (a modular web-based system).
ARTICLE IN PRESS
A simplified version of the database layers and its content for the Kos-Yali-Nisyros-Tilos volcanic field is shown in Table 1. 9 Gravity Location of gravimetric stations + measurement points on land and sea Grid of interpolated gravity. This group provides information on the geophysical campaigns carried out within the Kos-Yali-Nisyros-Tilos volcanic field in 1997 and 2000 as part of the GEOWARN project.
In the case of the GEO-WARN early warning system, the national Greek reference system (HGRS 87) was used for the pilot site in Greece. As a result, the relationship between the calculated hypocenters and the subsurface tomographic model has been generated (Fig. 5). It shows an approximate view of the apparent CO2 flux distribution of the southern part of the Nisyros caldera.
By using the entire set of geographic data and having the described tools available ''at the click of a mouse'', the user is able to get a complete overview of the entire dataset. Changes, updates or further developments of the scheme are expected to be incorporated in the future. The database design is the result of input, discussions and corrections from the GEOWARN consortium (www.geowarn.org).

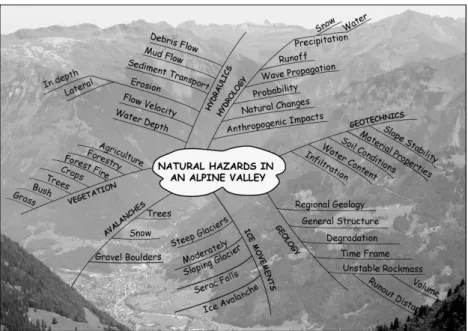
Web Based Information System for Natural Hazard Analysis in an Alpine Valley
- Database Concept Design
- Development of Integrated Natural Hazard Assessment Methods
- Web Based Information System for Natural Hazard Analysis In order to create appropriate hazard analysis tools, an initial step was to
- Technical Implementation Concept of HazTool
The conception and development of a web-based information system for the analysis of natural hazards is carried out at the Institute of Cartography of the Swiss Federal Institute of Technology in Zurich (ETHZ). The importance of the research conducted for the development of HazTool is highlighted and the concept of the resulting technical implementation of HazTool is described (Sec. 2.4). The methods of quantifying risk parameters, as well as the uncertainty of these methods and of the data sets themselves, should be taken into account when designing the database concept.
The task was to create a data model that takes into account the specifics of natural disasters in Switzerland, and at the same time enables the research focus to be directed at the beginning of the project to the Alpine valleys. The experience gained during a similar project carried out at the Institute of Cartography ETH Zurich (GEOWARN project, Hurni et al. 2004) influenced the design of the database concept. The ESRI ArcHydro data model needs to be adapted to the needs of the HazNETH project.
The needs of the various user groups with no to expert experience in the use of computer systems must be satisfied. The possibility to develop custom applications for natural hazard, as well as the good reputation of the product, and the ease of use and administration made the ESRI software more attractive. Its results can also be transferred to mountainous areas in general where similar problems with natural hazards are encountered (eg the Himalayas and the Andes).