In the presented scientific work, qualitative characteristics of typical modern prognostic models of dangerous hydrological phenomena, based on the most common scenarios of climate change, are analyzed. At the end of the paper, the main conclusions and some recommendations are given on improving forecasting models and reducing the damage caused by potential floods.
Introduction
- Objective
- Tasks
- Relevance of the topic
- The novelty of the research work
- State of the Art
- Flood emergency decision support systems
- Flood types
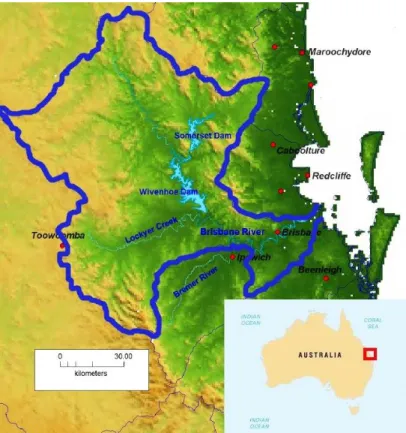
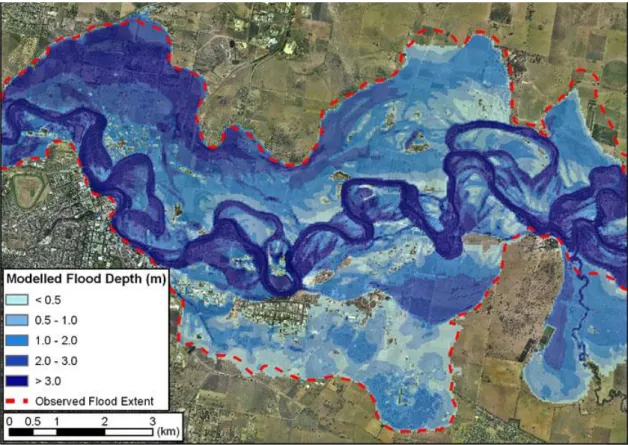
- Features of occurrence and prediction of flood events in Australia
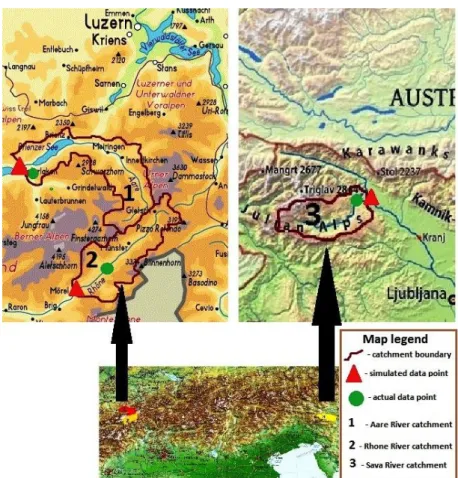
- Features of occurrence and prediction of flood events in Alpine region
The basis of the system is the LISFLOOD hydrological model, which describes the flow from the catchment and the current in the river bed system. Components of the Total Flood Warning System (Australian Emergency Manual Series, Manual 21 Flood Warning, Australian Government 2009).
Material and methods
Short characteristics of the study areas
- Catchments in the Alps
- Catchments in Australia
It falls downstream from the Triglav Lakes Valley and flows into the lake as part of Sava Bohinjka. The watercourse flows 41 kilometers (25 miles) – including the length of the Savica – east to Radovljica, where it flows into the Sava Dolinka.
Main flood forecasting methods
- Scenarios of climate change developed by the IPCC
- Comparison of hydrometeorological forecasts for the studied basins
The output of the models includes representations of predicted flood levels and the predicted speed of water discharge. To study prognostic models in the Alpine region, the resource capabilities of the online HYPE system were used. The calculations took into account changes in two of the four scenarios (RCP 4.5 and RCP 8.5) of climate change developed by the Intergovernmental Panel on Climate Change (IPCC), an organization created to assess the risk of global determine climate change caused by man-made factors (human actions).
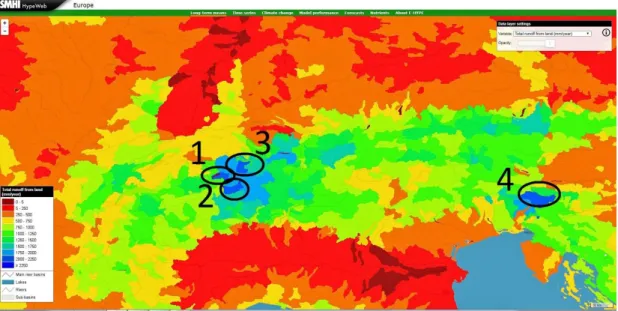
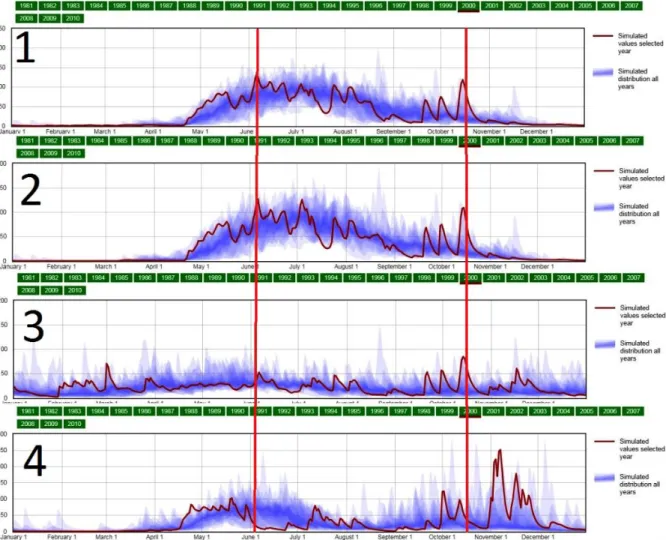
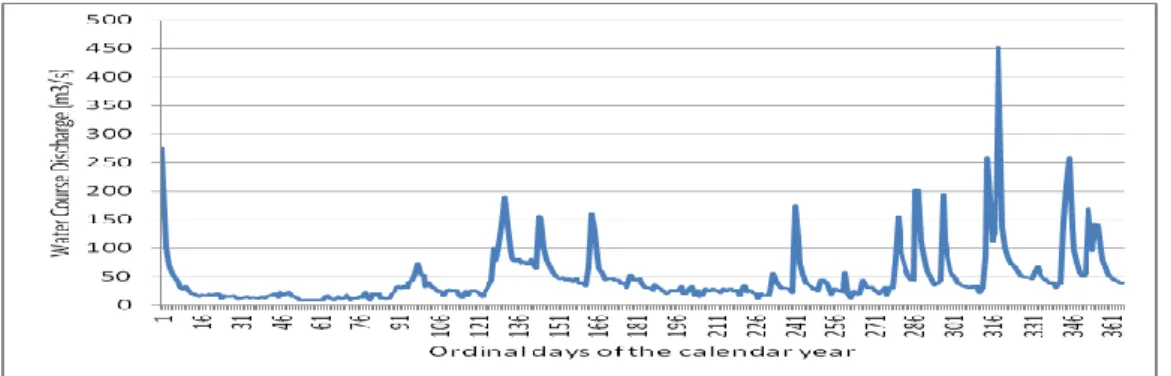
It is because of the difference in the temperature growth charts in the scenarios that there are differences in all the others. As a result of the calculations, the highest total overland runoff (mm/year) of 4 basins was identified using data from the Hydrological Predictions for the Environment (HYPE) Region database and a marked correlation with volume. The first peak is usually associated with the beginning of snowmelt at high altitudes in the mountains and is observed in early June.
The coincidence of many indicators in the first three basins is explained by the close geographical location of the objects to each other. Despite the difference in the exposure of the slopes and the variety of topography of the areas, there is approximately the same amount of precipitation and almost identical to the daily ones.
Results
- Analysis of the differences in physico-geographical characteristics of flood
- Comparison modeled and measured data
- Correlation between flood forecasting and socio-economic impacts
- Comparison of the forecast scenarios
- Climate change impacts on mountain floods
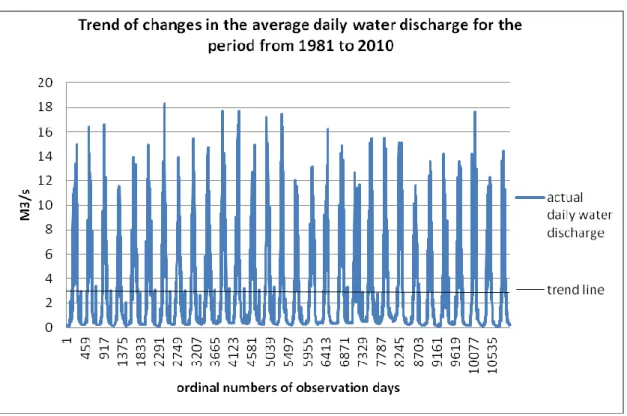
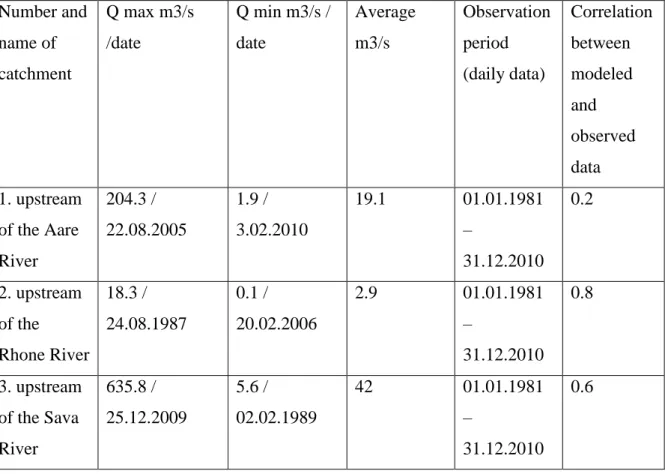
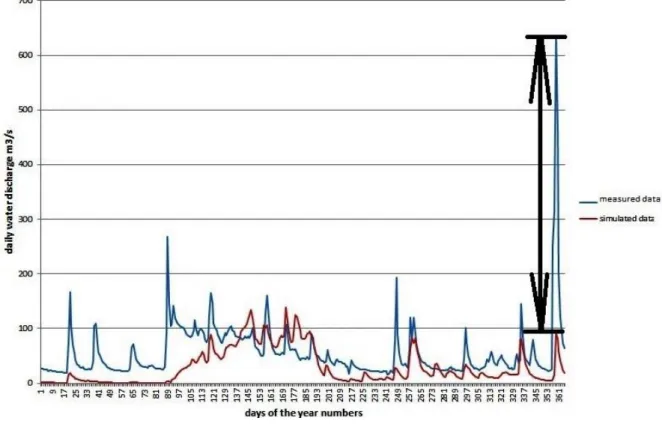
Despite the general tendency to increase the contrast of the climate and, in connection with this, the increase in the risk of flash floods, the scenarios or Sava river flow, daily data for the observed period from January 1 to December 31, 1982. Based on the comparison of daily flow data for the period from 1981 to 2010, the maximum and minimum daily values for the three studied river basins were identified in the Excel program.
Large water discharge differences are noted in the upper reaches of the Aare Å 204 and 2 m3/s, which with a low correlation between the simulated data and the measured data (0.2) can create a threat of unpredictable floods. Despite the relatively low maximum water discharge (18 m3/s) and the good correlation between the simulated and measured data (0.8) in the Rhône basin, floods causing significant material damage were repeatedly observed. Due to the comparison and analysis of the simulated and measured water discharge data for the three catchments, significant inaccuracies in the simulated data were identified (Tables 1, 2 in Appendix).
However, in the areas studied, the floods were not so severe and the Rhône valley was not affected at all. In the upper reaches of the Melkaa River, direct interlevel dependence is again observed with simulated flood days data, and there is no strong correlation on the monthly average (Figure 22 in the Appendix). Compare the simulated river discharge and the total damage costs in the upper parts of the Aare å.
The simulated change in the amount of river discharge according to the scenarios of RCP 4.5 and RCP 8.5 during the periods 2030, 2050 and 2080.
Discusions
Recommendations for reducing flood damage
That is why in almost every megalopolis of the world meteorologists note an increase in the intensity of precipitation and its amount in the warm season - constant thermal rising flow in combination with a mechanical rise when air is overcome by tall urban buildings and the growing content of aerosols over the city when fuel (condensation nucleus) is burned. If we want to achieve the opposite effect, in the case of cities, emphasis should be placed on the light surfaces of buildings and roads to reduce heating due to solar radiation, increase the number of green spaces and water bodies to a maximum, abandon internal combustion engines and industrial facilities within the city. In the case of natural objects, everything is a little more complicated, but the same mechanism of cloud development works.
If there are no external reasons for the increasing precipitation in the valley, then this is probably the cause of the provocation of cloud precipitation during the mechanical ascent of air masses. It is necessary to take into account in a complex way the entire landscape, both within the studied area and outside it, then it is possible to achieve a significant decrease in the intensity of atmospheric precipitation and thus reduce the risk of flooding Reduce. It can only protect some of the most important areas, but will not change the weather in the entire region.
In addition, the possibility of such adaptation of the microclimate of individual areas can play a key role in the organization of new recreation zones with a more favorable microclimate for recreation than in the surrounding area. Discussions of the differences in the prognosis in different scenarios Continue with the development of the idea of increasing contrast, the changes in the total river.
Discussions of the differences in the prognosis in different scenarios
If the rocky surface will be cold at night and can cause the descending air currents, during the day due to solar radiation it will act exactly the opposite, and this may bring an increase in intense precipitation during the day in the study area. This situation can be explained by a regular increase in evaporation due to an increase in average temperature and the possible depletion of snow and glacier reserves in the upper reaches of the rivers. Analysis of changes in the water equivalent of snow in the future in two scenarios shows a primary increase in the indicators, and then a rapid decrease.
Only for the relatively drier Julian Alps, both scenarios predict an initial and continuous decrease in snow water equivalent from 1-5% in the 2030s to 10-25% in the 2080s. The water equivalent of snow in the studied basins on the territory of Switzerland will increase by 5-10% in 2030 in both scenarios compared to the present. However, according to the soft scenario (4.5), the water equivalent of snow will remain above the present and in the 2050s, and only in the 2080s will it decrease by 10-25% of the present.
Comparing the total forecast plots of total discharge from the surface, a clear correlation is observed with both the amount of precipitation and the volume of river discharge. For the three studied catchments in the Swiss Alps, the forecast for all periods for both scenarios is 10-25% of the initial increase.
Optimization of water resources management for flood forecasting
Despite a long-term knowledge of regional weather and precipitation accumulation patterns in the Swiss Alps, a non-exhaustive sampling of rainfall with few gauges located at high altitudes is unable to effectively capture short-term, catchment-scale, orographic effects during flood events (when the steep slopes and relatively shallow groundwater depths typical of Alpine areas generate short response times) (Petrascheck, 1996). A sparse rain gauge network at upper elevations necessitates a proper quantification of the local precipitation-elevation relationship using an extensive description of. Moreover, the inability to correctly represent areal rainfall leads to notable failures of the subsequent models of the hydrological response, which are sensitive to input volumes at the catchment scale (Nicótina et al., 2008).
At reduced sub-catchment scales, rainfall variability also has an important influence on peak flows (Mandapaka et al., 2009). Furthermore, a limited number of temperature stations in the region does not allow correct definitions of snow/rain partitioning during floods. Accurate temperature fields are particularly important in mountainous regions because the combination of high temperatures producing snow/glacial melt or rain-on-snow processes can accelerate discharge production (Benestad and Haugen, 2007; Jasper et al., 2002; Sui and Koehler, 2001 ).
In the future, Australia's population continues to grow, putting increased pressure on our waterways, many of which already experience high levels of flood risk. Rising land prices and a consequent move to smaller block sizes are expected to result in cities becoming more densely populated, increasing the chance of urban flooding.
Conclusions
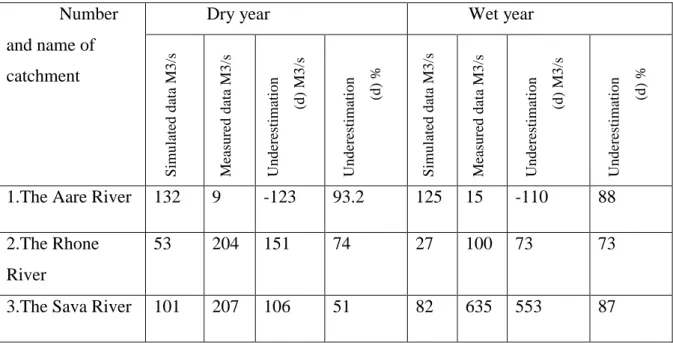
Daily water discharge graph in the upper part of the Rhone River. 1987 medium wet year with high floods (average water discharge 2.9 m3/s). Daily water discharge graph in the upper parts of the Sava River. 1987 medium wet year (average water discharge 49 m3/s). Daily water discharge graph in the upper reaches of the Sava River. 1989 dry year (average water discharge 36 m3/s).
Comparison of peak water discharge in the basins studied in 2005 (data provided by hypeweb.smhi.se). Comparison of peak water discharge in the studied basins in 2010 (data provided by hypeweb.smhi.se). Comparison between simulated river discharge and total damage costs upstream of the Rhone River.
Comparison between the simulated river discharge and total damage costs in the upper reaches of Melhaa River. The simulated change in the amount of atmospheric precipitation according to the scenarios of the RCP 4.5 and RCP 8.5 during the periods of the 2030s 2050s and 2080s. The simulated change in the snow water equivalent according to the scenarios of the RCP 4.5 and RCP 8.5 during the periods of the 2030s 2050s and 2080s.
Comparison between simulated river discharge and total damage costs upstream of the Melhaa River.