In the master's thesis, the influence of the type of business model on the operational efficiency of air carriers is analyzed through service factors. The aim of the research is to evaluate the impact of different business models through service factors on the efficiency of air carriers. Does the impact of service factors on an airline's operational performance depend on the airline's business model.
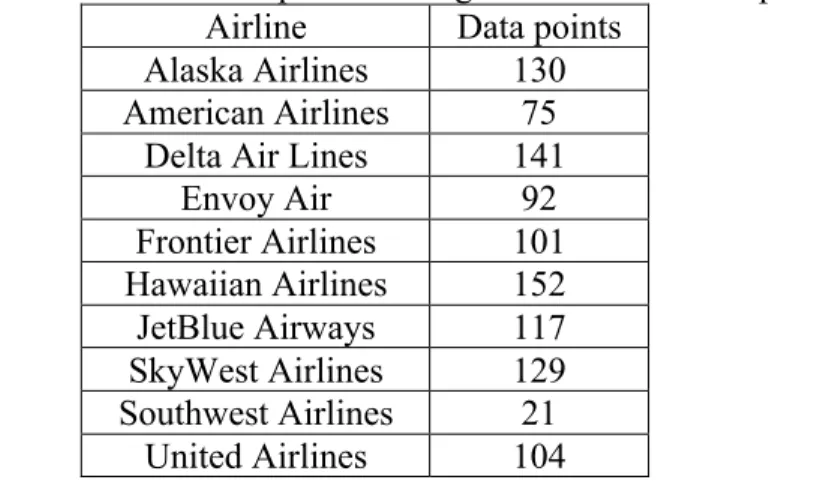
The subject of the study is the 10 largest American airlines, which represent different business models.
BUSINESS-MODELS AND SERVICE FACTORS IN
The literature review on business-model concept for airline industry
- Full-service Carriers
- Low-cost Carriers
- Hybrid Carriers
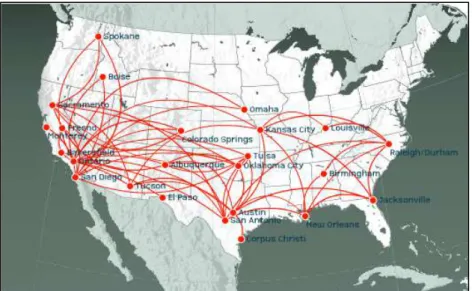
Currently, the fans of the business model of Southwest Airlines can be met in Europe (Ryanair, easyJet), Canada (WestJet), South America (Gol Transportes Aéreos), Australia and New Zealand (Jetstar) and Asia (Air Asia). , Vanilla Air). Low cost airlines evaluate each of the routes only based on the profit they make. 2015) Empirical Analysis of the characteristics of the code sharing agreements and their effects on the business model of. low.
Pereira and Caetano (2015) Conceptual development of the concept of airline business model type definition.
Service factors
In the work Lohmann & Koo (2013) the focus is on 9 large American Airlines, and the study allows to determine the full specter of used business models. This structure is then used to describe the changes that have taken place in the business models of 5 German airlines in the last 2 years. Analysis of these factors can provide the new insights in terms of understanding the position of the airline in the market.
As the competition in the aviation industry increases, it has become increasingly necessary to provide high quality services and value creation (Chen et al., 2011).
Conclusion
Gilbert & Wong, 2003) identified the dimensions of reliability, security, facilities, employees, flight patterns, customization and responsiveness as components of airline service quality. Chang & Yeh, 2002) emphasized the importance of reservation and ticketing processes in assessing airline service quality. Jin, 1998) put forward safety records, ticket price, in-cabin food/drink and potential delay time as service quality criteria that are effective in airline selection.
Elliott & Roach, 1993) used schedule accuracy, baggage handling, food quality, cabin comfort, quality of check-in service and in-flight entertainment and service to define airline service quality.
STUDY OF AIR CARRIERS OPERATIONAL PERFORMANCE
- Service Quality Measurement
- Operational performance and Data Envelopment Analysis
- Research design
- Stage 1. Assessment of operational performance
- Stage 2. Assessment of service performance
- Conclusion
For this work, the trend for the fundamental DEA model is supported – the input-oriented BCC model is used. Number of seats [on [0; 1] scale] – the seat occupancy rate during the period, calculated as revenue passenger miles divided by available seat miles. AV system [in number] - number of flights delayed due to problems with the national aviation system.
Late arrival [in number] – the number of delayed flights due to late arrival of an aircraft.

EMPIRICAL STUDY OF US AIR CARRIERS IN 2005-2018
The object of the study and empirical data
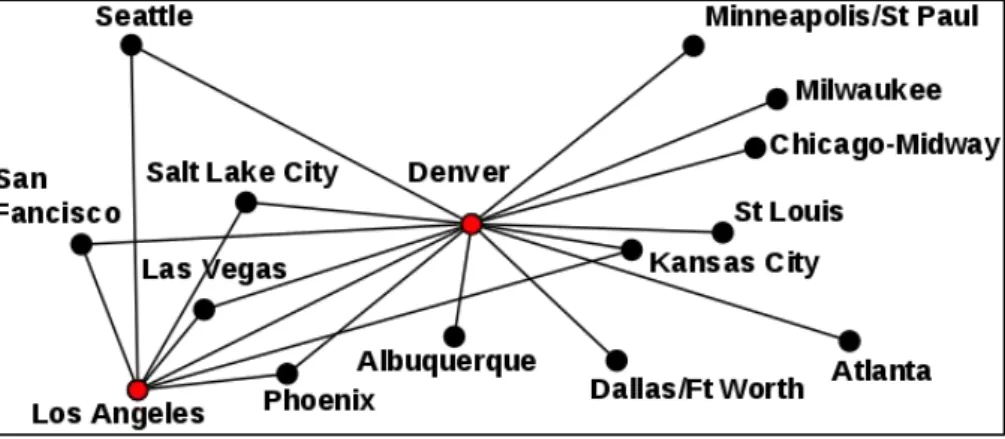
It is the largest airline in the world in terms of total passenger kilometers, passenger fleet size, revenue, passenger traffic and number of destinations served. American Airlines, 2020) American Airlines is a founding member of the Oneworld Alliance, the third largest aviation alliance in the world and coordinates fares, services and schedules with alliance partners British Airways, Iberia and Finnair in the transatlantic transport market and with Cathay Pacific and Japan Airlines across the Pacific Ocean. The company's ten hubs are located in Dallas/Fort Worth, Charlotte/Douglas, Chicago/O'Hara, Philadelphia, Miami, Phoenix/Skye Harbor, Washington/National, Los Angeles, New York/Kennedy and New York/La Guardia airports.
It is the third largest airline in the world in terms of total passenger-kilometres, passenger fleet size, revenue, passenger traffic and number of destinations served. United Airlines is a founding member of Star Alliance, the world's second largest aviation alliance, which includes carriers such as Lufthansa Group, Singapore Airlines, Thai Airways and many others. The airline operates primarily in the United States, the Caribbean and Mexico, as well as the Bahamas and Bermuda.
The company is not part of any airline alliance, but has codeshare agreements with 21 carriers from Star Alliance, Oneworld and SkyTeam, as well as non-affiliated members. Alaska Airlines has historically become the largest carrier of the US West Coast and the state of Alaska with a strong route network in Seattle, Portland, the San Francisco Bay Area and the greater Los Angeles area, with the airline serving all major airports in each of the nine metropolitan areas in the last two areas. (Alaska Airlines, 2020) Alaska Airlines is not part of any airline, but has partner agreements with many airlines from the three major airlines. Mileage Plan Alaska Airlines loyalty program terms and conditions apply to flights by Delta Air Lines, Korean Air, Air France/KLM of the SkyTeam alliance, American Airlines, British Airways, Cathay Pacific and Qantas of the Oneworld alliance and others.
The vast majority of SkyWest's contracts are fixed fees, with partner airlines paying a set amount for each flight operated, regardless of the number of passengers carried. American Airlines, 2007) With over 1000 flights per day, serving 150 cities across the United States, Canada, Mexico and the Caribbean, Envoy is considered one of the world's largest regional airline systems.
Results of the operational performance analysis
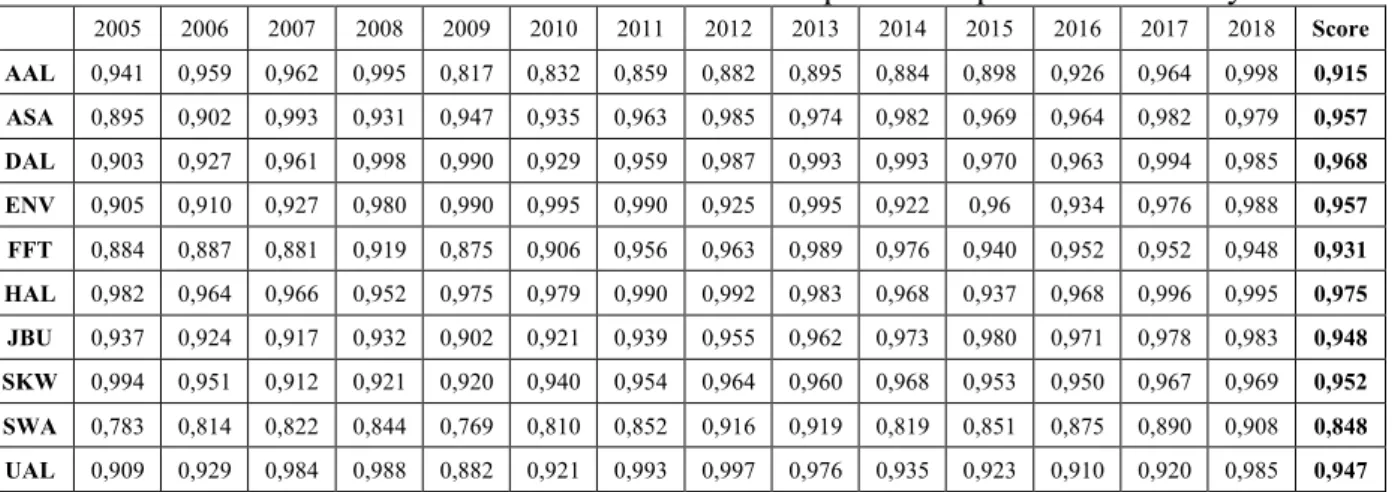
At first glance, the operating performance results of the airlines appear to be generally quite close with scores around 0.9. The numbers are close to 1 and to each other due to the high competitiveness of airline industry. Thus, even small differences between operational performance of airlines make sense, and it is necessary to take these differences into account.
Initially, it is necessary to point out that operational performance results can really describe the situation as it is. At the same time, the difference for full-service airlines is 0.053 (the difference between Delta Air Lines and American Airlines), and for low-cost carriers it is 0.109 (the difference between Envoy Air and Southwest Airlines). The second thing to mention is the low operating result of Southwest Airlines, the pioneer of the low-cost business models, the largest airline with unified fleet.
This seems quite surprising, because from common sense this airline should have one of the highest operational results. In 2014, the rebranding process increased the maintenance costs of the airline, and it took several years to recover. Overall, operational performance of US airlines in the period from 2005 to 2018 remains at the high level with various disadvantages for various airlines caused by crisis situations, bankruptcies or mergers and acquisitions.
The impact of poor operational performance can therefore be reduced, and the impact of service can be clearly seen. Therefore, out of 1620 data points used for the operational performance analysis, only 1062 will be used for the assessment of service performance - the "Champions League" data set.
Results of the operational performance analysis with service factors included
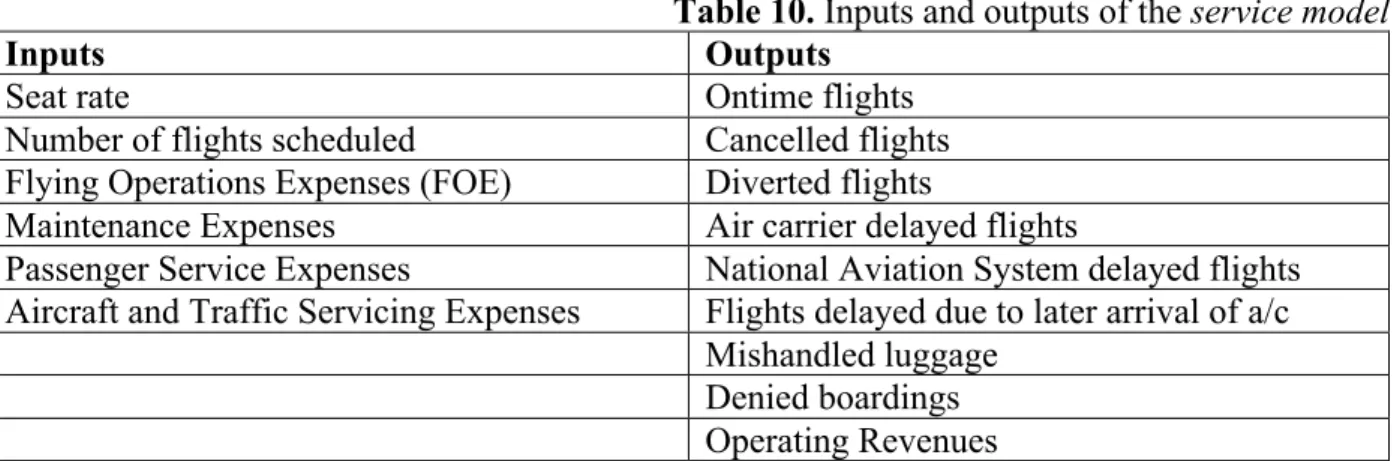
It is an expansion of operational performance that includes several additional parameters that measure the quality of an airline's services. Table 10 lists the inputs and outputs of the Airline Service Performance Survey. However, with high results, we can only claim that the quality of airline services is also high during a period of good business.
According to statistics, this happens more often with full-service airlines, where it affects their service quality performance. Hybrid airlines typically don't offer many options—the bare essentials—so they don't need to spend money on status-only options like full-service airlines do. This research is the first bridge between three major areas of research: airline operational performance, airline business models and airline service quality.
As this thesis is the first work that has merged two major topics of the aviation management research field – operational performance and service quality – there is room for further research in this area. An important-performance analysis to evaluate airline service quality: the case study of a low-cost airline in Asia. Low-cost carrier competition and route access in a nascent but regulated aviation market – the case of China.
A hybrid approach based on fuzzy AHP and fuzzy 2-tuple linguistic method for in-flight service quality assessment. Investigating the effects of service quality on airline image and behavioral intentions: findings from Australian international air passengers.
Abbreviations used in the text and Appendix 1
34;diverted" flight is a flight operated from the scheduled point of origin to a point other than the scheduled point of destination in the carrier's published schedule. The cause of the delay was due to circumstances within the airline's control (eg .maintenance or crew problems) , etc.) Delays attributable to the national aviation system refer to a wide set of conditions - non-extreme weather conditions, airport operations, heavy traffic volume, air traffic control, etc.
A “cancelled” flight is a flight that did not operate but was listed in the airline's computer reservation system within seven days of its scheduled departure. A “diverted” flight is a flight operated from the scheduled departure point to a point other than the scheduled destination point on the airline's published schedule. The cause of the delay was due to circumstances within the airline's control (e.g. maintenance or crew issues, etc.).
Delays attributable to the national aviation system cover a wide range of circumstances – non-extreme weather conditions, airport operations, heavy traffic, air traffic control, etc. Denied boarding [in number] – the number of passengers who voluntarily gave up their flight seat or were involuntarily bumped into an oversold flight in exchange for compensation from the reporting airline.
The initial data set