Пастухова А.С., Чубарова Н.Е., Смышляев С.П., Галин В.Я..125 Исследование основных режимов естественной изменчивости в модели климата Института вычислительной математики РАН. Титов А.Г..146 Разработка параллельного многосеточного эллиптического решателя задач для глобальной атмосферной ПЛАВ.
NUMERICAL TEST
SIMULATION RESULTS
Momentum
Impact on the dispersion of a passive tracer
Тенденция оценок средней скорости ветра на уровне 10 м в зависимости от заблаговременности очень схожа во все сезоны для всех версий COSMO. Анализ «общих» графиков показывает, что оценки COSMO-Ru находятся на хорошем уровне по сравнению с версиями модели COSMO из других стран.
INTRODUCTION
Institut for Computational Mathematics and Mathematical Geophysics SB RAS, Novosibirsk, Rusland E-mail: yudin@ommfao.sscc.ru.
MODEL FORMULATION
NUMERICAL EXPERIMENTS
CONCLUSION
Оценки прогнозов по экспериментам с разными исходными данными для областей приземной температуры (а), точки росы (б), скорости ветра (в) для 165 станций ЦФО модели COSMO-Ru07. Анализ и прогноз оперативной метеорологической модели Российского гидрометцентра COSMO-Ru7 в настоящее время используются в качестве граничных и начальных условий при расчете метеорологических полей в COSMO-Ru7-ART.
Tolstykh M.A
It should also be mentioned that the SL-AV model tends to exaggerate the perturbations of the polar vortex after predicted day 10. In the cases when the polar vortex perturbs and then stabilizes, SL-AV model is likely to predict minor SSW.
ВВЕДЕНИЕ
1 shows that some of the anomaly correlation curves of forecasts started 10-12 days before the small SSW showed local maxima at the time the small SSW occurred. This means that the situation of strong polar vortex disturbances is favorable for the accuracy of the predictions.
ПОСТАНОВКА ЭКСПЕРИМЕНТА И РЕЗУЛЬТАТЫ
Корреляция аномалий высоты изобариче- ской поверхности 10 гПа в прогнозах по модели
ЗАКЛЮЧЕНИЕ
Направление (линии тока) и скорость (заливка) ветра на поверхности 10 гПа во
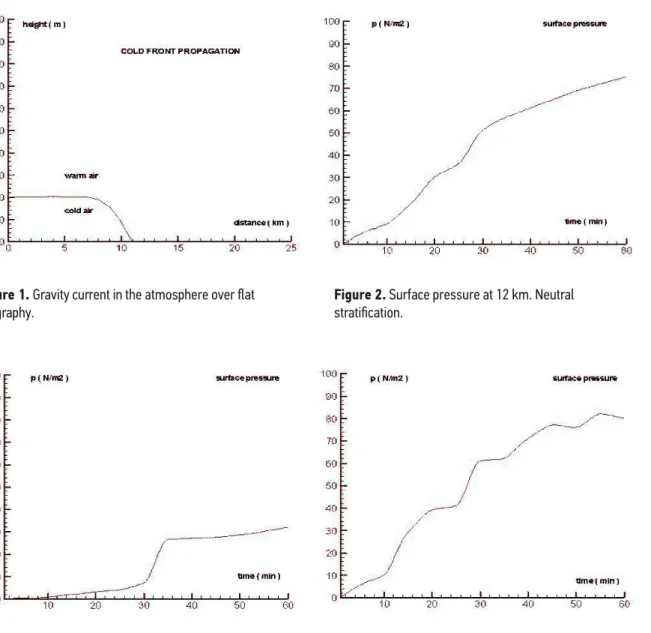
Modeling cloud cells in the atmosphere over the Black Sea during the cold air invasion. We conducted a case study of cold air invasion in winter in the Black Sea region in January 2010.
ХАРАКТЕРНЫЙ СЛУЧАЙ ХОЛОДНОГО ВТОРЖЕНИЯ 25 ЯНВАРЯ 2010 Г
It is based on the finite difference discretization of the Navier-Stokes equations in the Boussinesq approximation on a rectangular grid. Semenov, Foundations of dynamics and monitoring of the White Sea (doctoral thesis) (in Russian), Moscow, 2004, p.
Моделирование
В настоящем отчете представлены первые результаты применения этих подходов к схеме ЭОР земной поверхности ИВМ РАН. В то же время концентрация углекислого газа в верхнем перемешанном слое и, соответственно, поступление этого газа в атмосферу рассчитываются менее успешно (Степаненко и др., 2016). Куиваярви (Финляндия) из Хельсинкского университета за последние годы (включая периоды заморозков) (Миеттинен и др., 2015).
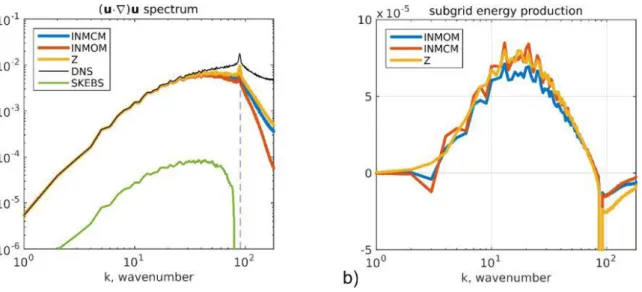
We use stochastic autoregressive parameterizations for the energy backscatter with the energy generation spectrum (see e.g. Fig. 1a), obtained from DNS and taking into account the numerical scheme of the coarse model.
ОПИСАНИЕ МОДЕЛИ
Показано, что использование крупномасштабной стохастической силы, моделирующей взаимодействие «подсетки» и разрешенных гармоник, позволяет существенно улучшить динамику грубой модели в области обратного энергетического каскада. Центрально-разностная аппроксимация адвективного члена второго порядка (u▼u) по анимально-симметричной схеме на разбитой решетке C (в терминологии Аракавы) сохраняет численный аналог энергии. 2) INMCM, используемый в модели INMCM.
АПРИОРНЫЕ ТЕСТЫ
Центрально-разностная аппроксимация второго порядка адвективного члена J(ψ,ω) по антеросимметричной схеме сохраняет численный аналог энстрофии. 2) CCS, использованная в модели ПЛАВ.
ЧИСЛЕННЫЕ ЭКСПЕРИМЕНТЫ
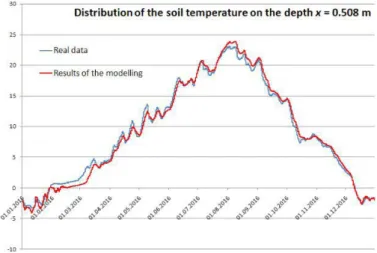
The interactions between land and the atmosphere are an important part of Earth system modeling. The reproduction of the temperature regime, moisture circulation regime and humidity dynamics in the soil is an important problem for further research. Observational data of the main meteorological variables (air temperature, humidity, precipitation, wind speed and direction, pressure) obtained at weather stations [10] were used.
It was concluded that the temperature of deep layers in the permafrost zone can be calculated with significant errors in the climate model, which does not significantly affect the quality of the regional climate simulation because the surface temperature is much better calculated.
КРАТКОЕ ОПИСАНИЕ МОДЕЛИ И ИСПОЛЬЗУЕМЫХ ДАННЫХ
РЕЗУЛЬТАТЫ
Среднемесячные значения температуры
- ЧИСЛЕННОЕ МОДЕЛИРОВАНИЕ РАСПРЕДЕЛЕНИЯ ТЕМПЕРАТУРЫ В ГРУНТЕ НА РЕАЛЬНЫХ ДАННЫХ
- ПАРАМЕТРИЗАЦИЯ СНЕЖНОГО ПОКРОВА ISBA-ES
- РЕЗУЛЬТАТЫ МОДЕЛИРОВАНИЯ
Assimilation of screen-level parameters for deep soil moisture in the global medium-range weather forecast model SL-AV. The optimal interpolation (OI) method is used to initialize the soil moisture fields in the operational version of the SL-AV model. A simplified two-dimensional variational analysis of soil moisture from screen-level observations in a mesoscale numerical weather prediction model.
Root zone soil moisture from the assimilation of screen level variables and remotely sensed soil moisture.- Journal of geophysical research, 2011, vol.
Modeling
Моделирование
Here we want to demonstrate the reality of the stair pattern using various measurements and climate parameters. UAH MSU v5.6 and RSS MSUv3.3 – two satellite datasets measuring lower troposphere temperature (TLT). These many different sources confirm the reality of the regime-shift trap structure of recent warming, which is masked by short-term ENSO variability and the effects of volcanic eruptions.
The warming amplitude of the analyzed data sets did not change significantly after the adjustment, but the shape changed significantly.

МЕТОДЫ
In addition, global and hemispheric averaging can lead to a flattening of the response of the climate system to external natural factors. In the area of maximum positive and negative temperatures, moment saturation close to the value of 0.8 occurs in all months. The models are found to reproduce global spatial structures of near-surface temperature and GAO sea level pressure anomalies that closely resemble these fields in the reanalyses considered.
However, the power spectra of the ENSO and GAO indices from the CMIP5 models do not show any peaks at the same periods as the reanalysis power spectra.
МАТЕРИАЛЫ НАБЛЮДЕНИЙ И МЕТОДИКА ИХ ОБРАБОТКИ
Все глобальные поля средней амплитуды колебаний ДУМ и ТВП при ГАО и энергетические спектры показателей, рассчитанные по данным измерений и реанализов, сравнивались с соответствующими полями и спектрами, полученными аналогичным образом по результатам исторических исследований. эксперимент за период 1850-2005 гг. для 47 связанных моделей общей циркуляции океана и атмосферы, доступных на сегодняшний день в рамках проекта CMIP5. Для этих климатических моделей поля и спектры рассчитывались описанным выше методом на основе результатов эксперимента piControl, в котором, в отличие от Исторического эксперимента, отсутствует внешнее воздействие.
ОБСУЖДЕНИЕ РЕЗУЛЬТАТОВ АНАЛИЗА
The investigation materials were old data of 19 meteorological observatories of the Central Non-Black Earth Zone. This phase showed that the most important physical parameters of the model are the ionization velocity and the neutral temperature. The diurnal evolution of electron concentrations at different latitudes was also investigated by changing photoionization.
However, when individual seasons of the year are taken into account, the role of natural factors increases significantly.
МЕТОДИКА РАБОТЫ
Получить модельные оценки содержания озона, мутности и суммарной коротковолновой радиации у поверхности Земли с помощью ИВМ-РГГМУ ХКМ за период 1979-2015 гг. Температура поверхности моря и площадь ледяного покрова установлены по результатам реанализа Метеорологического бюро Хэдли-центра с 1979 по 2015 год. Валидация полученных значений проводилась с использованием данных спутниковых приборов TOMS и OMI, поскольку они являются длительные временные ряды измерений (с 1979 года по настоящее время), а алгоритмы этих приборов обеспечивают единообразие получаемых данных.
Значения годовых трендов облачного пропускания эритемного УФИ (а), отклонений УФИ за счет озона по сценарию с учетом всех факторов (б), суммарных отклонений УФИ (в), рассчитанных за период с 1979 по 2015 гг.
ВЫВОДЫ
The first EOF of the temperature anomaly at latitude 84.75˚S is shown on the graph (Figure 3). The most extensive snow cover is formed in the Siberian part of the Eurasian continent. It is obvious that the surface of the October snow cover can significantly influence the formation of processes that determine the state of the climate system in the following winter.
They are respectively located in the zone of the Antarctic plateau and on the islands near the Antarctic Peninsula.
КЛИМАТ»
Gordov E P, Okladnikov I G, Titov A G, Bogomolov V Yu, Shulgina T M and Genina E Yu 2012 Geoinformation system for regional climate change investigation and first results obtained Atmos. Gordov E P, Shiklomanov A, Okladnikov I G, Prusevich A and Titov A G 2016 Development of Distributed Research Center for regional climate and environmental change analysis IOP Conf. Riazanova A A, Voropay N N, Okladnikov I G, Gordov E P 2016 Development of regional aridity calculation module for web-GIS “Climate” IOP Conf.
Gilleland E, Katz R W 2016 extRemes 2.0: An extreme value analysis package in R Journal of Statistical Software Volume 72, Issue 8.
Data
Данные
СИСТЕМА АНСАМБЛЕВОГО ПРОГНОЗА НА ОСНОВЕ LETKF И ПЛАВ
Development of the parallel multigrid elliptic problem solver for the SL-AV global atmospheric problem. We use a conditional semi-coarsening method [7] to account for the anisotropy of the regular lat-lon lattice near the poles. 1 shows the convergence rate of the new solver for the 2d problems with different grid size and different number of pre- and post-smoothing iterations.
The results of robust scaling tests of the new solver for two problem sizes are presented in Fig.
ПОСТАНОВКА ЗАДАЧИ И ОПИСАНИЕ АЛГОРИТМА РЕШЕНИЯ
СХОДИМОСТЬ АЛГОРИТМА
ПАРАЛЛЕЛЬНАЯ РЕАЛИЗАЦИЯ И МАСШТАБИРУЕМОСТЬ АЛГОРИТМА
ВНЕДРЕНИЕ В МОДЕЛЬ ПЛАВ
Alferov Yu.V
Using correlated observational errors in satellite AMV data for an ensemble data assimilation system based on the LETKF algorithm. It has previously been shown that the use of correlated data with a diagonal matrix R in data assimilation degrades the accuracy of the analysis. This requires the use of an off-diagonal observation error covariance matrix R in the data assimilation scheme.
It is shown that taking correlations in AMV observation errors into account in the data assimilation system reduces the errors of five-day forecasts calculated from the initial data of this system.
УСВОЕНИЕ ДАННЫХ НАБЛЮДЕНИЙ AMV
Второй причиной разработки метода анализа полей водного эквивалента и плотности снежного покрова с помощью COSMO-Ru является наличие существенных неточностей в исходных полях (полях первого приближения) SWE и SD, подаваемых в Росгидромет из глобального центра моделирования в Германии. , эти ошибки особенно заметны для регионов с продолжительной снежной зимой. До 2016 г. снежная глыба модели COSMO-Ru не была применима для качественного прогнозирования информации о современном состоянии ЮЗЕ и СД в период весеннего половодья для территорий с разреженной наблюдательной сетью. Кроме того, для получения исходной информации о состоянии снежного покрова используется система мезомасштабного гидродинамического моделирования COSMO-Ru (в частности, для анализа по разработанному методу используются поля первого приближения, поступающие из DWD).
График сравнения полевого материала со спутниковыми данными, моделью Космо-Ру и реальными данными сети Росгидромета для снегомерного маршрута в районе села Порог.
РЕЗУЛЬТАТЫ РАБОТЫ
В отличие от перистых, кучевые облака оказывают сильное влияние на потоки прямой солнечной радиации и могут как полностью ее пропускать (S = S0), так и не полностью пропускать (S = 0) (так называемый «триггерный эффект»). В отличие от вышеизложенных работ, облака предлагается изучать не только «путем пропускания», но и на предмет их способности переизлучать солнечную радиацию, т.е. Для описания таких свойств мутности используются ее временные актинометрические характеристики, которые описываются коэффициентами вариации прямого ВС и рассеянного ВД излучения в зависимости от частоты изменения минимаксных значений S и D за определенный короткий промежуток времени. (20-30 мин.) период.
Форму и степень облачности контролировали также по панорамным изображениям всего неба, полученным с помощью телевизионного измерителя характеристик облаков [6], установленного непосредственно на метеостанции «А Огурцово».
Семинар
Информационно-компьютерная веб-ГИС «Климат» (http://climate.climate.scert.ru) обеспечивает функционирование веб-ориентированного производственно-исследовательского центра в области изучения локальных изменений климата [Гордов и др., 2013]. . В настоящее время система содержит информационный курс открытого доступа по изменению климата, ориентированный на население и лиц, принимающих решения (http://climate.scert.ru/resources/courses/). А в августе и сентябре на западе и юго-востоке наблюдается повышение среднемесячных температур (0,4-0,8°С/10 лет), на остальной территории наблюдаются менее значительные тенденции (от -0,05 до 0,2°С). /10 лет).
Результаты исследования хорошо согласуются с выводами, сделанными ранее при анализе засух и периодов наводнений [Воропай и др., 2016].