Effects of long-term variations of solar wind parameters in near-Earth space. In this paper we use the simple 2D model of the turbulent electromagnetic field: particles move in the neutral plane of the Earth's magnetic tail.

INDICES OF HUMAN URINARY EXCRETION OF THIOL AND
UROCHROME IN THE ANTARCTIC AND THEIR CORRELATION TO COSMOGEOPHYSICAL FACTORS
The intradiurnal dynamics of fluctuations of Σsh, Csh, Σur and Cur for the entire period of the study and for the periods of polar night and polar day were also studied. For the first time, a screening analysis of the thiol content in urine was carried out during a long-term stay and work in extreme conditions in Antarctica (judging by the works known to us).
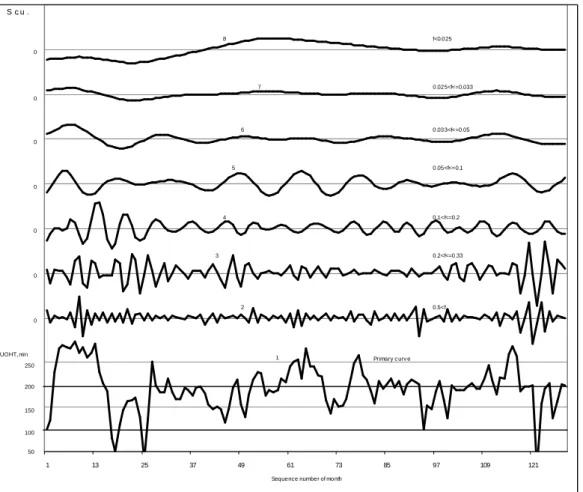
ON MANIFESTATION OF PERIODICAL DISTURBANCES OF INTERPLANETARY MEDIUM IN FLUCTUATIONS OF UNTIL
Introduction
Mesorhythms and circannian fluctuations in the dynamics of unithiol test results
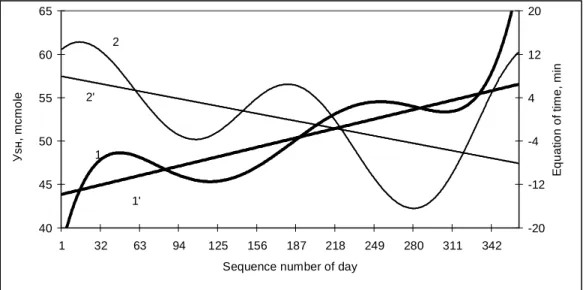
It is noted that the correlations between CF of UOHT and SA and between CF of UOHT and ET and EE are inverse, which indirectly proves that the highly cosmophysical factors, especially SA and ET, have physical interrelationships. Moreover, there is no observable direct relationship between CF of UOHT and SA variations, while the correlation between CF of UOHT and ET and EE appeared clearly modulated by changes in SA over the 21-year cycle.
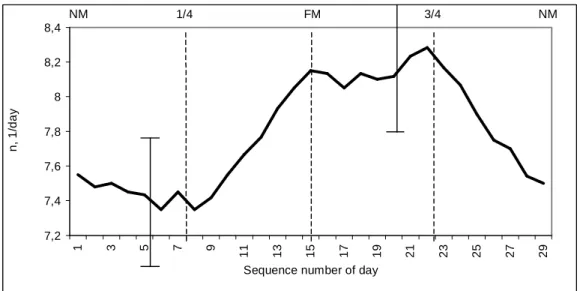
Cycles of planet interactions in the Solar system and fluctuations in unithiol test results
The search for extreme points for the correlation coefficients of UOHT and CI, SA and CI was carried out using the method of sequential phase shift (from 1 to 29 months forward and backward) of the CI of the corresponding planets. The correlation coefficients for UOHT, SA and CI of Mrc-Jup and Mar-Npt were found to differ in clearly defined waves.
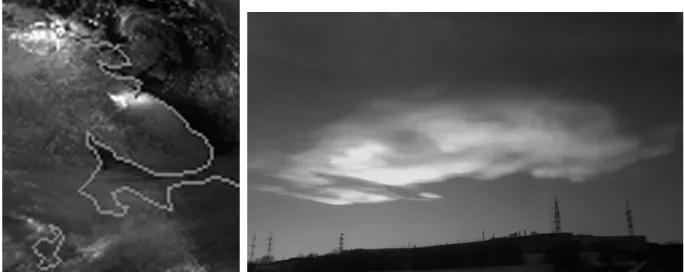
OBSERVATIONS OF POLAR STRATOSPHERIC CLOUDS OVER MURMANSK IN JANUARY-FEBRUARY 2010
Second, the influence of dynamical processes that take part in the stratosphere also affects the dynamics of the troposphere. TIME DEPENDENT MODELING OF THE INITIAL PHASE OF INTRATROPICAL CYCLONE FORMATION.

TIME-DEPENDENT MODELING OF THE INITIAL STAGE OF THE FORMATION OF CYCLONES IN THE INTRATROPICAL
CONVERGENCE ZONE OF THE NORTHERN HEMISPHERE
Time-dependent modeling of the initial phase of cyclone formation in the Northern Hemisphere intratropical convergence zone. The width of the intratropical convergence zone can reach several hundred kilometers.

10 YEARS INVESTIGATIONS OF THE SOLAR UV RADIATION AND TOTAL OZONE IN STARA ZAGORA, BULGARIA
The ratio between the intensity of the flux, reflected by the Earth, and the direct solar signal is used to calculate the total ozone content. The dependence analysis of the UV radiation on the sun zenith angle (SZA) at fixed total ozone shows a.

INFLUENCE OF HF POWERFUL WAVES ON THE OZONE CONTENT IN THE EARTH’S ATMOSPHERE
In the right panel, the spectra of the ozone emission intensities recorded under night (black line) and day (gray line) conditions are shown. The effect of the drop in ozone number density during atmospheric pumping is clearly visible.

ON THE CONNECTION BETWEEN VARIATIONS OF ATMOSPHERIC ELECTRIC FIELD AS MEASURED AT GROUND SURFACE IN THE
Fig.1 Diurnal curves of the thunderstorm part of the atmospheric electric field measured in Vostok st. 2 Daily curves of thunderstorms that are part of the atmospheric electric field for Antarctic summer and winter (left panel) and Carnegie curve (right panel).
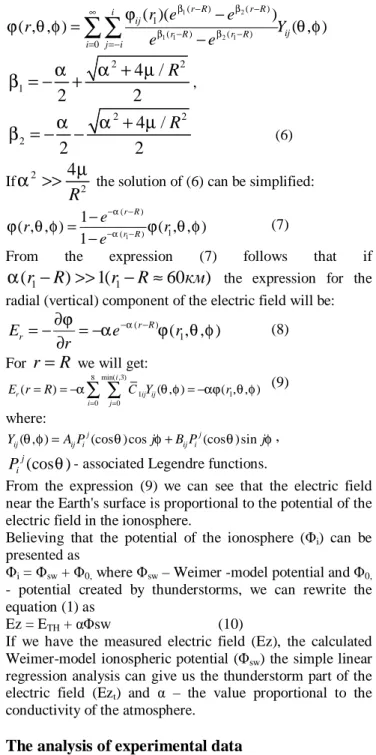
SUBSTORM EFFECTS IN THE POLAR LATITUDE ATMOSPHERIC ELECTRIC FIELD DISTURBANCES
Observations
The preliminary phase of this substorm was accompanied by the significant positive Ez anomalies at Hornsund. The late evening substorm was observed at ~ 19-20 UT on this day and it was accompanied by the negative Ez anomalies.
Discussion
It is clearly seen (Fig. 3) that every negative magnetic anomaly observed at HOR was accompanied by a simultaneous positive anomaly in atmospheric electric field (Ez) variations at that station. We speculate that the significant changes in the atmospheric electric field (Ez) at the Hornsund observatory observed during the development of magnetospheric substorms are due to the penetration of polar ionospheric convection electric fields (which are strengthened during the substorm) to the Earth's surface.
Conclusions
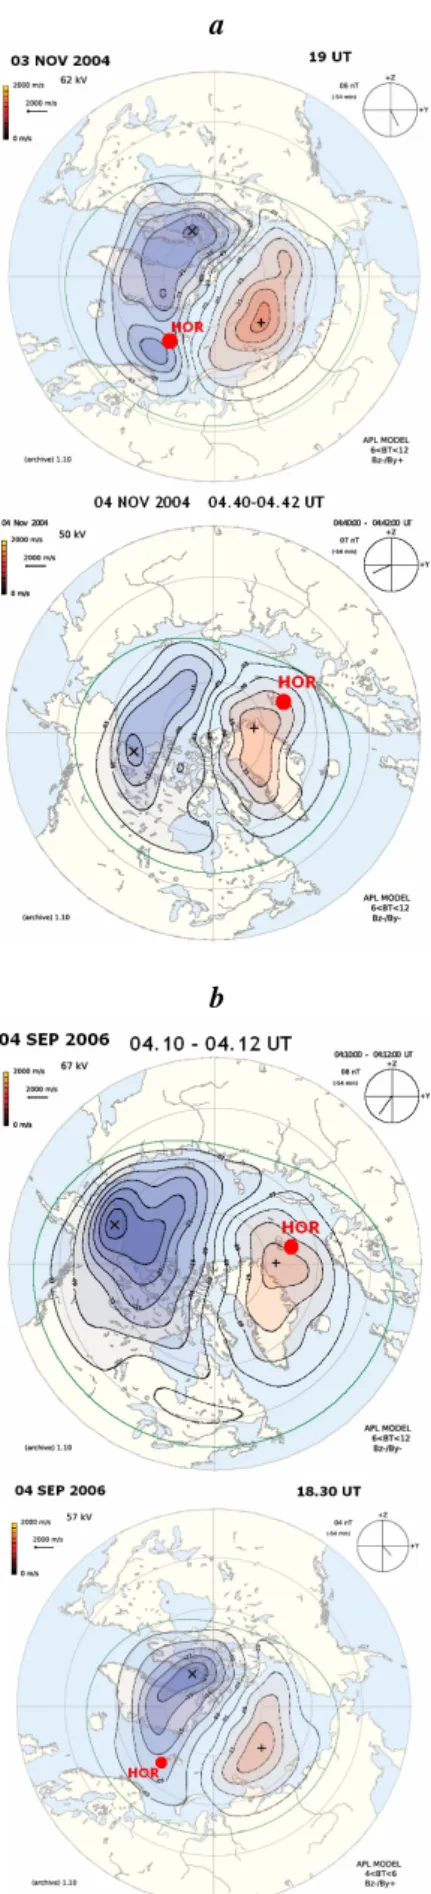
STUDY OF GAMMA-RADIATION CONNECTED TO ATMOSPHERIC PRECIPITATION
- Instrumentation
- Scintillation spectrometer
- Additional equipment
- Observations
- Discussion
- Conclusions
The intensity of photons is determined by the generation of energetic electrons and positrons in the form of bremsstrahlung and an alternative process of absorption in air [3]. The energy spectrum of electrons in the energy range (E < 1MeV) can be approximated by the exponential law [3].
INVESTIGATION OF THE IONOSPHERIC F-LAYER RESPONSE TO THE FAC2 VARIATIONS DURING APRIL 16 AND 17, 2002 USING THE
INVESTIGATION OF THE IONOSPHERIC F LAYER RESPONSE TO THE FAC2 VARIATIONS DURING 16 AND 17 APRIL 2002 USING THE. Model interpretation of the unusual nocturnal electron density behavior in the F region observed by the Millstone Hill incoherent scattering radar in April.
STUDY OF HIGH-LATITUDE D-REGION IONOSPHERE
CHARACTERISTICS DURING PERIODS OF POLAR MESOSPHERIC ECHO (PME) APPEARANCES
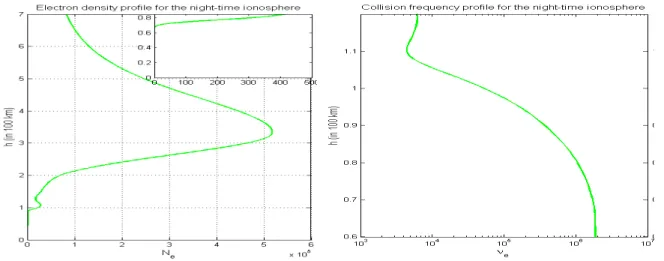
The solid line in the figure on the left shows the profile of the electron density, measured by incoherent scattering (IS). Therefore, determination of the effective loss factor can be an effective method for dust determination in the mesosphere.

CONJUGATE AND INTER-HEMISPHERIC OCCURRENCE OF GPS TEC FLUCTUATIONS IN HIGH LATITUDE IONOSPHERE
This is also confirmed by a comparison of the aurora distribution in the oval (Feldstein et al, 1974, Zverev and Starkov 1975) and TEC measurements with GPS receivers (Shagimuratov et al, 2006). Primary images of the auroral oval for the azimuth vector diagram were generated using the data described in (Feldstein et al., 1974;

WAVE DISTURBANCES IN THE LOWER IONOSPHERE DURING THE EARTHQUAKES ON AUGUST 2006
The analysis of experimental data
On the spectrum of the common component, the amplitude of the partially reflected signal is broader than the spectrum of the amplitudes on August 7. Daily spectrum amplitudes of lowest frequency fmin in days of the August 7 and 11, 2006 earthquakes are shown in Figure 6.

Summary
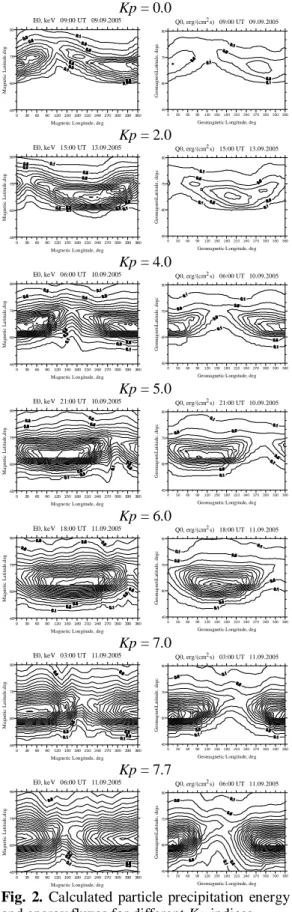
Precipitating high-energy electrons are the main source of ionization at dusk and at night, even under calm conditions. Rheometric absorption at the frequency of 29.9 MHz at the Ivalo and Sodankyla observatories increased to 2.5 dB in the first half of the day.
LONG-TERM VARIATIONS OF ENERGETIC ELECTRONS AT LOW ALTITUDES
Whenever the satellite is poleward of about 35° latitude, this detector monitors electrons in the atmospheric loss cone that will enter the Earth's atmosphere below the satellite. This is best seen in the years 2006 to 2009, when significant geomagnetic conditions caused the least disturbance in electron flows.

UNIVERSITY SATELLITES DEVELOPMENT PROGRAM
Its main scientific goal - detection of transient light effects in the atmosphere and ionosphere - was raised after the "Universitetsky-Tatiana" experiment with UV detector. The study of transient events in the Earth's upper atmosphere is already a tradition of Moscow University.

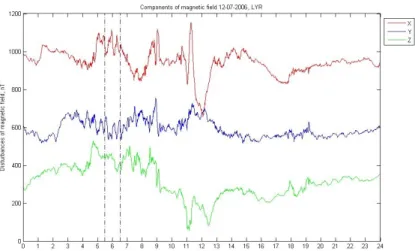
In the lower part, the ratio of the horizontal vector variations to the vertical components is presented. This event is characterized by large value of the ratio of the horizontal vector to the vertical component.
NUMERICAL SIMULATION OF THE DYNAMICS OF FINE-SCALE IRREGULARITIES IN THE NEAR-EARTH RAREFIED PLASMA
NUMERICAL SIMULATION OF THE DYNAMICS OF FINE SCALE IRREGULARITIES IN THE PLASMA, RARE ON EARTH. Numerical simulation of the dynamics of fine-scale irregularities in the rarefied plasma near Earth.

THE ROLE OF ION DIFFUSION IN FORMATION OF 3-D SPATIAL STRUCTURE OF THE PLASMASPHERE
Model result
- Near-equatorial maximum
- Sub-auroral maximum
- Mid-latitudinal maximum
Therefore, during the day, a considerable number of O+ ions are produced here, which accumulate in the upper part of the tube, where there is almost no recombination. Therefore, both in the shorter and in the longer tube, nighttime recombination takes place faster, and a maximum appears between them.
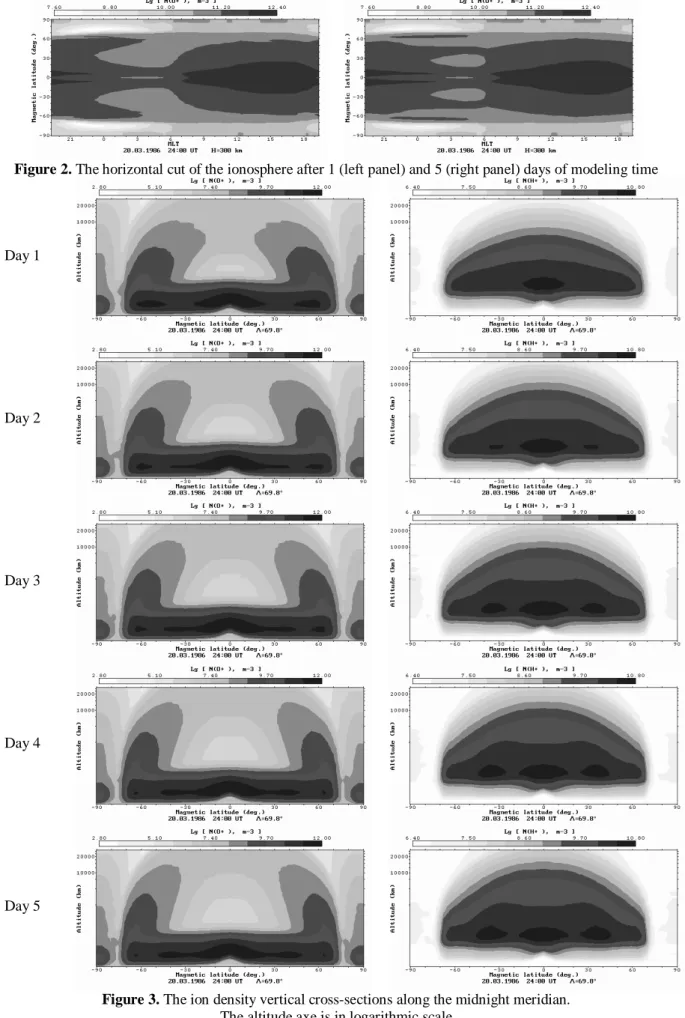
Conclusions
In order to discover the physical mechanism of its formation, we performed another simulation in which the temperature of the ions was constant in the entire space. At latitudes of 30-40°, the diffusion currents are strong enough to fill the relatively small volume of the tube during the day and return a large part of the accumulated ions back to the ionosphere at night (Fig. 5, right panel).
VALIDATION OF THE MODEL IRI - 2007 BY THE LATEST EXPERIMENTAL DATA IN AURORAL IONOSPHERE
The latest experimental data shows that the solar wind value of the magnetic field has very low values (Figure 5). Thus, the model is not accepted for such low values of the solar wind parameters and consequently for low values of maximum height and electron density in the F2 layer.

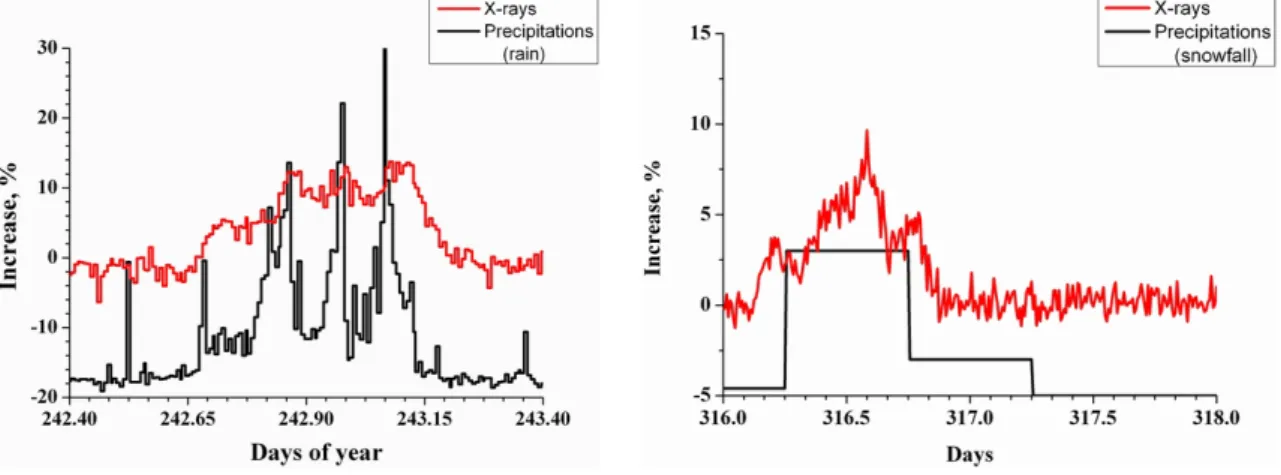
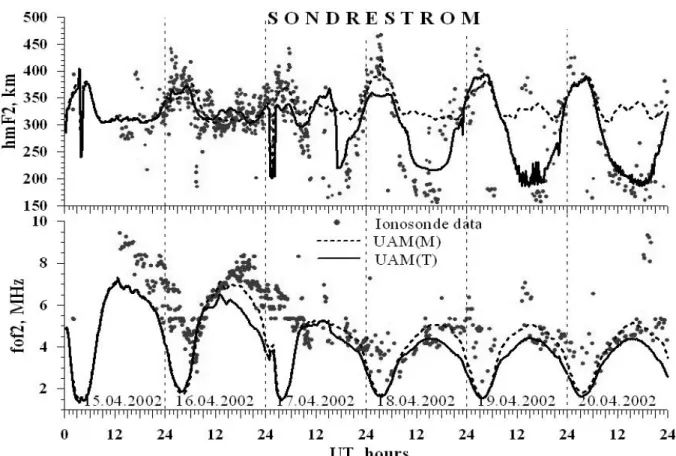
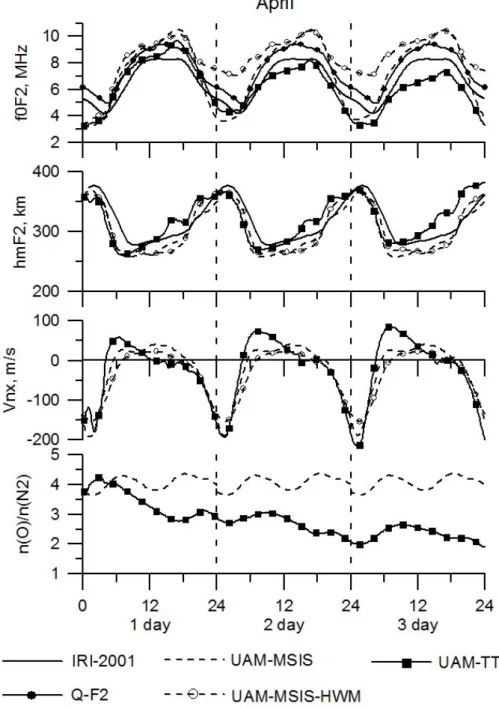
TESTING OF THE UPPER ATMOSPHERE MODEL USING THE EMPIRICAL IONOSPHERIC MODELS
The UAM-TT version underestimates the daytime f0F2 values at the end of the third twenty-four hour integration period in all seasons. The poleward wind speed increases and this causes a decrease in the hmF2 and f0F2 in winter and summer solstices.
MAGNETOSPHERIC AND THERMOSPHERIC ORIGIN ELECTRIC FIELDS INFLUENCE ON THE ENHANCED ELECTRON DENSITY
Magnetospheric electric field influence on the EEDR’s
In the top row—calculated by UAM-MSIS taking into account field line ion transport caused by the thermospheric wind, the geomagnetic height–latitude distributions of Lg(ne) along the nighttime geomagnetic meridian 01:30 MLT for height range from 800 to 3000 km, bottom row – corresponding geomagnetic latitude–longitude distributions of the eastward electric field at 175 km altitude for 24:00 UT 16.04.2002. In the left column – the meridional section and the map corresponding to the model calculation with ∆φ=20 kV, in the right column – with ∆φ=60kВ.
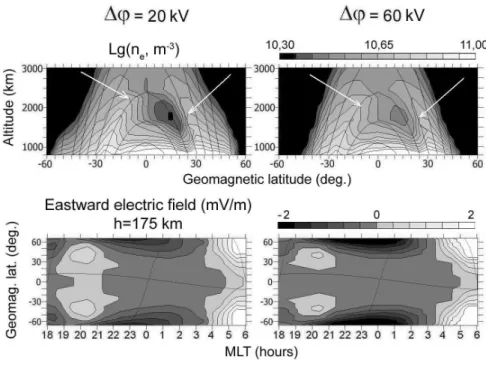
Thermospheric (dynamo) electric field influence on the EEDR’s
The equatorial sides of the EEDR's abut the equatorial anomaly remain in the MLT sector at night. Thus, our study shows that the magnetospheric and thermospheric (dynamo) origin electric fields influence the latitudinal location and shape of the equatorial sides of the EEDR adjacent to the equatorial anomaly remains in the nighttime MLT sector.
NUMERICAL MODELING OF THE ALASKA 1964 EARTHQUAKE IONOSPHERIC PRECURSORS
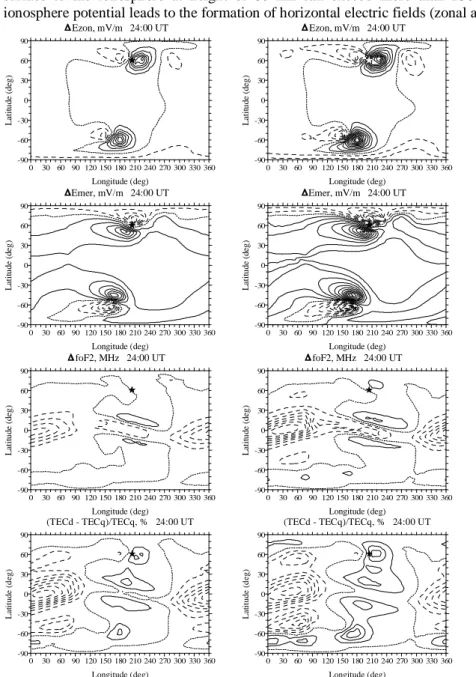
Calculation results of ∆Ezon, ∆Emer, ∆foF2 and ∆TEC with penetrated vertical electric field at electric potential irregularity, which is equal to 10 kV (left panel) and 30 kV (right panel). Numerical simulation of the electric field and zonal current in the Earth's ionosphere: the dynamo field and the equatorial electrojet.
DISTURBANCES OF HELIOGEOPHYSICAL PARAMETERS
DISPLAYING IN THE MAXIMUM OBSERVED FREQUENCIES ON IONOSPHERIC OBLIQUE SOUNDING TRACES
Used data
Search of linear correlations and their estimation
Nonlinear connections and MOF restoration on examined traces
A solid line - real MOF values of Irkutsk - Rostov-on-Don track, a dotted line - the values recovered by neural network. Similar neural network recovery of MOF data was performed for railway Cyprus - Rostov-on-Don.
MAGNETOTAIL STRETCHING UNDER DIFFERENT SOLAR WIND CONDITIONS
The latitude of the isotropy boundary corresponding to the magnetic clouds (or their parts) with north. Latitude of the proton isotropy limit as a function of MLT for different solar wind conditions.

EARLY FORECAST OF RADIATION HAZARDOUS SOLAR COSMIC RAY FLUXES ON THE NEUTRON MONITORS DATA
Analysis of separate events Event of 21 May 1990
- Event of 14 July 2000
- Event of 15 April 2001
Points is a spectrum of time of maximum (TOM) spectrum, according to direct measurement of solar protons on the GOES-10 spacecraft. Dots are the TOM spectrum of the maximum fluxes according to direct measurements of solar protons on the GOES-8 spacecraft.

SOLAR WIND RECURRENT PHENOMENA IN 23-th MINIMUM
Data and calculations
To interpret the image of the last minimum, we select data representing the near-Earth cosmic space: parameters of the plasma and interplanetary magnetic field in the SW (Wind data; SOHO, University of Maryland), data on the sector structure (SS) of the IMF (ACE). ). Solar parameters are presented as follows: LASCO SOHO coronal images; MDI magnetograms and the solar disk in the EIT SOHO soft X-ray; disk sunspots in the continuum (SOHO); and also photospheric magnetic field synoptic maps and WSO source surface field maps; and also CH cards in the Fe XIV NSO Sacramento Peak line to add dynamic CH transformation to CR 2052-2091 in the 23rd minimum in 2007-2010.
IMF polarity and SW flows
The Higuchi method allows us to estimate fractal dimension (FD) of SW plasma, as the characteristic of SW plasma flow structure.
Fractal dimension variations in front of fast SW streams in HPL transitions
The dividing line in the WSO source surface field synoptic chart proves a true situation. Solar activity and the connection of geomagnetic disturbances // In "Physics of solar corpuscular currents and their action in the upper atmosphere of the Earth", Publishing House of the Academy of Sciences of the USSR.
THE FORECAST OF GEOMAGNETIC ACTIVITY UNDER THE ESTABLISHED CHARACTERISTICS OF SOLAR WIND MAGNETIC
Base of force-free cylindrical model magnetic clouds
Analysis of influence of magnetic cloud parameters on its geoeffectiveness
Technique of short-term forecast of geomagnetic storms intensity caused by magnetic clouds The technique of short-term forecast of geomagnetic storm intensity caused by magnetic clouds includes two basic
Manifestation of configurations of magnetic clouds of the solar wind in geomagnetic activity // Kosmicheskie Issledovaniya (RAS). Effects of magnetic clouds on the occurrence of geomagnetic storms: The first 4 years of Wind // J.

THE ACTIVE REGION MAGNETIC FLUX CORRELATION WITH FLARES APPEARANCE
The association of the active region magnetic field and flares has been investigated for many years. The calculations were performed in the domain 41010 см × 41010 см, when the active region of the eastern limb is displaced in ~30О. The figure shows that the line-of-sight magnetic field distribution is quite different from distribution of the normal magnetic component. б) Calculated magnetic field distribution of the normal magnetic field component.

MODELLING OF HADRON INTERACTIONS IN THE NEUTRON MONITOR
To calculate the response function of the neutron monitor, first of all, information is needed about the neutrons that have reached the detector and interacted with the 10B nuclei. A modeling and calculation of a response function of the standard neutron monitor NM-64 to different types of secondary cosmic rays was performed with a GEANT4 software package.
EFFECTS OF THE LONG –TERM VARIATIONS OF THE SOLAR WIND ON THE NEAR-EARTH SPACE
Experimental data
EFFECTS OF LONG-TERM SOLAR WIND VARIATIONS ON THE NEAR UNIVERSE.
Results of experimental data analysis
One can find in the long-term variations of the solar wind density some evidence for the existence of cyclic wind. Quite good agreement was found between the long-term variations of solar wind density and sea ice cover in the Arctic.

FULL-WAVE SOLUTION FOR A MONOCHROMATIC VLF WAVE PROPAGATING THROUGH THE IONOSPHERE
A deviation of the reflection coefficient from unity at h = 600 km is thus only due to energy absorption in the ionosphere. A numerical study of excitation, internal reflection and limiting polarization of whistler waves in the lower ionosphere.
CONTRIBUTION OF THE MHD WAVE MODES TO THE GLOBAL Pc5 PULSATIONS
The global pulsations of PC5 on 31 October 2003 are Alfvén waves on both the morning and afternoon sides. Generation of Pc5 pulsations of the geomagnetic field and rheometer absorption // Space Research (Kosmicheskie issledovanija).

CALCULATION OF THE MAGNETOPAUSE STAND-OFF DISTANCE
The authors found changes in the shape of the magnetopause with varying dipole tilt angle. Analytical models for estimating the distance to the magnetopause R0 [Kuznetsov and Suvorova, 1998; Shue et al.

MODELS OF THE GEOMAGNETIC FIELD AND MAGNETOMETER MEASUREMENTS OF CLUSTER FGM IN THE MAGNETOSPHERIC
Furthermore, the results of the statistical analysis of the impact of Bz events on geomagnetic activity are presented. The annual variation of SME events is similar to the same variation of solar activity.

IMF B
Weak magnetic storms could develop without the occurrence of Bz-events in the solar wind. However, it is impossible to estimate the intensity of a magnetic storm by evaluating the intensity and duration of Bz-events.
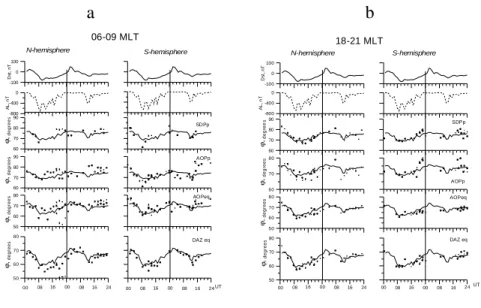
MORNING – EVENING ASYMMETRY OF AURORAL PRECIPITATION DURING MAGNETIC STORMS
In the main phase of the storm (maximum magnetic activity) the region of mild auroral precipitation (SDP) located poleward of the AOP disappeared. As can be seen, the width of DAZ precipitation in the evening sector (18-21 MLT) does not change significantly, while in the morning sector (06-09 MLT) DAZ.
STRENGTHENING EFFECT OF THE MAGNETIC FIELD DUE TO THE PRECIPITATION OF CHARGED PARTICLES
The distribution of the plasma pressure field in the magnetosphere before (1) and after before (1) and after dipolarization (2). The distributions of the kinetic energy of charged particles in magnetic flux tubes vs colatitude θ before (1) and after dipolarization (2).

THE STELLACAM II AS AN ALL-SKY IMAGER DURING THE SCIFER 2 ROCKET CAMPAIGN
- Short background
- Parts and components
- Experimental setup
- Rocket animation
- Concluding remarks
The green circle is the missile's position determined on the geomagnetic field line at an altitude of 200 km. A video overlay projects information on the date, time, position, viewing angles and altitude of the missile.

IONOSPHERIC DISTURBANCES GENERATED IN THE AURORAL ZONE DURING MAGNETIC STORMS
Simulation of the motion of points in the geomagnetic and geographic coordinate
According to calculations, the speed of the point in the geographical system consists of two components: along the geographical meridian (meridional component, Vr) and along the geographical parallel (zonal component, Vφ). The meridional velocity component Vr in the geomagnetic longitudes near 0° and 180° varies slightly with latitude and is close to the meridional velocity in the geomagnetic coordinate system.
Conclusion
An analysis of the table in [Leonovich et al., 2004] shows that westward dayside anomalies were observed in the American region; eastward anomalies on the night side, in the European and Asian regions. However, during the October 29, 2003 storm, a westerly deviation was recorded in the European and Asian sectors [Perevalova et al., 2008].
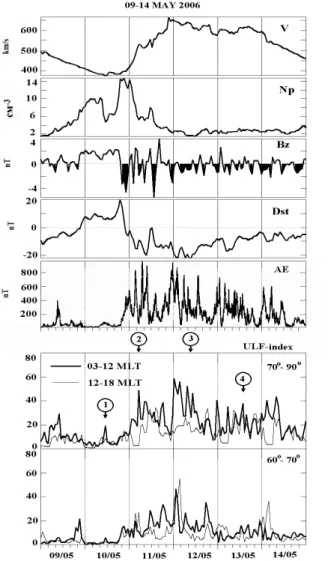
DAYSIDE STORM-TIME ULF PULSATION IN THE SOLAR ACTIVITY MINIMUM
Data and results
The variations in the speed (V) and density (N) of the solar wind, the Bz component of the IMF, Dst and AE indices, and also the ULF index of the aurora and polar zones in the morning and afternoon sectors of the magnetic storm on May the CIR storm). The most intensive ULF were observed in the pre-noon sector of the polar latitudes.
BEHAVIOR OF IONOSPHERIC PARAMETERS AT MID-LATITUDE STATIONS DURING SEQUENCE OF GEOMAGNETIC STORMS ON
The new approach has allowed to significantly improve the agreement of the calculation results with the experimental data. Numerical simulation effects of magnetospheric convection, particle precipitation, and field currents of the second region during the 9–14 September 2005 geomagnetic storm sequence.
BEHAVIOR OF THE 5577Å AND 6300Å EMISSIONS DURING SUBSTORMS CONNECTED WITH RECURRENT SOLAR WIND
In the upper panels, the 5577 Å images showing the development of the auroral bulge are shown. Dmitrieva (1979), Substorm in the polar cap - the effect of high speed solar wind streams.

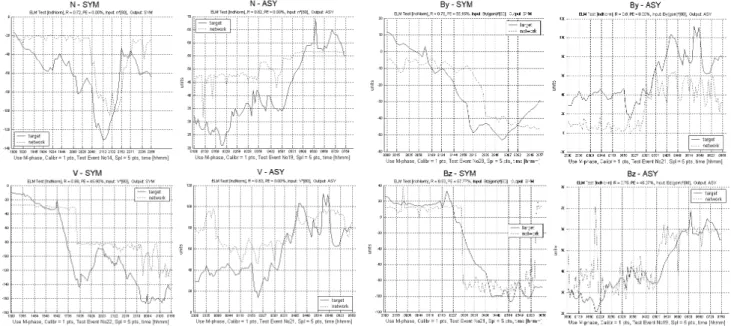
NONLINEAR CONNECTION OF RING CURRENT AND AURORAL ELECTROJETS ACTIVITY WITH SOLAR WIND AND
INTERPLANETARY MAGNETIC FIELD PARAMETERS
The search of linear correlations
The speed of the solar wind and its density have a greater influence on an annular current (SYM, ASY) compared to auroral electric currents. For storms of strong intensity the influence of the solar wind speed is greater than for storms of moderate intensity and weak storms.
The search of nonlinear connections and neural network reconstruction
Solar wind speed, IMF component Bz and, to a lesser extent, solar wind density have the greatest influence on the development of auroral electrojets in the main phase of a geomagnetic storm. In the current work, the influence of the parameters of the solar wind and the interplanetary magnetic field on the circular flow and the development of auroral electrojets in the main phases of magnetic storms is investigated.
SOFTWARE-COMPUTER COMPLEX FOR SPACE WEATHER PREDICTING
- Review of existing computer complexes for space weather forecast
- Application interface
- Used data
- Statement of experiments through the web- interface
- Conclusion
By clicking on “Results of the calculations”, you will be taken to the page with the results of previous experiments. Artificial neural network technique for predicting the critical frequency of the ionospheric F2 layer // Radiophysics and Quantum Electronics, 2005, V.48.
Kp INDEX CORRECTION IN ORDER TO ELIMINATE EXCESS IMPACT OF HIGH LATITUDE MAGNETOSPHERIC DISTURBANCES
Check of existence Kp index error
Low correlation factors between low and high latitude magnetograms from Kp index calculation stations are confirmed. In this regard, the offered correction of the Kp index of the planetary magnetic activity, the cleaning of the magnetograms of the polar contribution from the observatories of the Kp calculation is reduced.
Algorithm of «clearing» magnetograms from the polar contribution is working out
3 «clearing» magnetogram example of observatories Calculation of Kp index from the polar contribution registered at high-latitude station Yellowknife from calculation of AE index in disturbed day on January 7, 2004 is shown. Magnetograms of Meanook observatory of calculation of Kp index of the polar contribution are cleared.
Calculation of a new index on the basis of «cleared» magnetograms
The magnetic records of Kp observatories are identified, which require cleaning by correlation analysis of magnetic records for each pair of observatories for an excess correlation factor (|R |>0.5). Then, by repeating the official Kp-index calculation algorithm on the corrected magnetograms, we calculate a certain Kp index that does not contain excess effects of polar electrojets.