Master's Thesis Title The Relationship Between Market Value and Characteristics of Innovative Firms: Empirical Investigation. This article is devoted to the study of the impact of the characteristics of innovative companies on the relationship between innovative activities and the market value of these companies. The subject of the study is the relationship between the characteristics of innovative companies and their market value.
FIRM VALUATION. REVIEW OF APPROACHES
Estimation of discounted cash flows
- Discounted free cash flow models
- Dividend discount model
- Residual income models
- Full formulation of discounted cash flow model
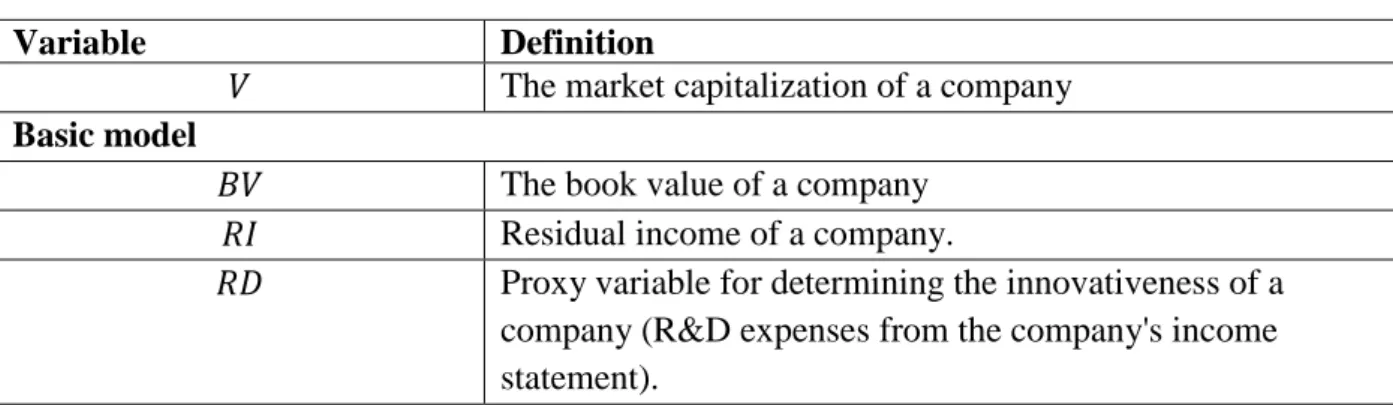
The value of the firm reflects the free cash flow available to the firm's owners and creditors, in other words, the value of the firm as a whole (Copeland, Koller, Murrin 1995). 11 𝑉𝐸FCF - fundamental value of equity 𝐹𝐶𝐹𝐸𝑡- free cash flows for period t;. 𝑘𝑒- discount rate reflecting the required rate of return of the owners. 𝐵𝑉𝑗−1 - the book value of the investment at the beginning of the reporting year (end of the previous reporting year).
Multiples approach
- Price multiples
- Enterprise value multiplies
The P/CF ratio is calculated as the market value of equity divided by the company's cash flow. Thus, Tobin's Q is expressed in a ratio similar to the book value of assets rather than the replacement cost of the company's assets. However, the use of EBITDA may lead to an overestimation of the value of cash flows (Pinto, Robinson, Henry, Stowe, 2010).
The market value and efficient market
34;Market efficiency" is one of the key attitudes of the investor, which largely determines his/her approach to investment. When evaluating an investment, the central questions are whether the markets are efficient and, if the answer is no, what does this mean .inefficiency means If the markets are efficient, then the market price provides the best estimate of value, and so the valuation process becomes a way to justify the market price.
If the markets are inefficient, then the market price may deviate from the intrinsic value, and the valuation process in this case aims to obtain a reasonable estimate of the company's value. However, in order for investors to have the opportunity to receive a high profit, markets must correct their mistakes over time (ie, become efficient). The duration of these adjustments can have a serious impact on the choice of the investor's approach to investment, as well as on the time horizon necessary for the successful implementation of the chosen investment strategy.
If markets were efficient, investors would no longer look for inefficiency, which in turn would push markets toward inefficiency. The discounted cash flow valuation is based on an assumption about the company's future cash flows, allowing one to compare the company's market value with the value the company can generate. Using multiples, we assume that the market correctly determines the prices of stocks on average, but makes mistakes when forming the prices of individual stocks.
When evaluating a company, internal and external analysts try to determine the company's intrinsic value, which reflects the company's real economic potential.
The relationship between the characteristics of innovative companies and the market
- Definition of innovation and innovative company
- Measuring company innovations
- Analysis of the relationship between innovation activities and company market value
- Analysis of the firm characteristics impact on the relationship between firm innovative
- Company size
- Growth of the company
- Market share
The Oslo manual and other sources provide freedom to define "innovative enterprise" according to the purpose of the research. Although this indicator is usually used to measure innovation, in reality it is only part of the innovation that is captured in the patent. The results of the empirical analysis show that there is a positive and significant correlation between investment in R&D and innovations.
In the last decade, the geography of innovation has changed, as evidenced by the Global Innovation Index assessment data1. Muhd Kamil Ibrahim, 2017), after studying Malaysian companies, found a weak relationship between firm value and R&D investment, with a strong dependence of value on the size of the company's tangible assets. The analysis of the characteristics of the firm affects the relationship between the innovative activities of the firm and its market value between the innovative activities of the firm and its market value.
Using aggregated data from US companies, the authors find evidence that R&D investments are determined by firm and industry characteristics. A significant number of researchers have identified a positive relationship between the market value of innovative companies and the following company characteristics: company size, company growth, and market share. Furthermore, Blundell, Griffith, and Reenen (1999) suggest that this positive influence plays an important role in creating entry barriers, the presence of which increases the value of the firm.
Innovation activity is activity from invention (discovery of a new device, product, process or system) to the moment of first commercial or social use.
EMPIRICAL STUDY OF THE RELATIONSHIP BETWEEN THE
Methodology
A value of 1 is required if the firm size is larger than the national industry average, and 0 otherwise. If DS = 1, the firm size is considered large, and if DS = 0, it is considered small. A value equal to 1 is needed if the company's sales growth is higher than the country's industry average, and 0 otherwise.
At DG = 1, the company's growth rate is considered high, and at DG = 0, it is considered low. A value equal to 1 is required if the company's market share is higher than the country's industry average, and 0 otherwise. With DMS = 1, the company's market share is considered high, and with DMS = 0 if low.
According to this condition, the net profit after tax for the shareholders of company i in period t is formed in two ways: from current dividends and capital gains. Since residual income is expressed as (3.2), the equation could be expressed as:. Sougiannis 1994) argues that the impact of research and development on market value can be indirectly reflected in profits. Therefore, past R&D expenditure is likely to play a role in explaining residual income, which depends on currently available information.
According to (Sougiannis, 1994), the values of previous R&D expenditures rarely provide additional information in explaining market value if current residual income was included as an explanatory variable in the valuation model. Therefore, only the company's current R&D investments were included in the valuation. econometric model.
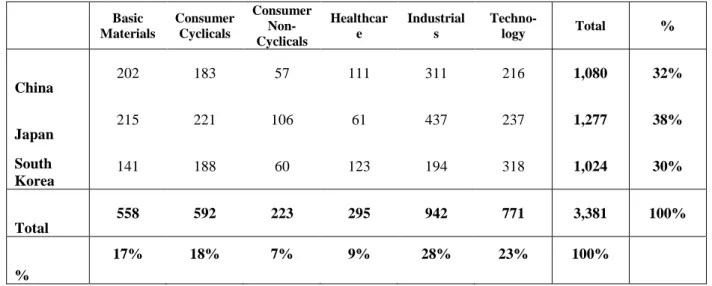
Creating a sample
The number of observations is almost evenly distributed over the entire duration of the research period.
Descriptive statistics
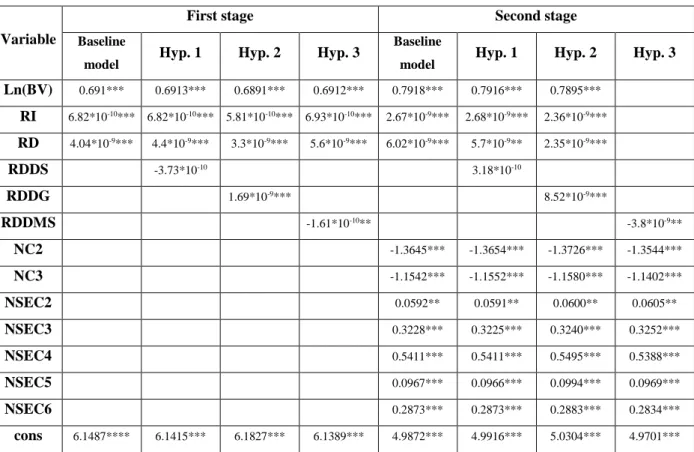
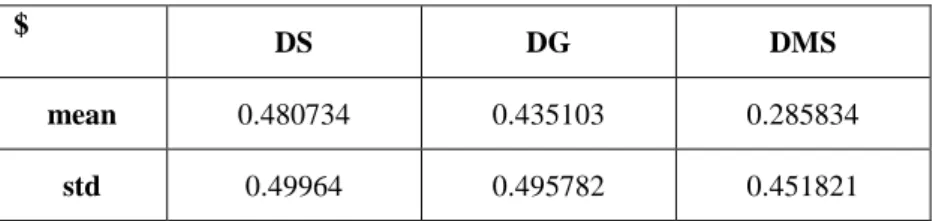
In the sample, 48.1% of observations concern companies with assets above the average of companies in the industry, 43.5% on companies whose sales growth exceeds the industry average, and 28.6% on companies whose market share is higher than the sector average. . In the sector structure of R&D investments, we see that the averages for R&D of healthcare companies are higher in the graph every year than the averages of other sectors. At the same time, companies in the non-cyclical consumer sector have been lower than other sectors for almost all years, which can be explained by the fact that most consumers, when choosing essential goods, pay attention to the price, rather than new products. brand and additional features.
The dynamics of investment and the relative position of countries in the statistics from the UNESCO Institute for Statistics replicate the dynamics and the relative position of countries in the survey sample. The share of R&D investment by innovative and active local public enterprises from the sample is less than 10% of the country's domestic investment, since domestic investment includes the expenditure of commercial enterprises operating in the country, the government, higher education institutions and private non-profit organizations, regardless of the funding source. This indicator allows you to reflect how much of the company's revenue is reinvested in R&D.
Despite the lower investment in R&D in absolute terms, in relative terms, South Korea leads in the share of investment, according to the statistics for the countries of the UNESCO Institute for Statistics and the OECD. The indicator is calculated as the share of domestic investment in R&D in the country's GDP. According to the sample, China's innovative companies invest a larger share of their revenue in R&D than the average government, commercial and non-profit institutions across the country.
Country-by-country statistics show that Japan and South Korea have overtaken the United States in terms of investment in the country's GDP, while China is slightly behind.
Regression analysis and main results of the study
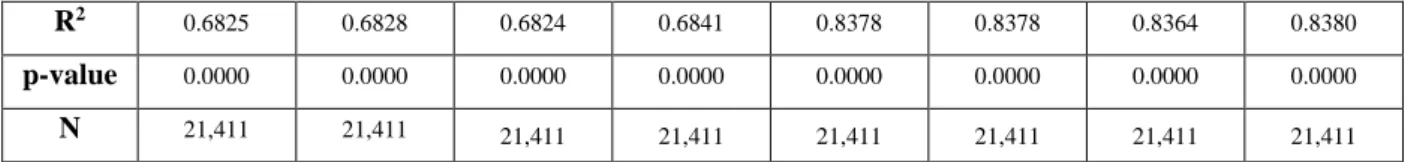
In the first basic model, all independent variables affecting the market value of the company were found to be significant. Therefore, since the coefficient before the research and development investment variable turned out to be positive, our data are consistent with the finding of many scientific articles that the size of the investment in research and development has a positive effect on the market value of the company. Thus, we accept the second hypothesis about the positive impact of high rates of sales growth on the market assessment of the value of an innovative and active company.
Based on the significance/insignificance of the coefficients before the variables and their sign, which is responsible for the relationship between company characteristics and market value, we can conclude that the coefficients before these variables are stable, which confirms the following relationships: between company characteristics and market value:. As a result of this analysis, a statistically significant positive relationship was found between high growth rates of innovative companies and the market value of the innovative activities of the company. The study also rejected the hypothesis of a relationship between the size of the innovative firm and the market value of the firm's innovations.
In addition, this chapter provides an overview of research describing the relationship between companies' innovation activities and market value, as well as publications and studies on the impact of frim characteristics on the relationship between companies' innovations and companies' market value. It has been found that the size of the company has no influence on the relationship between innovations and the market value of companies. Thus, the first hypothesis of a positive impact of firm size on the relationship between firm innovations and market value was rejected.
During the course of the research it emerged that a high market share negatively affects the market value of innovations in companies. According to the results of the calculations, the model was resistant to the introduction of new variables, as the direction of the relationship between the market value and the independent variables did not change. At the same time, the size of the company does not matter, all other things being equal.