The relationship between share of state ownership and efficiency of Russian oil and gas companies is also studied. Furthermore, the relationship between the share of state ownership and the efficiency of Russian oil and gas companies will also be examined.
Literature review and overview of Russian oil and gas market
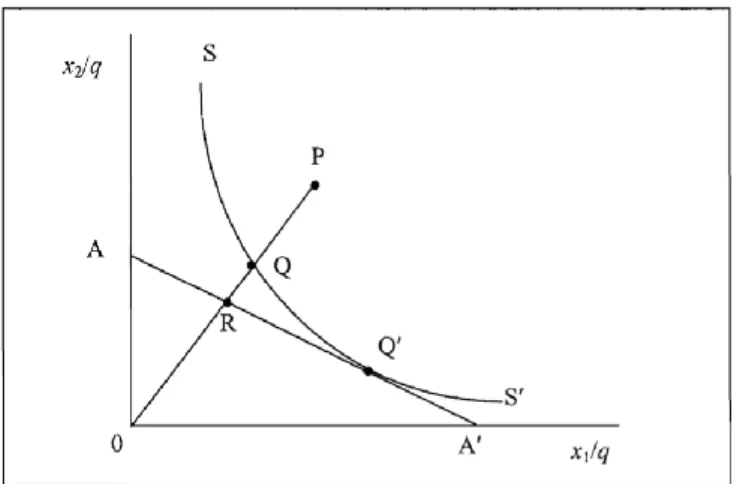
Efficiency as an indicator in performance measurement and methods to measure efficiency
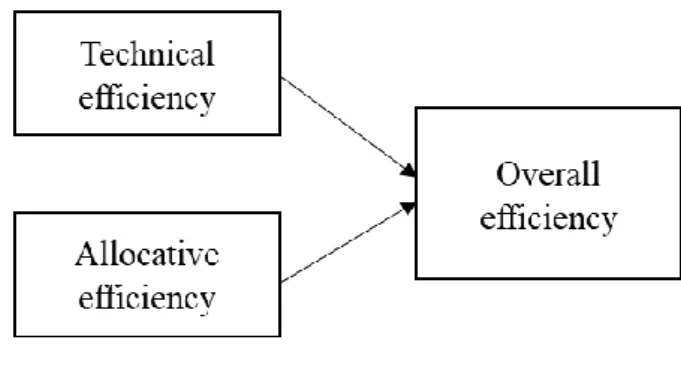
- Efficiency as an indicator in performance measurement
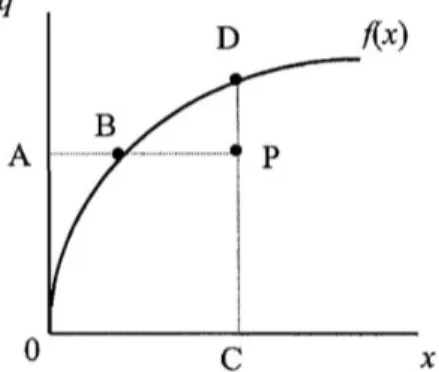
- Parametric methods to measure efficiency
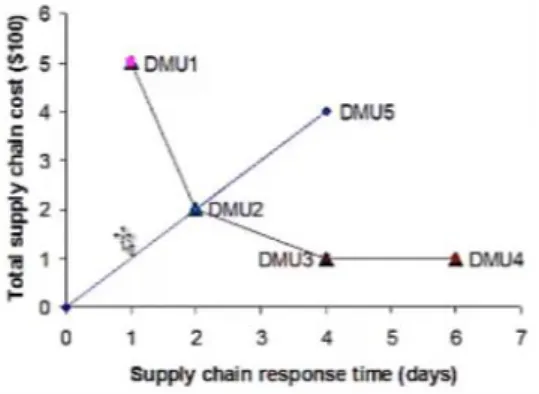
- Non-parametric methods to measure efficiency
Three groups of researchers, namely, Cooper et al. 1989) recommended that the number of DMUs be three times the sum of the number of inputs and outputs. Dyson (2001) suggested that the number of DMUs should be twice the product of the number of inputs and outputs.
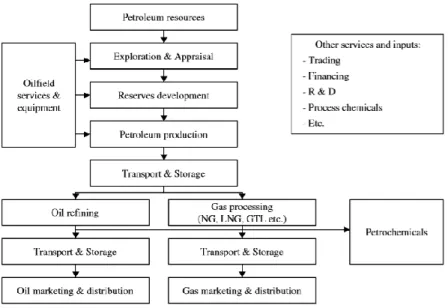
Oil and gas industry value chain and application of efficiency measuring methods
Aside from industry participation, licenses and petroleum contracts are another major factor influencing the value creation of oil and gas companies. Considering the main findings above, it can be concluded that one of the most important factors determining efficiency in the oil and gas sector is the share of government ownership.
Russian oil and gas market overview
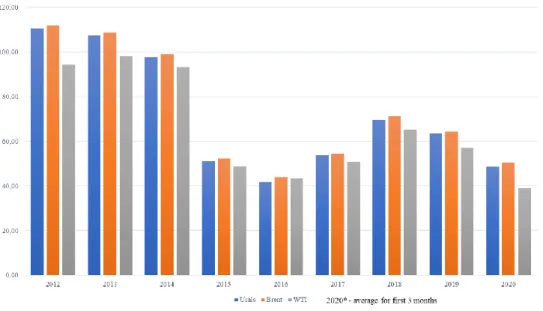
- Global trends: supply, demand and price dynamics
- Global trends: Cooperation with OPEC
- Global trends: Impact of Sanctions
- Local trends: Concentration of Russian market and resource depletion
- Local trends: Liquified natural gas projects, Arctic and offshore
- Hypotheses statement
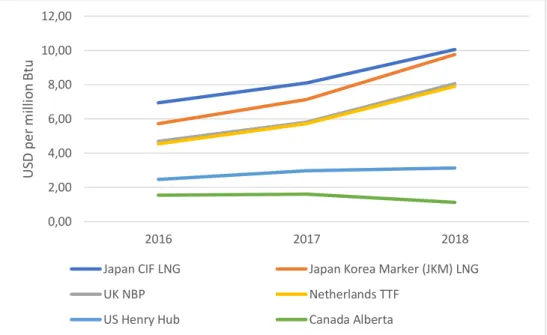
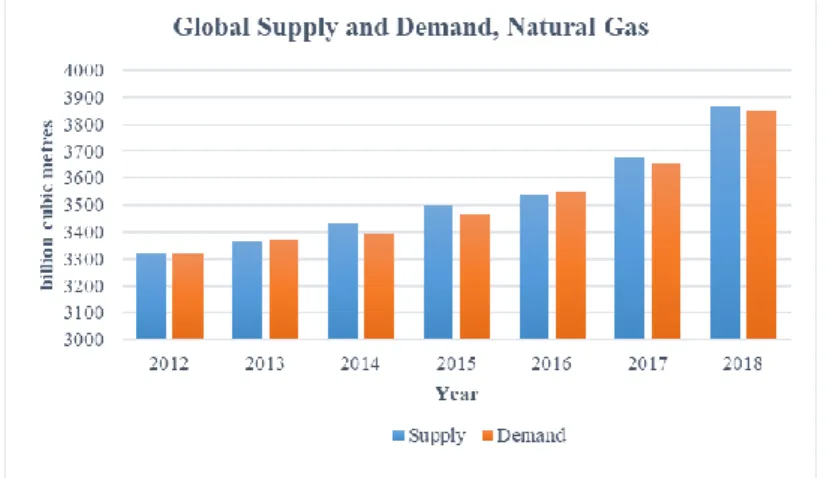
Production growth in 2018 was mainly driven by the US, which contributed 45% of total global production growth, mainly due to increased US LNG demand (BP 2019). The main driver was the US, which contributed 40% of total global demand growth (BP 2019). The Henry Hub price, the benchmark for US gas, rose from $2.46 USD/MMBtu to.
The main target of output growth that prevailed in 2014-2016 was prompted to shift due to the recent crisis. Therefore, the intentions of Russian companies to expand and globalize their activities were limited due to the sanctions. Other small companies not mentioned on the graph account for 11% of Russian oil production.
Given the current drop in the oil price, it is assumed that the investments in the discovery of new fields will also fall in 2020. Meanwhile, the development of new LNG projects is currently experiencing a slowdown due to the low price of LNG and market oversupply as well as the US sanctions imposed on Russian companies (NOVATEK 2020). Now most of the shelf projects, especially Arctic, have been suspended due to the sanctions imposed and the lack of Russian equipment and technologies.
Empirical study
Research design and methodology
In this model, 𝑙𝑜𝑔𝑂𝑢𝑡𝑖𝑡 represents the logarithm of production for a 𝑖𝑡ℎfirm in period t, 𝑙𝑜𝑔𝑂𝑢𝑡𝑣 𝐸𝑚𝑝𝑖𝑡 is the number of employees for a 𝑖𝑡ℎfirm in period t, 𝑢𝑖𝑡 is a technical inefficiency component; 𝑣𝑖𝑡 is a stochastic shock, 𝛽1 and 𝛽2 are model coefficients to be estimated. The second model specification aimed to control for state ownership and depletion policy of oil and gas companies. Unfortunately, it is impossible to control for vertical integration of the companies, since most companies do not report the data necessary to calculate the vertical integration ratio.
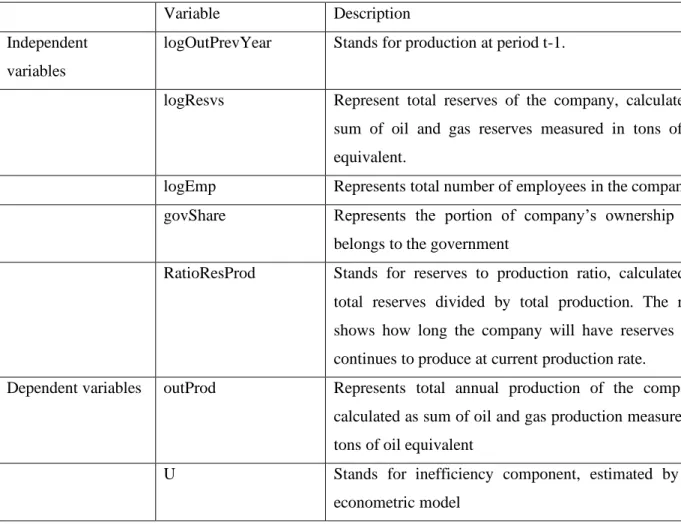
The second equation makes it possible to estimate the direct effect of the share of state ownership and the policy of depletion, expressed as the ratio of reserves to production, on the expression of inefficiency. In this model, 𝑙𝑜𝑔𝑂𝑢𝑡𝑖𝑡 represents the logarithm of production for 𝑖𝑡ℎcompany in period t, 𝑙𝑜𝑔𝑂𝑢𝑡𝑃𝑟𝑒𝑣𝑌𝑒𝑎𝑟 𝑖𝑡 represents the logarithm of production in period t-1 for 𝑖𝑡ℎcompany, 𝑙𝑜𝑔𝑅𝑒𝑠𝑣𝑠𝑖𝑡 is the logarithm of reserves for 𝑖𝑡ℎcompany in period t, and 𝑙𝑜𝑔𝑔𝑐𝑚𝑝𝑖𝑡 is the number of employees in company 𝑖𝑡ℎ in period t is the 𝑢𝑖𝑡 component technical inefficiencies for 𝑖𝑡ℎcompany in period t; 𝑣𝑖𝑡 is the stochastic shock to 𝑖𝑡ℎfirm in period t, 𝛽1 and 𝛽2 are the coefficients of the model to be estimated. The second equation, although estimated simultaneously with the first, represents an ordinary linear regression model, where 𝑔𝑜𝑣𝑆ℎ𝑎𝑟𝑒𝑖 means the share of state ownership for 𝑖𝑡ℎcompany, 𝑅𝑎𝑡𝑖𝑜𝑅𝑒𝑠 𝑃𝑟𝑜𝑑𝑖 represents the ratio of reserves to production for 𝑖𝑡ℎcompany and 𝜀𝑖 is the random error component.
Dependent variables outProd Represents the company's total annual production, calculated as the sum of oil and gas production measured in tons of oil equivalent. In this study, the SFA and DEA methods were supplemented by financial analysis of the sample companies. The method of semi-structured in-depth interview was also used to provide the perspective of industry experts' answers to the research question of the study.
Data description
- Sample description: SFA and DEA methods
- Descriptive statistics
- Sample description: In-depth interview
The final sample consists of 11 companies representing about 90% of the total oil and gas production in Russia. This is mainly among the amount of reserves belonging to each oil and gas company. Companies such as Gazprom and Rosneft, the largest producers of gas and oil in Russia, have a resource base of approximately 17274B tonnes of oil equivalent respectively.
Due to the huge resources, their production is much higher than that of oil and gas companies with 24.2 billion reserves and these companies employ much more labor to support their production processes - about 469600 thousand people. Given the large difference in results, the median statistics will be more accurate than the average when talking about the average oil and gas company in Russia. Overall, the company produces 130.675 million tons of oil equivalent per year, employs 34908 thousand people, and has a resource base of about 686.14 billion tons of oil equivalent, which will last about 23 years if this business continues at the same rate produce .
It can be said that the study covers the best practices regarding the efficiency of the largest players in the Russian oil and gas industry and the insight into the efficiency in the oil and gas industry of the Big 3 consulting company. Therefore, the interview sample contains 6 respondents: 5 managers from the oil and gas industry and 1 consultant from of Big3 companies.

Empirical Results
- SFA method
- DEA method
- Results of in-depth interviews
- Financial performance and financial efficiency of the sample companies
- Discussion and Conclusions
The second model specification accounts for state ownership and the depletion policy of oil and gas companies. Meanwhile, respondents were asked to compare the advantages and disadvantages of national and private oil and gas companies. The average return on capital of Russian oil and gas companies turned out to be 13%.
To analyze the liquidity of Russian oil and gas companies, current and quick ratios were calculated. In addition, the relationship between the efficiency of Russian oil and gas companies and the share of state ownership was also studied. H2: The number of employees is positively related to the production of oil and gas companies.
H3: The share of state ownership is negatively related to the technical efficiency of oil and gas companies. H4: The ratio of reserves to production is negatively related to the technical efficiency of Russian oil and gas companies. The results of the study indicate that labor and oil and gas reserves are indeed positively related to the production of oil and gas companies.
Nevertheless, both under SFA and DEA methods, the most common hypothesis of previous studies that the share of state ownership is negatively related to the technical efficiency of oil and gas companies is rejected. Finally, there is an outline of some techniques that Russian oil and gas companies are currently using or starting to use to increase their efficiency.

Theoretical and managerial implications
The results are already encouraging: the utilization rate of some areas of the field has increased from forty-eight percent to sixty-five percent (Gazpromneft 2017). Finally, Slavneft sees the use of big data and machine learning as one of the key efficiency drivers. Since this association has been shown to be significant, we can include it in models with a broader sample, such as an international one, to further test it.
First of all, the methods of SFA and DEA can be used by managers to measure the effectiveness of individual existing projects in the company. Efficiency analysis can be one of the objectives of this decision, especially for large national companies that have a large field base: identifying best practice fields and outsiders will help not to cut too much the production of the most efficient fields or put them in abeyance, which can cause total quality damage of produced hydrocarbons. Second, the decision to lay off the workforce to reduce costs sometimes results in actual costs.
Dividing the field base according to efficiency results will help not to lay off the core workforce on projects where all work is being used most productively and, at the same time, to identify projects where fewer workers can perform the same amount of work for him. optimize workforce numbers. Third, the proposed efficiency measures can also be used as metrics by financial professionals when making an investment decision for project expansion or establishment. Additionally, efficiency metrics can also be used in the budget justification process, where before budgeting a new drilling rig or hiring additional labor can be performed to see if these additional resources are actually needed to spend money.
Limitations
Therefore, the research aimed to identify factors influencing the efficiency of Russian petroleum companies and to examine the relationship between the share of state ownership and the efficiency of Russian oil and gas companies. Next, the application of methods of efficiency measurement in the oil and gas industry was analyzed and methods of Stochastic Frontier Analysis (SFA) and Data Envelopment Analysis (DEA) were selected for the empirical study. Based on identified methods, the empirical study of factors related to the efficiency of oil and gas companies was conducted.
The proportion of state ownership in Russia is not significant in explaining the efficiency of oil and gas companies. Depletion policy for oil and gas companies has a significant impact on the company's efficiency: higher reserves relative to production ratios imply lower efficiency results. Therefore, the efficiency of state-owned enterprises in emerging markets should be examined more closely.
Since the study focused on the specifics of the Russian oil and gas market, the results should not be generalized to other markets. Retrieved from https://www.reuters.com/article/us-china-gas- exchange-q-a/qa-what-is-a-gas-trading-hub-and-how-are-they-established-. Retrieved from https://www.spglobal.com/platts/en/our-methodology/price-ratings/lng/jkm-japan-korea-marker-gas-price-assessments.
Estimation of the model specification 1 (SFA)
Estimation of the model specification 2 (SFA)
