Introduction
This leads to the formation of intermolecular disulfide bridges, therefore, destabilizing the protein structure by non-optimized evolutionary interactions and causing protein denaturation. This leads to the exposure of cleavage sites and initiation of the process described above, ending with the formation of aggregates in the cytoplasm. This loss of function due to oxidative stress leads to the overexpression of TDP-43 as it self-regulates its expression at the transcriptional level through a negative feedback loop, as shown by Ayala et al.[ 22 ].
The aim of this work is to study the aggregation status and structural stability of the second RNA recognition motif RRM2 of TDP-43 protein under oxidative stress. In order to reveal aggregation status of RRM2, the diffusion measurements based on analysis of 1H,15N HSQC spectra of the protein are used. Calculation of the diffusion coefficient, molecular mass and the hydrodynamic radii of the diffusing particles.

Theoretical background
NMR diffusometry of proteins
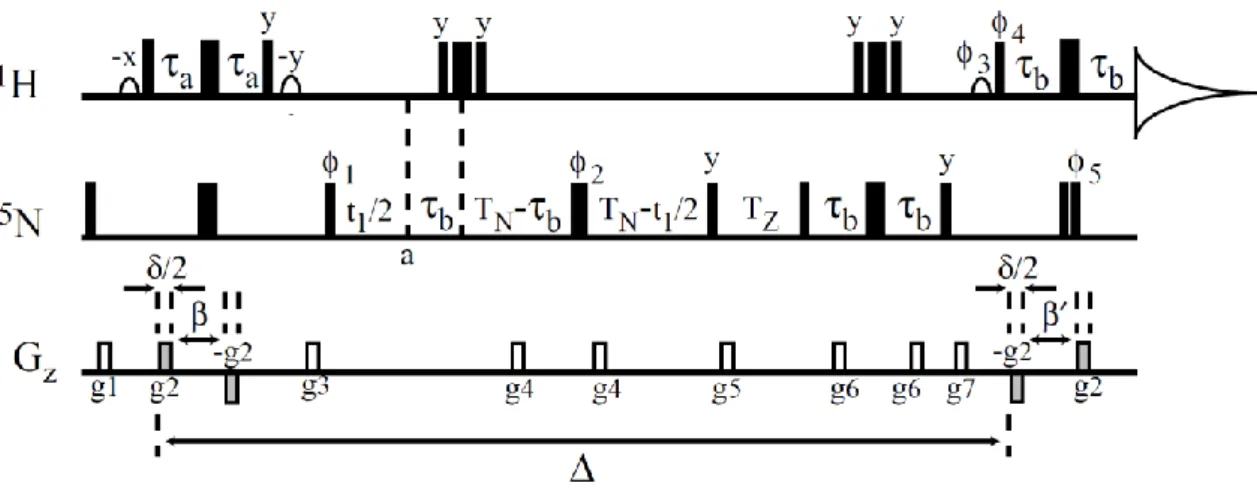
𝟑(𝝂𝟐+🝜 water per gram of protein). The best way to experimentally measure the protein diffusion coefficient is to use PFGSTE with 15N filtering pulse sequence [23], which is shown in Fig. The first pair of antiphase gradient pulses in this sequence encode the current location of the magnetic moment from its Larmor frequency, while the second pair of antiphase gradient pulses decode the new location of the molecules to which it is distributed during the diffusion time.
We obtained the diffusion coefficients by fitting the decay of the echo amplitude with the increase of the gradient strength to the modified Stejskal–Tanner formula. It is worth noting that we could have obtained the diffusion decay by gradually increasing the diffusion time or the duration of the magnetic gradient. However, implementing such methods would lead to a different relaxation contribution in each step of the experiment, which would make the experimental data more difficult to analyze.
Temperature denaturation of proteins
With the increase of the protein solution temperature, the protein begins to unfold (Fig. 6) which, as mentioned above, leads to a decrease in the distribution of its chemical shifts and consequently its spectrum becomes narrower (compare panels A and B of Fig. This effect can be used to study the effect of the temperature increase on the protein structure Protein denaturation: (A) a protein in its original state with a large distribution of chemical shifts due to diversity of chemical environment of protons; (B) the unfolded state of the protein with a number of conformations and a bad distribution of chemical shifts due to the averaging of the different unfolded states.
The position of the transition indicates the stability of the protein, while the width indicates the cooperativity of this transition [27]. The autocorrelation function of a spectrum shows the correlation between this spectrum and a shifted copy of itself as a function of the delay between them. It is usually used to find repeating patterns in a signal, but for this study it will be used to extract information about the temperature denaturation of the protein out of its spectra at different temperatures.

Materials and methods
After the spectra of the control sample were recorded, it was treated with 5 mM H2O2 for 24 h. Finally, after recording the spectra of the oxidized sample, it was reduced with 25 mM DTT for 24 h, and then the spectra of the reduced sample were recorded. After the temperature change, the sample was equilibrated for 15 min before the next spectrum was recorded.
Results and discussion
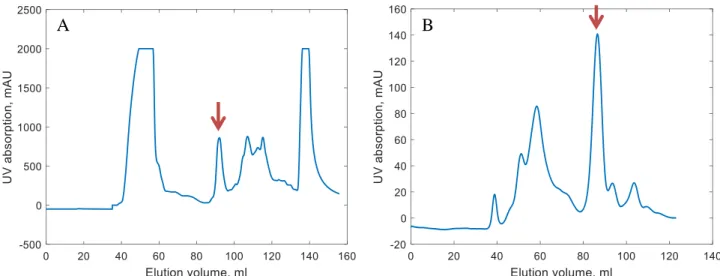
RRM2 purification
The giant peak at < 250 nm is due to the UV absorption of the cuvette. In all experiments a concentration of 1 mM RRM2 was measured before further procedures. The data obtained from the NMR spectrometer can be analyzed using various software packages to obtain the relevant molecular properties of the sample.
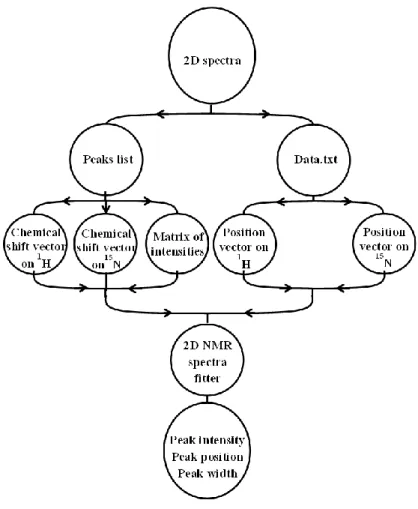
The need to use Matlab for 2D NMR spectra fitting was the motivation to create 2D NMR spectra fitter. 2D NMR spectra fitter” is a toolbox [29] that allows the researchers to fit 2D spectra and obtain their parameters. 1D NMR spectra can be used to obtain a lot of useful information about the atoms, but it suffers from peak overlap when the system under study is non-trivial.
After recording the NMR spectra of a sample, the spectrometer interface organizes the recorded data into a file. The imported files consist of a chemical shift axis, intensity values, and a peak list with the peak position vector. We created a new Matlab function readNMRData, which imports NMR spectra into Matlab and records them in a matrix data structure for further use.
The function (Approximation) also returns a cell array (coefficientMatrix) containing each peak's parameters and the calculation uncertainty. Then, 2D NMR spectrofits were used to approximate the generated peaks with 2 Gaussians (see Fig. 11B). An example implementation of 2D NMR spectrafits: (A) the generated 2D spectrum consisting of two 2D Gaussians with the parameters listed in Table 2; (B) the approximated spectrum with two Gaussians.
Implementation of 2D NMR spectra fitter: (A) the fragment of a 2D 1H,15N HSQC spectrum of RRM2; (B) The approximation result with the estimated peaks without noise.

NMR diffusometry on control, oxidized, and reduced samples
The diffusion decay of each sample was obtained by plotting the integral of the 1D spectrum of the protein as a function of the magnetic gradient G. A) Series of spectra used to calculate the diffusion coefficient of the control sample. The NMR spectrum of the oxidized sample consists of many fewer peaks than the control sample (see Figure 22 and Figure 17). In Figures 18 B, 19 B, and 20 B, we can see the diffusional decline of the spectral integral of the control, oxidized, and reduced samples with increasing magnetic gradient strength.
The diffusion coefficients of the control sample and the oxidized sample are approximately the same within two standard deviations 𝑚2/s). The obtained spectra were used to calculate the diffusion coefficient for the protein as a whole or each amino acid residue separately. The diffusion decay of each sample was obtained by plotting the decay of the spectra volume with the increase of magnetic gradient strength G.
The diffusion decay of the monomer spectra volumes peaks in the spectrum of the control sample with increasing magnetic gradient. Diffusion decay of spectral volumes of aggregate peaks in the spectrum of the oxidized sample with increasing magnetic gradient. Diffusional volume decay of monomer spectra peaks in the spectrum of the reduced sample with increasing magnetic gradient.
This indicated that the diffusion coefficient of the particles in oxidized sample is smaller than the diffusion coefficients of monomers in control and the reduced samples. The diffusion coefficient of each sample was obtained by approximating diffusion decay with modified Stejskal-Tanner formula. Diffusion coefficients measured by the signal of the amino acid residues of the control sample.
Diffusion coefficients measured by the signal of the amino acid residues of the reduced sample. 32 and 33, the diffusion coefficients measured by the signal of amino acid residues of the reduced sample are more diffuse than those of the control sample. NMR diffusion measurement was used to obtain the diffusion coefficients of the protein in the control, oxidized and reduced samples.

Temperature denaturation of RRM2 in control and oxidized samples
Using these radii, we can estimate the aggregation state by calculating the ratio of the volumes of the diffusing particle of the samples (volume ∼R3). To obtain the necessary information from the spectra narrowing and quantitatively assess the folding of proteins, the autocorrelation functions (e.g., this region was chosen because the secondary structure of the protein, which is in the amide region, influences the dispersion of chemical substances changes drastically). shifts due to temperature denaturation, while the aliphatic region does not undergo this dramatic change.
Oxidized RRM2 spectra have less intensity because part of the monomers in the oxidized sample form the aggregates. Proton spectra of the amide region of the control sample (black), an oxidized sample that was oxidized for 2 h (blue), and an oxidized sample that was oxidized for 5 h (red). Intervals from 0 to 0.5 were not considered as they contain information about the width of the peaks rather than the width of the amide region.
When we shift and multiply a copy of the spectrum by 1.5 ppm, we have multiplied the right edge of the spectrum (which consists of small peaks) by the 8-8.5 ppm region of the spectrum (which has intense peaks). Same for the left edge of the amide region, we multiplied it by the 8-8.5 ppm region of the spectrum (see Fig. 39). The chosen interval of shifts between spectra for integration is sensitive to the narrowing at the edges of the amide region.
Integrals of the autocorrelation function of the amide region of the control and oxidized samples. The oxidized protein reaches half height at 62.5 °C, while the control sample reaches the same height at around 70 °C. The calculated integrals showed S-shaped transitions from the native to the denatured state with increasing temperature.
However, the transition of the oxidized sample occurs at a lower temperature than the transition of the control sample.

Concluding remarks
Acknowledgements
Proteolytic processing of TAR DNA-binding protein-43 by caspases produces C-terminal fragments with disease-defining properties independent of progranulin // J. Folding of the RNA recognition motif (RRM) domains of amyotrophic lateral sclerosis (ALS)-related protein ) TDP- 43 Reveals an Intermediate State // J. Redox Signaling Directly Regulates TDP-43 via Cysteine Oxidation and Disulfide Cross-Linking: Oxidative Stress Regulates TDP-43 // EMBO J.
Disruption of nuclear and cytoplasmic TAR DNA-binding protein (TDP-43) induces disease-like redistribution, sequestration, and aggregate formation // J. Molecular size distribution within an unfolded state array using beam scattering Small-angle X and pulse field gradient NMR techniques // J.
Supplemental information