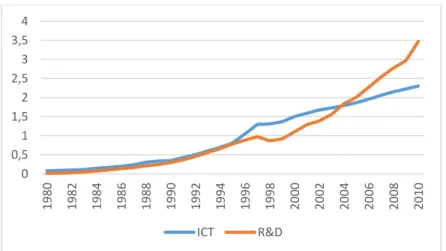
Total input growth is therefore a weighted average of the growth rates of these individual inputs. Similarly, total output growth can be calculated as a weighted average of the growth of individual outputs. ICT capital in the industrial sector is also high, ICT capital is included as one of the inputs.
The model is specified to use the optimal levels of the variable inputs materials (M), energy (E) and labor (L) and the quasi-fixed inputs ICT capital (ICT) and non-ICT capital (K). The detailed decomposition of the TFP is provided in Appendix B based on the Lemma developed by Nadiri and Prucha (1990). The CU measure above implies a deviation from unity due to the quasi-fixed effect of capital on the short-run temporary equilibrium.
A detailed description of the data used in this study and the constructed variables are reported in Table C.1 in Appendix C. The hypothesis of no adjustment costs for the quasi-fixed inputs K and ICT, ̇ ̇ and ̇ ̇ is thus rejected. . The negative signs of quasi-fixed inputs of ICT and non-ICT capital in the labor and energy demand functions indicate that ICT and non-ICT capital are substitutes for labor and energy use.
Failure to include these terms would lead to misspecification of investment models and inconsistencies in estimates of other technology parameters (Nadiri and Prucha, 1990).
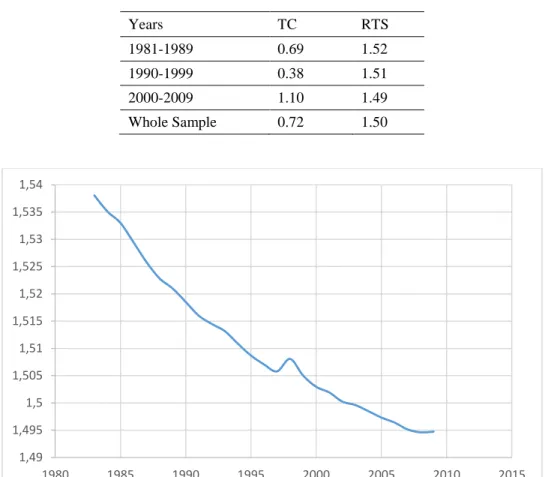
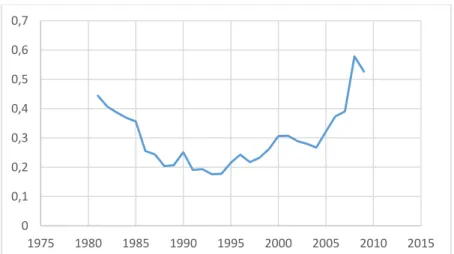
Technical Change
The pace of technical change increased rapidly in 1990–1999 in the wake of the Asian financial crisis, but declined again between 2000 and 2009. are classified as low-tech, only three are aimed at the domestic market and only one has low R&D expenditure. The own and cross price elasticities of the inputs for 1995 for the industrial sectors sampled are shown in Table C.4 in Appendix C.
The inherent price elasticity of ICT capital is the greatest of all inputs, followed by non-ICT capital, labour, energy consumption and materials. Although the cross price elasticities are smaller compared to its own price elasticities, some are nevertheless significant (for example, the elasticities of ICT capital with respect to the wage rate, energy price and material price). Moreover, the own price elasticities of all inputs except ICT capital are inelastic (less than one).
Because ICT and non-ICT capital are treated as quasi-fixed factors, there is no short-run adjustment (ie, their short-run elasticities are zero). In the long run, the own price elasticity of demand for non-ICT capital (ICT capital) is inelastic (elastic); therefore, ICT capital has a substitution relationship with energy consumption and labour. Many studies in manufacturing and technical processes have also indicated that investing more in ICT capital significantly reduces energy consumption (Cho et al., 2007; Erdmann and Hilty, 2010; Røpke and Christensen, 2012).
Finally, the elasticity of ICT with respect to energy consumption is greater than the elasticity of energy consumption with respect to the wage rate, implying that ICT is more highly substitutable with energy consumption. Long-run elasticities of inputs exceed their short-run values and thus reflect considerable economies of scale. Output elasticity patterns show that labor and materials respond strongly to short-run changes in output because labor, energy consumption, and materials exceed their long-run equilibrium values in the short run to compensate for the slow adjustment of quasi-fixed factors.
In short, they are slowly adjusting to their long-term equilibrium values while ICT and non-ICT capital adjusts. Indeed, the positive output elasticity of energy consumption suggests that economic growth leads to higher energy consumption. Thus, while economic growth can improve productivity per unit of energy use, it increases overall energy consumption and CO2 emissions.
TFP Growth
There are also differences between the short- and long-run own-price elasticities of all the variable inputs, suggesting a slow adjustment to long-run steady-state levels. These results are consistent with the finding of Park and Park (2003), who argued that Korean industries are increasingly deploying ICT in order to reduce the use of labour, and thus that skill-biased technological change is emerging. In other words, the use of ICT, while replacing low-skilled labour, creates high-skilled complex jobs.
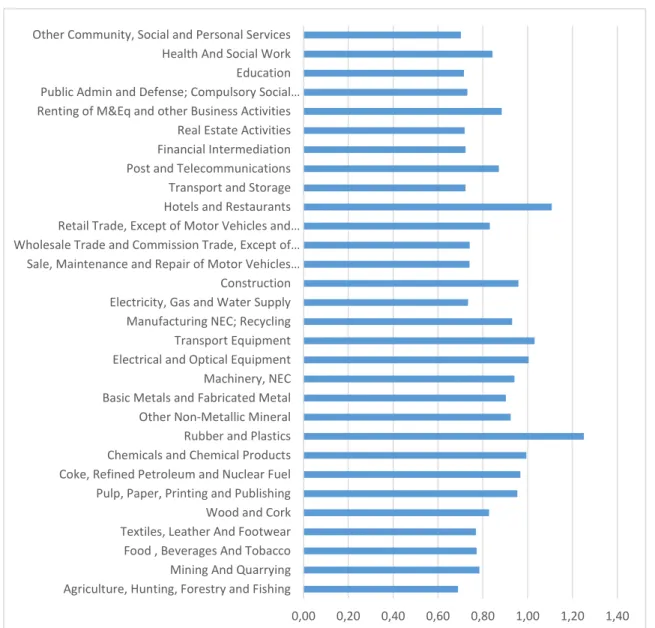
The contributions of inputs, technical changes and adjustment costs to output growth are reported in Table 5 (the decomposition is based on the approximation in equation (B.2) in Appendix B). We find that the average growth rate in production is approx. 7.3 percent per year over the entire sample period, while the effect of technical changes on production is only 0.7 percent on average. The highest contribution rate is energy consumption, followed by labor and materials.
In addition, non-ICT capital has a greater impact than ICT capital, which is reasonable given the proportion of ICT capital in total capital. These results are also consistent with a similar study conducted by Pyo et al. 2007), who reported an average output growth rate of 9 percent.
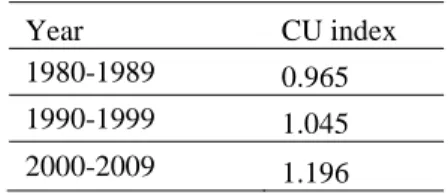
CU Index
This result shows that output lies to the right of the minimum point of the short-run average total cost curve, thus driving cost-reducing net investment for the last two subperiods and increasing net investment cost during 1980-1989. This study has modeled the structure of production and the input behavior of the factors affecting production. By including ICT capital, the model was thus able to capture the technological characteristics of the sample industries.
The reactions of the factors of production to a change in factor price and output in both the short and long run are similar. The ratio between actual and optimal energy consumption was negative for the first two sub-periods of the data set, but over-consumption in the third sub-period. The era of globalization in the 2000s was then the last stage of the economic growth process in Korea, where growth was mainly driven by technological progress and innovation.
An individual industry can still improve efficiency by catching up with the best practice frontier for the industry globally. As recommended by the IEA (2012), Korea may also be able to strengthen its efforts to improve data collection and analysis for monitoring and evaluating the results of the impact of energy efficiency policies across all sectors of the country's economy. For example, the recent implementation of the district heating system by the Korean government to supply 1.8 million households has already begun to improve energy efficiency at the home level.
An Empirical Analysis of the Effect of Inter-Industry Diffusion of Information and Communication Technology on Cost and Labor - The Case of Korea. A Reflection on the East Asian Development Model: Comparing the Experiences of South Korea and Taiwan, in: Richter F-J (Ed), Thailand, Japan and the East Asian Development Model. The depreciation rates of ICT and non-ICT capital are μ and δ, respectively, and r denotes the discount rate.
Marginal adjustment costs must be zero in the quasi-fixed input steady state when ΔK and ΔICT are zero. Introducing the assumption of resolution of quasi-fixed inputs will simplify the derivation of the dynamic factor demand model. The convexity and concavity conditions of the normalized bounded cost function under the resolution assumption imply that ̇ ̇ ̇ ̇ and.
Substitution of the stationary solutions of the Euler equations (A.5) and (A.6) and the fitting coefficient forms (A.7.1) Wrong. The entire system of equations to be estimated consists of the two quasi-fixed inputs (K and ICT) and three variable inputs (L, E and M) presented in equations (A.8)–(A.12) Real non-ICT capital stock (translated to 2005 prices) is taken from the Korea Industrial Productivity 2012 database9.
The physical share of non-ICT capital is calculated after deducting the real share of ICT capital.