This study reviewed the preprocessing pipeline for dMRI versus IVIM analysis in the brain. Second, I would like to express my sincere thanks to my supervisors, Oscar Jalnefjord and Louise Rosenqvist, for their guidance, support and encouragement throughout my thesis on signal drift correction for intravoxel incoherent motion analysis in the brain. The MR signal obtained from in vivo dMRI is not a pure representation of diffusion, as it also includes signals from microcirculation in the capillaries, which is most noticeable at weaker diffusion encoding.
IVIM is a non-invasive approach to quantification of perfusion and is currently in the development stage and is not yet in routine clinical use. Estimation of IVIM parameters is generally a difficult task, especially in the brain, where the proportion of signals from blood is only about 5% [3]. Obtaining reliable parameter estimates from the low perfusion signal requires minimizing any bias in the estimates.
Pre-processing in this context can be defined as any type of correction performed in the image domain or frequency domain after data acquisition and before performing parameter map calculations or analysis.
Basics of the MR signal
Diffusion-weighted MR signal
Intravoxel incoherent motion
The purpose of this chapter is to discuss and summarize these steps and their relevance to IVIM brain analysis. The human head contains not only the brain, but also other organs and the skull. Therefore, the first step of preprocessing is often the extraction of brain tissue, removal of the skull and non-brain tissues.
Corrections for movements and distortions can have a particularly significant impact on brain extraction. This is possible since the signal intensity from fat, muscle tissue, and skull is lower than the brain signal in a fat-suppressed EPI. The Oxford Center for Functional Brain MRI provides a software library (FSL), with a brain extraction tool (BET) [8].
Based on assumptions about the shape of the brain and by estimating intensity gradients, the sphere is iteratively reshaped and updated until it reaches the inner surface of the skull.

B-Matrix incompatibility with the imaging data
Signal drift correction
Gibbs ringing correction
Noise distribution bias correction
Denoising
Between-volumes motion correction
Within-volume motion correction
Eddy current-induced distortion correction
Outlier detection
Susceptibility distortion correction
EPI Nyquist ghost correction
Gradient deviations: Gradient nonlinearities & gradient miscalibration . 11
Although both corrections are based on high b values, a similar approach can be used for IVIM. This is a very straightforward method which cancels the bias field and can be applied to IVIM. B1 bias field correction has not received much attention as a preprocessing step for dMRI, since the problem has been solved by normalization against b0 image.
However, there are software packages such as FSLs that take bias field correction into account. For dMRI analysis, this step is more of an option than a necessity, provided strong head motion and high magnetic field strengths are absent. Depending on the situation, B1 field correction may be relevant IVIM, for example when analyzing data with multiple echo times.
Spatial normalization
Summary
To obtain robust Intravoxel incoherent motion (IVIM) parameters, it must be ensured that the observed signal decay is not affected by confounding factors such as signal drift. In the presence of signal drift, an overestimation or an underestimation of the signal decay will be measured, leading to inaccurate results for the IVIM parameters. This chapter describes two correction methods: a temporal correction and a spatiotemporal correction, which aim to address the signal drift.
IVIM is a model used to quantify and differentiate diffusion and perfusion effects seen on diffusion-weighted MR images at lower b-values (b<1000 s/mm2). Among the diffusion characteristics, the IVIM model provides an estimate of the perfusion fractionf, which describes the proportion of the total signal decay due to perfusion. Accurate parameter estimation in diffusion-weighted imaging relies on the availability of high-quality data.
However, these images are prone to artifacts, and the perfusion signal, which constitutes a small percentage of the total signal, may be particularly susceptible to these distortions. To investigate signal drift in this thesis, the pixel values for all non-diffusion-weighted images (b0 images) for each scan and subject were extracted and tracked over time. The signal from the b0 images must be unchanged regardless of when they were acquired and systematic deviations from this are what define signal drift.
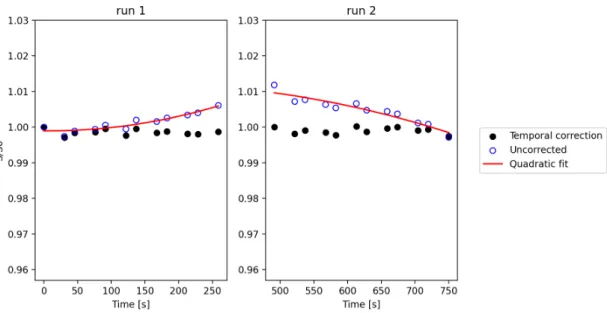
Occurrence of signal drift in dMRI has been previously reported and correction methods have been proposed. The results showed a 5-6% drift in signal over a 15-minute scan session, with a quadratic effect over time. This led to the proposal of a temporary correction built on the assumption that the signal dispersion can be estimated with a quadratic fit.
This finding led to the proposal of a correction method that is responsible for this spatial variation, namely spatio-temporal correction. The secondary aim of this thesis was to investigate the occurrence of signal drift in diffusion-weighted imaging suitable for IVIM analysis at our laboratory in the Sahlgrenska University Hospital and to evaluate the effectiveness of correction methods using temporal and spatiotemporal approaches , as suggested by Vos et al.
Method
- MRI aqcuisition
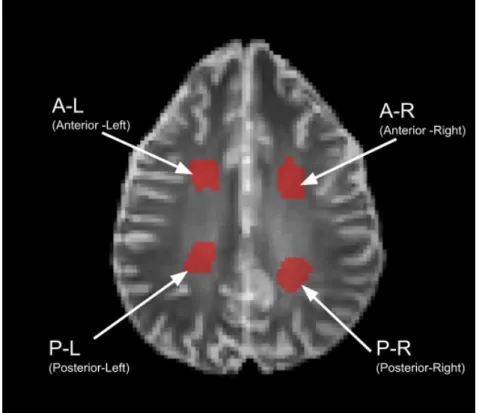
- Brain extraction and ROI
- Temporal correction
- Spatio-temporal correction
- Parameter maps computation
The signal drift was estimated by a quadratic fit of the average pixel value of the b0 images with the following expression. Note that this is a global correction, so the same correction was applied to each voxel. The spatio-temporal correction is an extension of the voxel-level temporal correction with respect to spatially fluctuating signal drift [11].
To investigate how the perfusion fraction varied with signal drift and corrections, parameter maps were reconstructed. S(0) = (1−f)e−bDtissue+f e−bDblood−α2v2d (4.7) where α is the flow weighting factor and vd is the velocity dispersion and Dblood is the diffusion coefficient of blood (1.75µm2/ms) . In addition, the images for IVIM-FC and IVIM-NC were combined into one image before the parameter maps were calculated according to the model.
The perfusion fraction was examined by averaging f over region A-L described in Figure 4.1 for each scan protocol. To investigate how the temporal and spatio-temporal corrections affected the perfusion fraction, the result was normalized to the uncorrected data.
Results
Temporal correction
The uncorrected b0 signal showed a decaying signal in both runs, view of run 1 (left) and run 2 (right). For the flow-compensated IVIM-FC scan, the signal drift during process 1 increases with time, with a maximum loss of 2.02% observed, see Figure 4.4. On the other hand, the second run does not follow the same pattern with a maximum signal deviation of 0.27.
Although both IVIM-FC (figure 4.4) and IVIM-NC (figure 4.5) use the same b-values, a difference in trends of the signal drift can be observed. For IVIM-NC, the signal drift is greater for the second run compared to the first, while the opposite can be observed for IVIM-FC. The uncorrected b0 signal showed a clear signal decrease in run1 (left) and less clear signal decrease in run 2 (right).
The uncorrected b0 signal showed a minimal signal decrease in run1 (left) and a more pronounced signal decrease in run 2 (right). The uncorrected b0 signal showed greater spread in signal drift for direction 1 (left) and minimal signal drift for direction 2 (right). The data showed an anomaly with a larger spread of signal shift in the b0 images for run 1 (left).
The uncorrected b0-signal showed minimal signal drift during procedure 1 (left) and an increase in signal during procedure 2 (right). The uncorrected b0 signal showed a decrease in signal during run 1 (left) and an increase during run 2 (right). The signal drift for sIVIM (Figure 4.8) shows the minimum signal drift during run 1 and the increase in signal magnitude for run 2.
In the case of IVIM-10b in Figure 4.9, the signal offset does not show the strong negative signal offset observed in other volunteers for.
Spatio-temporal correction
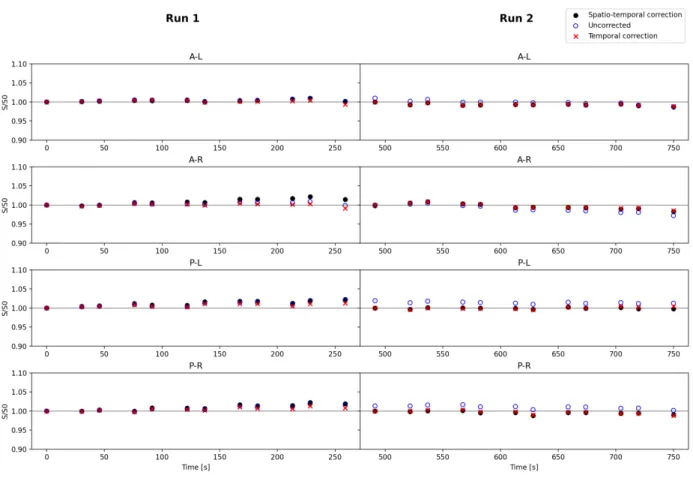
It should be noted that the temporal correction performs better to correct for signal drift in this scan. The maximum signal drift observed in spatio-temporal corrected data was 5.96% in P-L (run 1), the signal drift in the uncorrected data in this scan and region was 3.96%. On the other hand, the maximum signal drift observed in this region and run for temporally corrected data was 1.18%.
The maximum signal drift in the uncorrected data was observed in region A-R (run 1) at 1.40%, while the maximum drift in the spatio-temporally corrected data within this region was 2.40%. The signal drift in this region for the spatio-temporally corrected data was 2.60% and 1.44% for the temporal correction. For comparison, the maximum signal drift was 1.67% with spatio-temporal correction and 3.40% with temporal correction.
The maximum signal drift in spatio-temporally corrected data for this region and run was 0.44%, while the maximum signal drift in temporal correction was 0.86%. For IVIM-FC in Figure 4.17, the maximum signal drift in uncorrected data was observed in region A-R for run 1, at 2.24%. The reason for this is that the chronological order of the b0 images is necessary to study the signal drift over time.
Temporal signal drift was observed for all investigated protocols: sIVIM, IVIM-10b, IVIM-FC and IVIM-NC. The maximum magnitude of signal drift for all but one volunteer was observed for the IVIM-10b protocol. The temporal correction improved signal stabilization and reduced signal drift for most scans.
The spatio-temporal correction analysis revealed that there was no spatial bias of the correction method and the signal drift effect between the white matter regions examined. While the temporal correction did not enhance the signal drift to the same degree as the spatio-temporal correction, it is not necessarily a superior correction method because it does not address the spatial variations of the signal drift. While the temporal correction and the spatio-temporal correction can help reduce the effects of the observed signal drift in IVIM data, they are unable to completely eliminate it.
There are cases where the corrected data may amplify the effects of signal drift more than the uncorrected data.