In this project, two eye trackers, The Eye Tribe and Mirametrix S2, are used to acquire eye tracking data for visualization. We implement a software prototype that includes a user interface to control the flow of the eye tracking data between the eye trackers and OnGraX.
Background
After collecting eye tracking data and user view based data, heatmaps are used as a visualization technique to visualize data. One of the most common visualization techniques used by researchers for eye tracking studies is a heat map.
Previous Research
They explain another architecture that has several advantages over other methods used to analyze eye gaze data. With this research, they introduced an infrastructure that can automatically evaluate the eye gaze data of multiple users and eye trackers, as well as provide visualization support for dynamic fields of interest.
Problem Formulation
Motivation
Research Questions
RQ3 How can the heatmap quality in OnGraX be improved by using the eye trackers. RQ2: By including this research question, we want to find out about any problems or limitations that we personally see with the use of the eye trackers (in relation to our research), to be able to document them and inform future researchers and users.
Scope/Limitation
RQ1: With this question, we want to compare the two trackers in terms of usability, quality and effectiveness of APIs. RQ3: With the third research question the aim is to see if the quality and accuracy of the heat map from the user's views is improved or not with the use of eye trackers.
Target Group
Outline
In our research work, we will mostly use an incremental research strategy, as we will improve the implementation gradually based on observations. To learn more about our research questions, we will design experiments/tests conducted in a controlled environment.
Scientific Approach
We will then collect the data we get from both eye trackers and use it to prove some questions like which eye tracker is better and what are their limitations. In this user study, several users will be asked about their experiences with the trackers and developed visualizations.
Method Description
Software Development Methodology
Third, we will implement the iterations according to the requirements defined in the previous steps. In this step, we will also design and implement the GUI windows for eye tracking and logging.
Brief Explanation of the User Study Structure
In this step we are going to implement everything that we have planned and discussed with our supervisors. For this project, the user research we are going to do at the end is related to this phase.
Reliability and Validity
Seven of these questions are in Likert scale, and the last question is an open question where users write their own opinion about the experiment.
Ethical Considerations
In the questionnaire, their names, age, gender and the subject of their investigations are requested. We will mention the last three pieces of this information and leave out their names for reasons of anonymity. The first is from a company called The Eye Tribe, and the second from Mirametrix.
The Eye Tribe
Software
Calibration
Mirametrix S2
Calibration
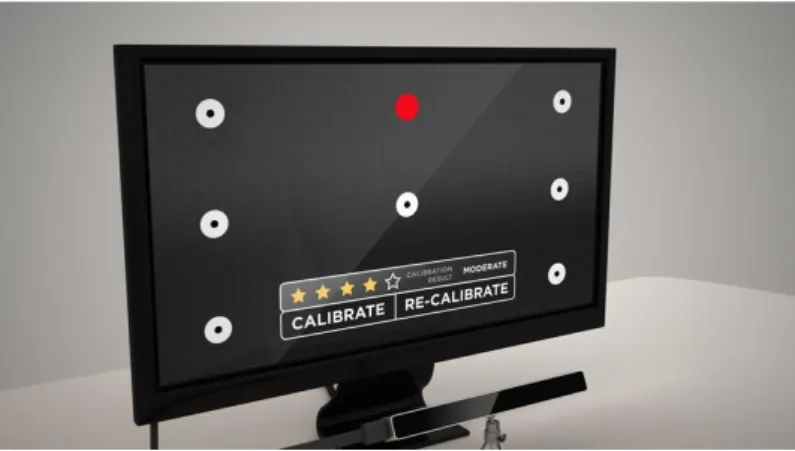
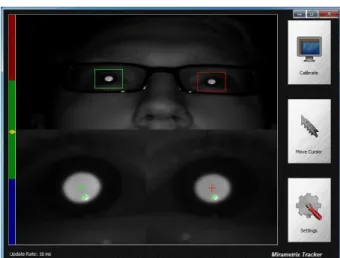
During calibration (see Fig. 3.3), the server will send the results for each point to the client. The tracker must be located under the screen of the computer being used, or in front if it is a laptop. For better results and performance, the tracker should be placed about 65 cm from the user, and it should be used far away from windows and infrared light [24].
Software
The bar on the left estimates depth, which indicates when the user's head position is in the perfect spot, which is on the green in the center of the bar. The Calibrate button at the top starts the calibration process, which is required once for each user or if the tracker is moved from its position. The Move Cursor button can be used when the user wants to associate the mouse pointer with the user's view on the screen to give the user visual feedback [25].
Here there is the Server Configuration section, where we can see the Port box with the default server port, which can also be changed by the user. There are also Select Monitor and Calibration Ports where the user can select the calibration points (the default is nine, but there is also an option for five, although this results in a loss of accuracy).
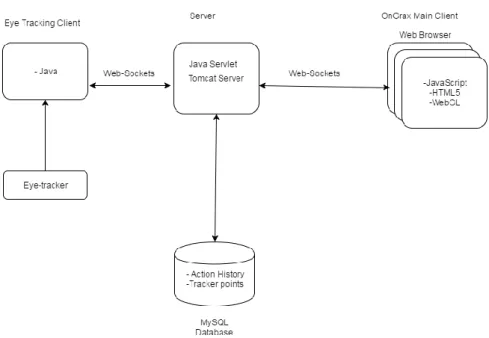
General Explanation of the System Architecture
Adapting the APIs of the Eye Trackers
The Eye Tribe Tracker
During this process, the Eye Tribe server must be running, otherwise the system will not continue the process. Raw coordinates are the coordinates that the tracker sends directly without any process, while the user is looking somewhere on the computer screen. This can happen due to some calibration errors, flickering, or the tracker misses a frame during a session, etc.
The 2D coordinates are received by the view manager as raw coordinates, and then they are ready to be called from.
Mirametrix S2 Eye Tracker
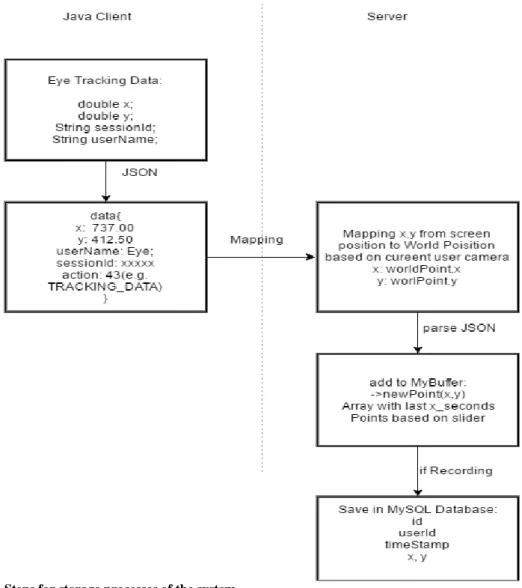
Transmission and Storage of Eye Tracking Data
- Login Process
- Storing the Eye Trackers Data
- Identifying Focused Graph Objects Based on Tracker Data
- Basic Heatmap Creation from the Live Tracking Data during a Session
- Recording Process of the Eye Tracking Data
The name and password sent to the server are the information that users enter in the fields of the login window of the eye tracking client. After the server receives the data from the login, the system will check if it matches the data from the database and on the OnGraX web page. Start/stop sending data, start/stop recording and login processes are implemented on the eye tracking client side of the project.
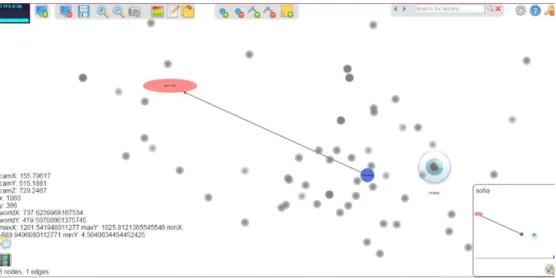
Another step in the data transmission is to transfer data from the server to the project's web content. In order to be able to calculate which points are inside the node, the width and height of the nodes are subtracted.
Eye Tracking Client User Interface Design and General Functionalities
It provides data as a percentage of the screen size, passes the data in XML-type strings, and can also provide coordinates for both eyes separately. The screen width and height values are taken from the system and used for the data conversion process. Additionally, during our user study, we found that the Eye Tribe tracker overheated quickly, which affected the device's calibration process.
For the Mirametrix S2, this window also shows the deviation of right, left and the average of the right/left view. Also during the calibration process for the Mirametrix S2 eye tracker, some users in our study (Section 5) mentioned that they had to open their eyes more for the tracker to see their eyes correctly.
The Task
Users Testing with The Eye Tribe and the Mirametrix S2 Eye Trackers
The last question is an open question where we asked the participants to write down their general comments about the experience with the eye trackers and the task. Before the arrival of the participants, we set the camera in the right position and prepared the graph that would be used for the testing. When they got there, we asked them to sit in front of the computer and introduced them to OnGraX and showed them another graph, so they could get used to the tool.
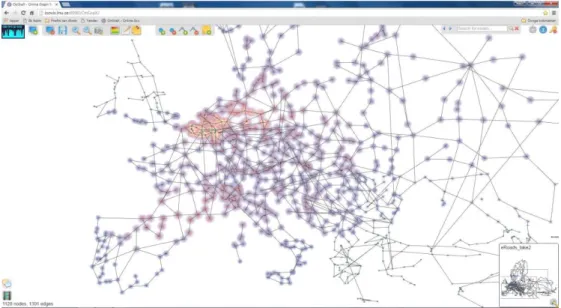
We then explained to them the task we would like to do and showed them a map of Europe in case they did not know the geographical location of the two cities. We then gave them their usernames and passwords and explained the order of steps they had to take to pass the test correctly: First, they logged into the OnGraX website with the given username and password and entered a graph called “eCeste”.
Results from Questionnaire
Question 1: How well would you rate the ability of the eye tracker following your eye movements. With the data from the first table, we can see that for Q1, most users chose six. They show the average of the values that the user gives to each Likert question.
Values selected for each of the Likert-type questions of the first group (Mirametrix S2) and standard deviation. The values that the participants of the second group (Eye Tribe) chose to answer the Likert-type questions and the standard deviation.
Analysis of Created Heatmaps
According to Data Collected from the Eye Trackers
For the first group with the Mirametrix S2 eye tracker, the average completion time was 4 minutes, and for the second group with The Eye Tribe tracker, 6 minutes. One of the biggest reasons for such a phenomenon is that the Eye Tribe tracker had trouble finding the user's eyes during the calibration. From this we can say that the Mirametrix S2 eye tracker gives more accurate results than The Eye Tribe tracker.
In Figure 5-5(A), we can see these extra points that the Eye Tribe tracker made while a node is in the user's focus. With this result, we can say that it is easier to understand the focus point of the user with the Mirametrix S2 eye tracker.
According to Data Collected from Viewports
According to our results, we realize that the Mirametrix S2 is more effective than the Eye Tribe tracker in our research. For the third research question (RQ3), and using the user survey, the answer would be that the heatmap quality of the viewports in OnGraX can be improved by using eye trackers, as they are more accurate in showing the user's focus points. That way, in case of a collaborative graph session (with other users), the rest of the users will see where each one is looking at exactly.
By carrying out our project, we can answer the last research question (RQ4) by identifying the nodes of the graph that are the focus of the user, so that they can be visually adjusted according to the wishes of future developers. This fact can also be applied to another research question, where the precise measurement of the limitations of eye trackers also gives quantitative results.
Future Research
From our results, by answering research question 1 (RQ1), we conclude that for our research, the Mirametrix S2 is a better choice for eye tracking. To answer this question more accurately, in the future there may be a measurement of the data collected and statistical analysis of it, and not just a comparison based on our experience and knowledge on the two trackers. 4] Ben Steichen, Giuseppe Carenini and Cristina Conati, “Adaptive Information Visualization – Prediction of User Characteristics and Task Context from Eye View”.
5] Ben Steichen, Giuseppe Carenini, and Cristina Conati, “User-Personalized Information Visualization – Using Eye Gaze Data to Infer Visualization Tasks and User Cognitive Abilities”. Proceedings of the 1993 IEEE Symposium on Research Frontiers in Virtual Reality, San Jose, CA, USA, 1993.
![Fig. 1.1 Commonly used heatmap, marking red the regions of interest. Screenshot taken from [32]](https://thumb-eu.123doks.com/thumbv2/5dokorg/19372029.0/9.892.273.704.175.410/fig-commonly-used-heatmap-marking-regions-screenshot-taken.webp)