Trade Dynamics and Trade Costs: First Evidence from the Database on Exporter and Importer Dynamics for Germany*. It shows the results for the dynamics of trade in goods for Germany as a whole and for trade with its two most important partner countries, namely France and China. In addition, it reports the results of the first empirical study looking for links between measures of trade dynamics (entry, exit and survival rates and the share of new entrants in total exports and imports) in export destination countries and import origin countries on the one hand and the characteristics of these countries ( distance from Germany, difficulty of foreign trade and market size) on the other hand.
The transaction-level data on German exports and imports used to compile the Exporter and Importer Dynamics Database for Germany is strictly confidential and can only be used in the research data center of the German Federal Statistical Office. The aggregated data from the exporter's and importer's dynamic database are available from the author upon request; data for exporters is also included in version 2.0 of the World Bank's Exporter Dynamics Database. The record of the transaction usually contains a company identification (tax registration number) of the exporting (or importing) company.
Using this identifier, transaction-level information can be aggregated at the trading company level to generate year-company-product-value-weight-destination (or origin) data. The other source is transaction-level data collected by customs on trade with countries outside the EU (so-called Extrahandelsstatistik).4 The raw data used to build the foreign trade statistics are transaction-level data, i.e. the registration of the transaction usually contains6 a company identification number (tax registration number) of the exporting (or importing) company.
The measures reported in Table 1 for Germany's total trade (and all other measures from the World Bank Exporter Dynamics Database) are available for trade of all goods with each country and for trade with all countries in any HS2 product (or product from any 3 digit -ISIC Category).
Trade dynamics and trade costs in German exports and imports
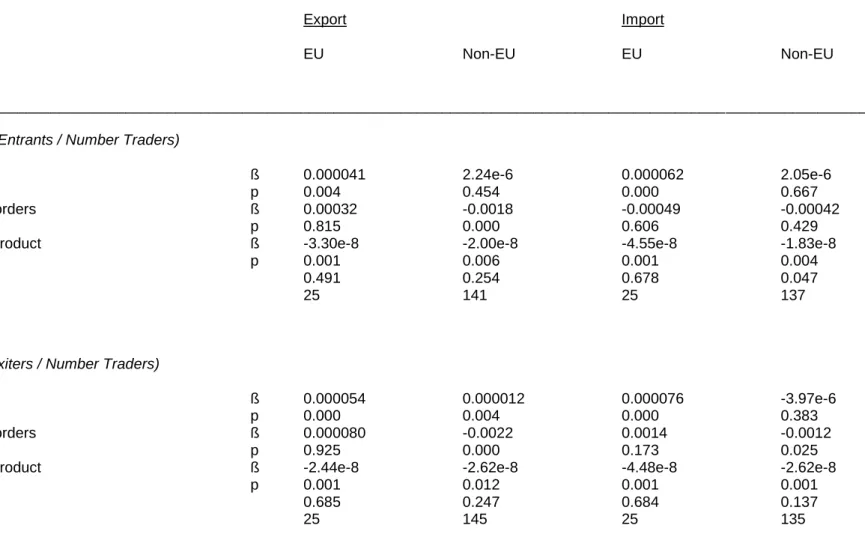
High values of R2 indicate that a large proportion of the variation in trade dynamics, which measures the entry rate, exit rate and survival rate, can be explained by the difference between countries in distance to Germany and country size. This link is much weaker for trade with much more heterogeneous non-EU countries. F3: For EU trade, distance to export destination country or import origin country is positively related to firm entry rate and firm exit rate, but negatively related to firm survival rate.
In exports from countries outside the EU, we find the same pattern of export dynamics as in exports to the EU, depending on the distance to Germany. The comparison of export dynamics for France and China shown in Table 1 is an example of this. Note that the pattern for importer dynamics in trade with non-EU countries is different – according to Table 2, distance is not at all related to measures of importer dynamics.
F4: For EU trade and non-EU trade, the size of the market in the destination. 8 Note that it is not appropriate to examine the magnitude of the effect of distance from Germany on trade. The same, of course, applies to any attempt to quantify the size of the effect of a ceteris paribus change in the index of trading costs or GDP.
F5: The share of trade entrants is smaller in larger markets for trade with EU countries and non-EU countries. This comes partly as a surprise, because by construction, a higher value of the index indicates lower bureaucratic barriers to exports, so tougher markets tend to attract more new exporters. Note that for non-EU imports, the index for ease of cross-border trade in a country of origin is generally unrelated to measures of import dynamics.
To my knowledge, and based on the extensive survey of the literature using transaction-level data to examine export and import activities in Wagner (2016a), this is the first empirical study that looks for relationships between measures of trade dynamics (in- , exit and survival rates and the share of new entrants in total exports and imports), in export and import destination countries and import origin countries on the one hand and characteristics of these countries (distance to Germany, foreign trade difficulties and market size) on the other page. The results reported in several papers based on the Word Bank's Exporter Dynamics Database (EDD), summarized in Wagner (2016b), illustrate that this database is a very useful addition to the toolbox available to empirical trade economists. Here, the major advantage of the EDD data is that it is strictly comparable across a large number of countries, which adds enormous value to any empirical exercise conducted with this data because.
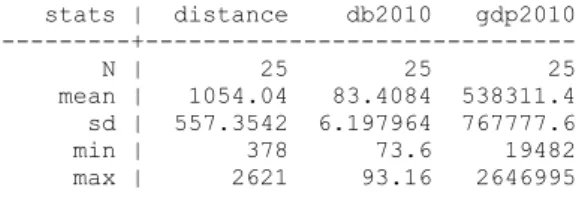
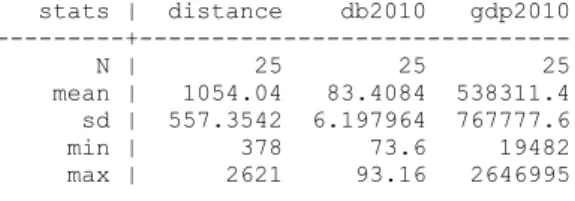
It would be great if a project comparable to the World Bank Exporter Dynamics Database (Cebeci et al. 2012) could also be realized for imports. Share of participants in trade (total trade value of participants/total trade value in that year). Distance is the distance between the country of destination (in the case of exports) or the country of origin (in the case of imports) to Germany; Trading Across Borders is an index of time and costs (excluding tariffs) associated with trade, where a larger value indicates lower costs; The gross domestic product refers to the country of destination (for exports) or the country of origin (for imports); for details, see text.
The appendix tables use the original variable names from the World Bank's Exporter Dynamics Database.