From my supervisor Dr Dorota Dworakowska MD (Hons) PhD, I received a PhD studentship, funded under a grant from the Polish Science Foundation, and also from the Endocrine Cancer Research Fund, Kings College Hospital Charity, managed by dr. Dworakowska. Materials and methods: Gene expression was assessed in the four cultured cell lines after proliferation experiments using the Mitochondrial Energy Metabolism Plus PCR kit from Qiagen which includes genes of respiratory complexes I - V and associated mitochondrial proteins.
Introduction
Mitotane: basis for understanding possible mechanisms of action
- Historical background
- Clinical effectiveness and clinical monitoring
- Effects on adrenal tissue and cells
- Mechanisms of adrenocortical cell death and stasis in response to mitotane
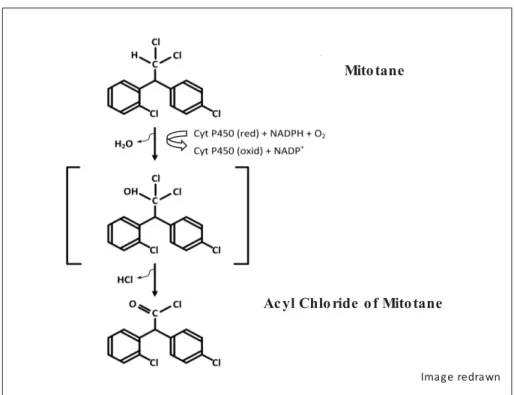
- Activation of mitotane
- Proteins involved in response to mitotane
- Mitochondrial effects
- Mitotane effects on mitochondria that may lead to apoptosis
- Calcium signalling at the MAM, a crucial apoptosis trigger
- Effects of mitotane on cellular biochemistry and steroidogenesis
However, the direct in vitro effects of the main known products of mitotane in vivo have not been confirmed (Takeshita et al. 2013). An important factor is also the increase of cathepsin D, which is activated by hnRNP (Stigliano et al. 2008).
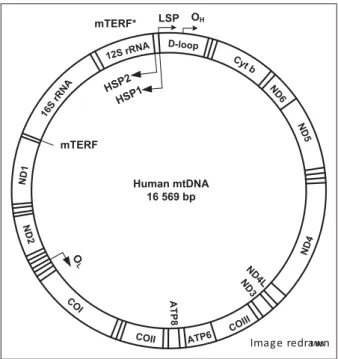
Mitochondria as semiautonomic structures with major roles in energy metabolism and
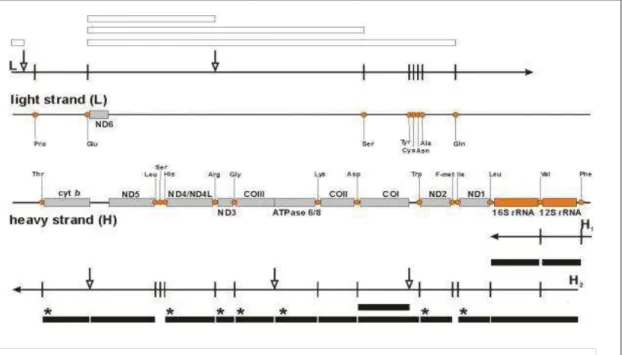
Transcription occurs from both complementary strands, called heavy (H, rich in guanine) and light (L, rich in cytosine). L-strand transcription produces an RNA that is cleaved to produce eight mt-tRNAs and only one mt-mRNA, which encodes a single protein.
Cell lines used in the experiments
Thus, the observed susceptibility of this cell line in response to mitotane may be associated with Ki-ras disruption. It is an adherent cell line with a mutation in the epidermal growth factor receptor (EGFR) (Zhao et al. 2015). The process of tumorigenesis often involves a shift in key regulatory steps in energy metabolism, where cancer cells become highly dependent on glycolysis rather than oxidative phosphorylation.
Heterogeneity in context of ACC study and gene expression study from formalin-fixed,
Mechanisms that determine the processes of cellular differentiation and positioning are beginning to be understood (Pignatti et al. 2017). Similarly, (Azizan et al. 2012) found different gene expression patterns in zoma glomerulosa-like and zona fasiculata-like parts of aldosterone-producing adenomas.
Aims of the study
Materials and methods
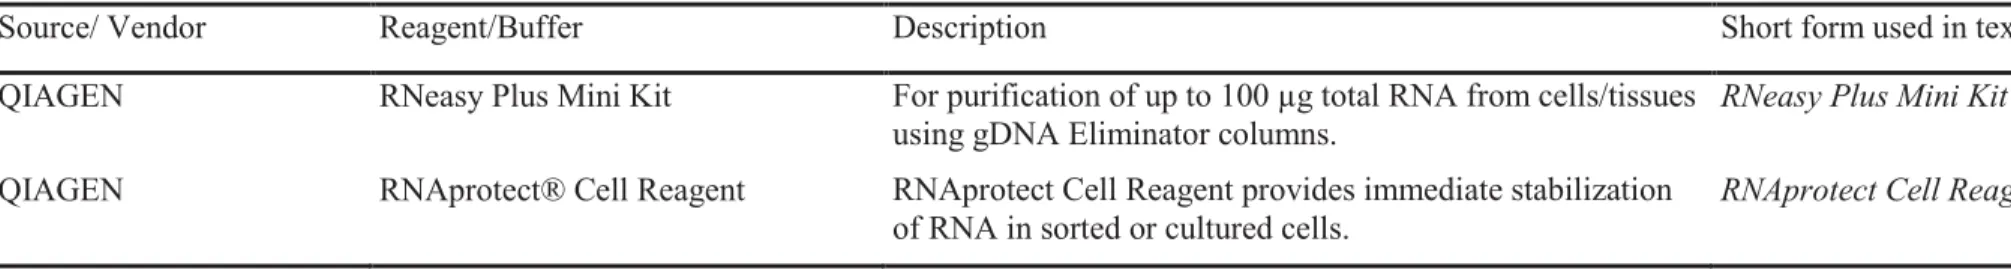
Biological material, reagents, equipment and software
- What was essentially used in the experiments
QIAamp DNA Blood Mini Kit. QIAGEN Buffer AL For DNA purification using QIAamp and DNeasy Kits. QIAGEN BC3: 5X Reverse Transcription Buffer 3. QIAGEN cDNA Synthesis Enzyme Mix Contains dNTPs and random primers.
D es cription of genes included in the Q IAG E N H uman Mitochondrial E nergy
Most are nuclear and encode the mitochondrial coenzyme respiratory chain, along with mitochondrial gene precursors and polycistronic transcripts H1 and H2 units. The sequence also consists of primers for the genes of associated proteins involved in mitochondrial processes and mitochondrial genes polycistronic precursors H1 and H2.
Protocol of experiments
- Cell culture: treatment with mitotane and control normal serum. Preparation of samples
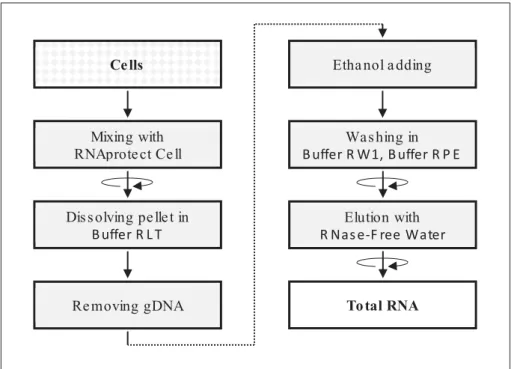
- Isolation of total RNA from cultured cells
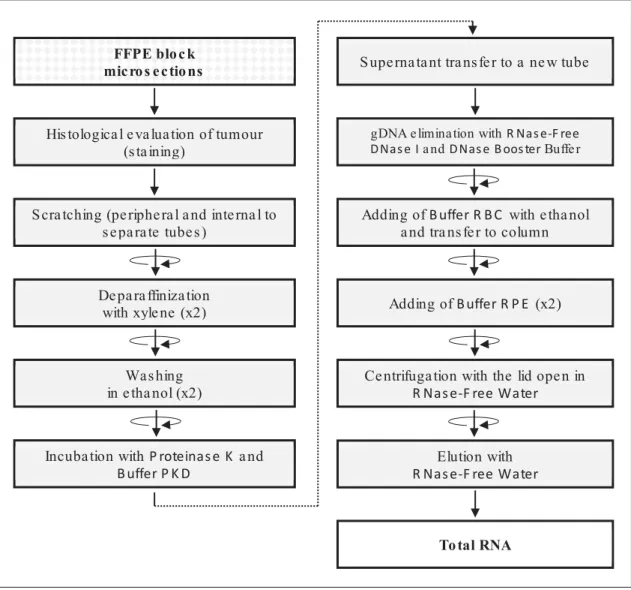
- Extraction of total RNA and DNA from FFPE
- Research workflow
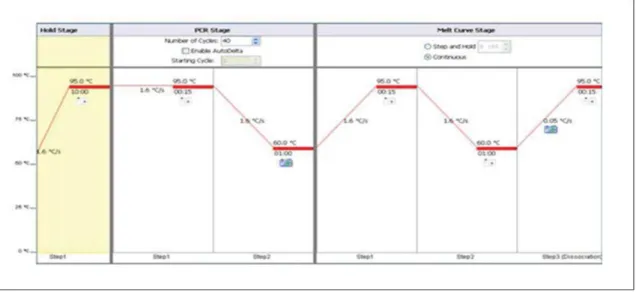
- One step (quantitative) qRT-PCR
Three quarters of the volume of each pool was used for further transcriptomic studies (section 3.2.2). To remove droplets from the inside of the lid after brief centrifugation, 200 µl of 96% ethanol was added to the sample. Preamplification of cDNA was performed in duplicate for each of the 8 cell groups, using 5 µl of product, with 12.5 µl of the RT2 PreAMP PCR Mastermix and 7.5 PreAMP Pathway Primer Mix specified for each type of array.
The intensity of the fluorescence signal (Delta RN or ΔRN) correlates with DNA amplicon amount, which is related to the initial sample input amounts (Rulli 2014). In these PCR experiments, two mixes of QIAGEN's Primer Assays were used – the first containing Beta Actin primers and the second, GAPDH primers.
Technical results with quality evaluation
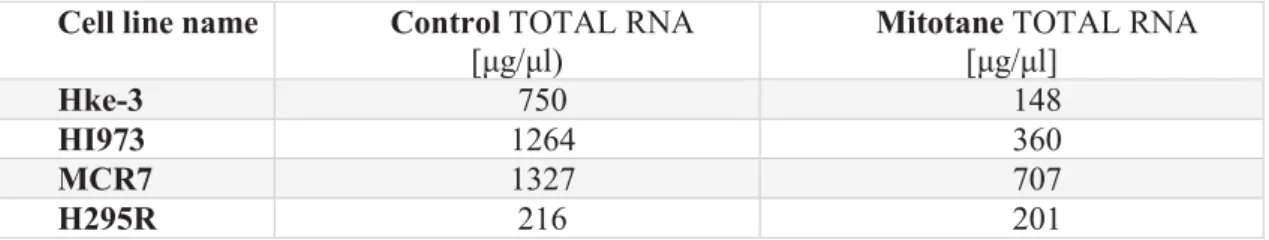
- Total RNA yields and cDNA assessment in the mitotane-treated cell experiments
- Results for total RNA and DNA extraction from FFPE, with method adjustments to
- Nucleic acid purity parameters
- QRT-PCR reaction carried out with TaqMan Probes
- Optimization of the gene expression study method Real-Time PCR for RT2 Profiler PCR
- Two-step qPCR results, reference gene for cell lines from mitotane induction and control
- Quality control provided for the array analysis results
- Usefulness of quality assessment of FFPE-derived total RNA in further gene expression
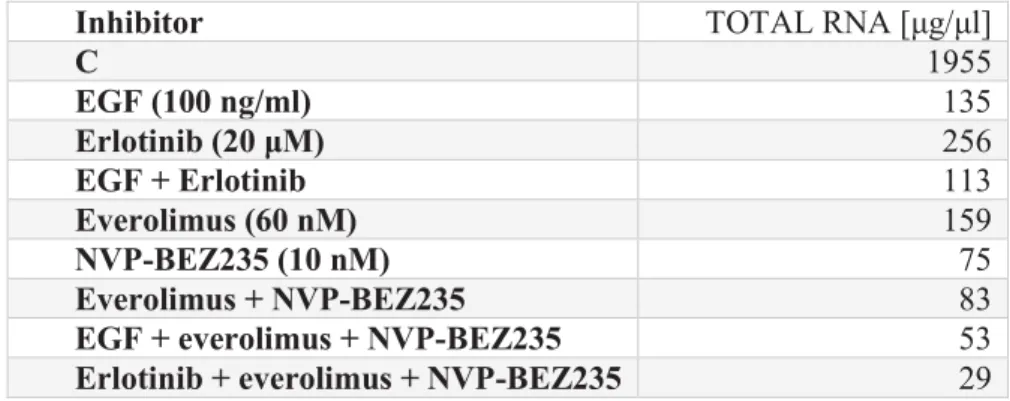
Examples of RNA concentration results from previous experiments in H295R cell lines treated with various inhibitors are shown in Table 8. Concentration of total RNA extracted from FFPE, indicating the yield of RNA originating from the inner part of the tumor or the peripheral part for each case. These show the expected shape of the curve, with exponential regions and plateaus, indicating that the qRT-PCRs were performed correctly.
Sample purity is the most common assessment for RNA quality control and also the most frequently cited in terms of transcript quantification. Another study observed a significant effect on only a small number of genes (Opitz et al., 2010).
Statistical method used for data analysis
- Choice of reference value
Results
Comparison of energy metabolism gene expression under basal conditions for all cell lines. 78
- ACC H295R profile, response to mitotane
- Colorectal adenocarcinoma HKe-3 profile, response to mitotane
- Lung adenocarcinoma H1975 profile, response to mitotane
- Breast adenocarcinoma MCF-7 profile, response to mitotane
- Expression profile of the nuclear genes involved in mitochondrial metabolism
- Mitochondrial genome expression after mitotane treatment for all ACC cell lines
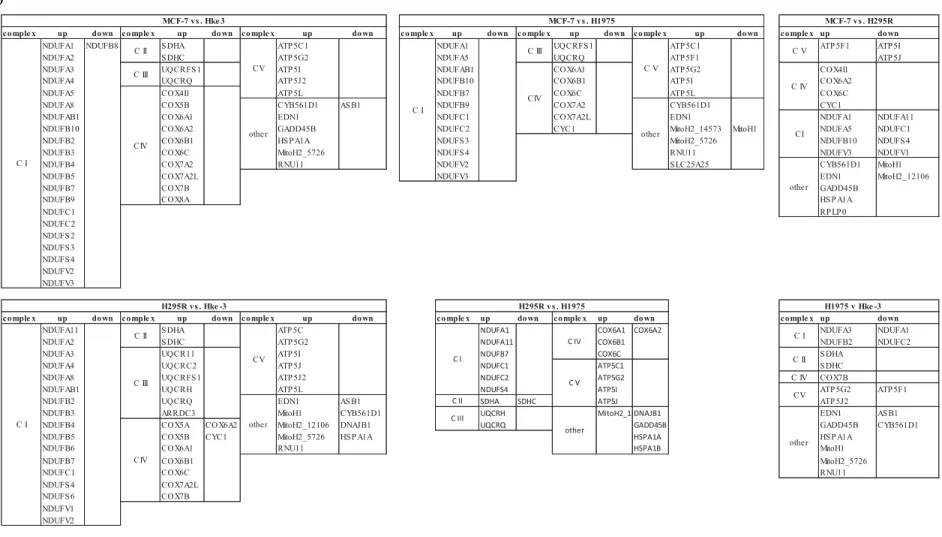
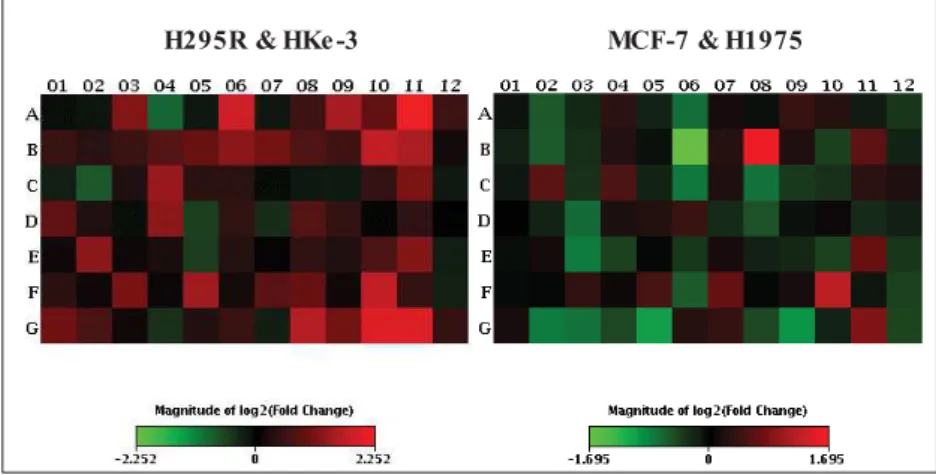
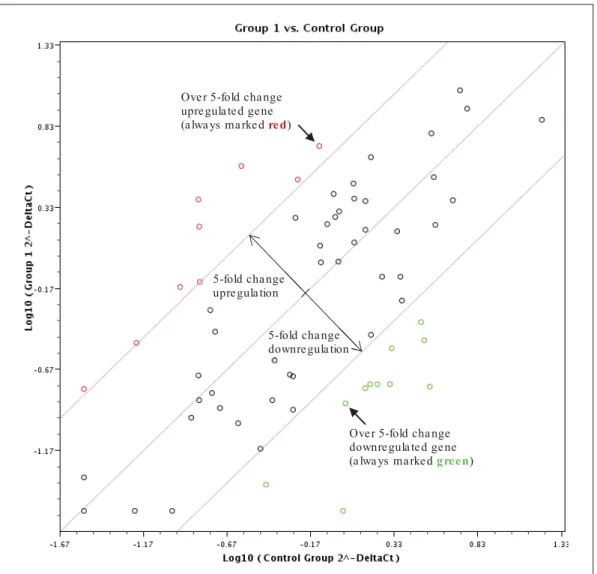
Comparison of these results (as detailed below 3 panels in Figures 21a and 21b) shows, as expected, that MCF-7 cells are less active than the other cell lines, with most genes less expressed than in the others. Fold changes shown in red reflect a higher expression and in green reflect a lower expression, where the color shades in the bar graphs (eg: Fig. 24) reflect – the fold change with the same colors as in the heatmaps (eg, Fig. 23). Data presented in scatter plots and bar graphs below are calculated in the RT² PCR Array Data Analysis version 3.5 software as an average of the gene expression of.
For the cell line ACC H295R (section 4.2.1), the profile presented above shows that the genes for the respiratory complexes with the most altered expression are ATP6J2 upregulation in complex V, Upregulation of COX subunits, where COX 6A2 &. Considering the other 3 cell line profiles presented below, for HKe-3 (section 4.2.2) the usual upregulation of respiratory complexes is visible; the most overexpressed are NDUF6F4, ATPG2 & ATP5I and COX7B.
Comparison of gene expression in all cell lines
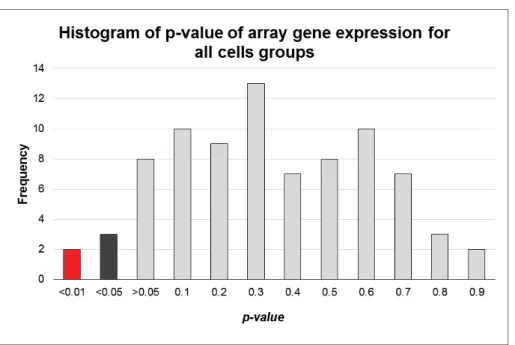
These include mitochondrial gene precursors, rRNA and tRNA, which are then generated separately by endonuclease cleavage. Histogram of p values representing a gene expression profile by statistical significance for the 84 genes present in the HMEM array.
Calculation of significance of expression changes in response to mitotane after grouping the
- Mitotane versus control profile for MS and LS group
Expression magnitude of genes in the HMEM Array after mitotane treatment ('MS' . group - left, 'LS' group - right). Results of p-value for gene expression in HMEM Array after mitotane treatment ('MS' group - left, 'LS' group - right). Summary of changes in expression of genes belonging to respiratory chain complexes I-V after mitotane treatment of the 'LS' group.
The gene expression profile for each oxidation chain complex and additional proteins for the 'LS' group in response to mitotane. Summary of changes in expression of genes belonging to respiratory chain complexes I-V after mitotane treatment for the 'MS' group.
Summary of RNA purification and mTOR PCR Array experiments from FFPE tumour sections
Relative gene expression results for peripheral ACC versus normal cortex in the mTOR PCR array. The results above show how strongly (in terms of fold change) the genes are altered in the tumor compared to the normal cortex. The most significantly overexpressed genes in tumor tissue compared to normal were the angiogenesis-enhancing genes VEGF C and VEGF B; VEGFA was also up-regulated.
Several mTORC1 positive regulators were upregulated, including TELO, RHOA, MAPK3 and RRAGA, which are important for cellular amino acid response, while others such as IGF mTORC1 positive regulators were strongly reduced, especially MYO1C, which encodes a member of the unconventional myosin protein. family. This gene provides the instruction for an enzyme that is important for proper interaction of immune cells in the tissues.
Discussion
The effect of mitotane on non adrenal tissues
- Mitochondrial metabolism in tumours
- Bioenergetics of adrenocortical cancer
- Mitotane influence on mitochondrial energy metabolism
Today, however, it is known that different types of tumors show a wide range of changes in the balance between glycolysis and oxidative phosphorylation and that this may also depend on the state of development of the neoplastic cell. Those in subunits of the respiratory complex II protein (succinate dehydrogenase) have been observed in gangliomas and pheochromocytomas. Despite the many insights summarized above, many aspects of mitochondrial biology are poorly understood, such as the importance of protein structural components and the regulation of nuclear-encoded mitochondrial genes in relation to the bioenergetics of the epigenome.
Direct studies of respiratory complexes using spectrophotometry (Hescot et al. 2013) show mitotane inhibition, but selectively. Since this is a disorder of the purine salvage pathway, it was speculated that the lack of purine nucleotide supply was compromising mitochondrial energy metabolism (Watts et al. 1987).
A mitochondrial basis for mitotane specificity
Furthermore, mitochondria are the most important quantitative source of intracellular reactive oxygen species, and efflux from the respiratory chain is the main entry point (Pinton et al. 2008), (Waszut, Szyszka and Dworakowska 2017). A number of case reports show response of testicular tumors to mitotane (Bertram et al. 1991), but women taking mitotane continue to cycle and can achieve pregnancy (Tripto-Shkolnik et al. 2013). Both males and females show marked decreases in urinary androgen metabolite excretion during mitotane (Ghataore et al. 2012), (Gentilin et al. 2013).
Studies of mitotane effects on the expression of both mitochondrial and nuclear genes show that these are extensive (Dworakowska et al. 2015), (Sbiera et al. 2015). Patients with adrenocortical tumors receiving mitotane who had relatively high tumor expression of FATE1 had worse outcomes than those in whom it was low (Doghman-Bouguerra et al. 2016).
Mitotane influence on mitochondrial energy metabolis m and role in promoting
Initial release of ROS by mitochondria may be mediated by the adapter protein p66shc, which translocates to the mitochondria and acts to strip electrons from the coenzyme respiratory chain ( Pinton et al. 2008 ). There is also enough evidence for direct actions of mitotane on the mitochondria (Pinton et al. 2008), (Alberts et al. 2002). Other similar studies on the role of the respiratory complexes provide support for the studies described in this thesis.
This overexpression may be related to interactions Calcium flux at the MAM transition between the ER and mitochondria is one of the most important factors causing cell death (Alberts et al. 2002). This is supported by work showing that overexpression of GADD45 in human fibroblasts causes the cells to arrest in an early mitotic state (Cerquetti et al. 2008), (Stigliano et al. 2008).
Discussion of findings on response to mitotane in cultured cell lines in relation to effects in
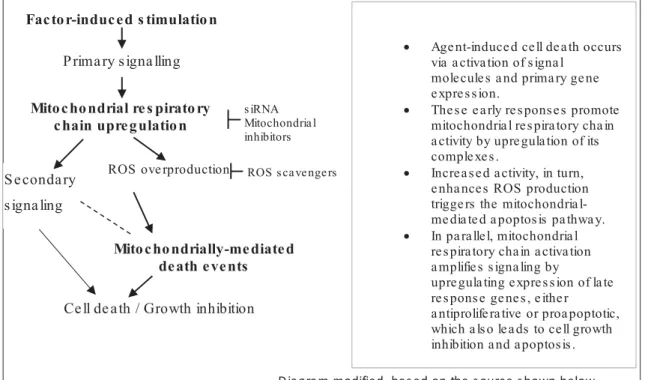
To summarize, GADDD45 may play a key role in the control of cell progression, regulation of signaling pathways, DNA repair and apoptosis, and may be responsible for mitotane-induced cell death. Those changes mainly involve gene overexpression of mitochondrial chain complexes and this may be a useful contribution, since mitotane-induced apoptosis occurs through mitochondrial pathways. Current technologies, including those in the current study, make it possible to quantify changes in expression of large panels of genes, but interpretation of the generated data is challenging.
Increase or decrease of gene expression may reflect response of an established cell signaling mechanism or may be much less easily interpreted. As noted in the review of mitochondrial signaling by Whelen and Zuckerbraun (2013), most studies have been performed in unicellular organisms, so any understanding of these processes in humans remains at an early stage.
Methodological contribution of mRNA preparation from FFPE; discussion of mTOR PCR
Microarray, qPCR and KCNJ5 sequencing of aldosterone-producing adenomas reveal genotype and phenotype differences between Zona Glomerulosa- and Zona Fasciculata-like tumors." The Journal of Clinical Endocrinology and Metabolism 97 (5). Preclinical targeting of the type I insulin-like growth factor receptor in adrenocortical carcinoma." The Journal of Clinical Endocrinology and Metabolism. Gene expression profiling of human adrenocortical tumors using complementary deoxyribonucleic acid microarrays identifies several candidate genes as markers of malignancy." The Journal of Clinical Endocrinology and Metabolism 90 (3).
Mitotane reduces the viability and function of human and mouse ACTH-secreting pituitary cells." Journal of Endocrinology 218 (3). Clinical results of the use of mitotane for adrenocortical carcinoma. Brazilian Journal of Medical and Biological Research. Mitotane induces CYP3A4 expression through steroid and xenobiotic receptor activation. Journal of Endocrinology 216 (3).
Management of Endocrine Manifestations and the Use of Mitotane as a Chemotherapeutic Agent for Adrenocortical Carcinoma. Journal of Clinical Oncology: Official Journal of the American Society of Clinical Oncology.