The profile of the right wheel is turned by an angle in the coordinate system starting at the contact point of the left wheel and the rail (Figure 4). The profile of the left wheel is turned by an angle in the coordinate system starting at the contact point of the right wheel and the rail (Figure 5).
The results achieved
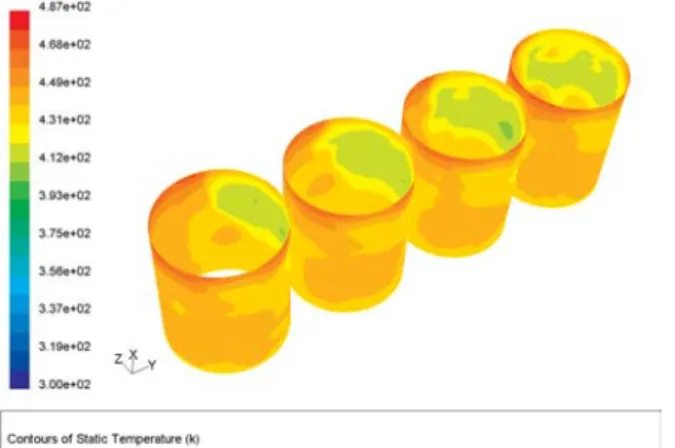
To bring heat flows - the temperatures in qch1, qch2, qch3, qch4 are applied so that the average temperature leaving the block is equal to the experimentally measured one.
Conclusion
Due to the change in the cooling medium (other physical properties), there was a decrease in the heat flows from individual linings. These conditions arise directly from the conditions of cooperation of the internal combustion engine with the absorption cooling equipment.
Introduction
Uncertainty of each calculation component (in loading or structural parameters) can be characterized by probability theory or fuzzy sets approach. Various methods include safety factors, "worst case scenario", probabilistic methods and fuzzy set based methods.
AN ANALYSIS OF VEHICLE VIBRATION WITH UNCERTAIN SYSTEM PARAMETERS
In theory, probabilistic methods should be more effective for problems involving only random uncertainties, because they account for more information about these uncertainties than the other methods. Through fuzzy technique, the complete information about the uncertainties can be included in the model and one can demonstrate how these uncertainties are processed by the calculation procedure in MATLAB [1, 2].
Milan Sága – Milan Letrich – Roman Kocúr *
Numerical study of random vibration of a fuzzy vehicle computational model
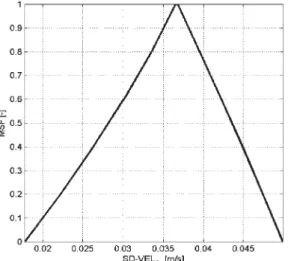
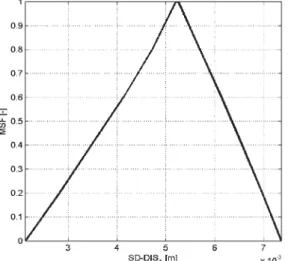
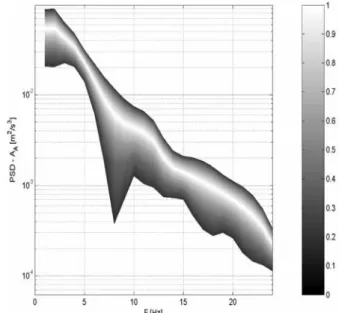
5 Fuzzy PSD of vertical rail irregularities-left and right rail (u1uL, u2uR), LAM = spatial frequency [l/m]. The purpose of the solution was to analyze the soft standard deviation of the vertical displacement, speed, acceleration and WA driving quality mark at point A, which are presented in fig.
![Fig. 5 Fuzzy PSD of the vertical track irregularities-left and right rail (u 1 u L , u 2 u R ), LAM = spatial frequency [l/m]](https://thumb-eu.123doks.com/thumbv2/5dokinfo/19359854.0/16.892.105.786.218.571/fig-fuzzy-vertical-track-irregularities-right-spatial-frequency.webp)
Conclusion
APPENDIX
Problems of Vehicle Rollover
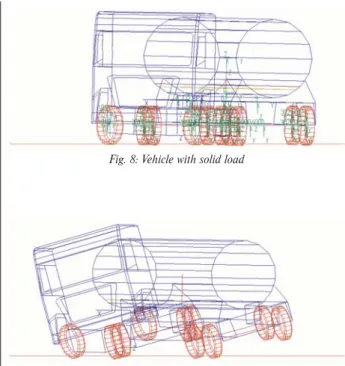
The stability of a heavy vehicle in a corner is mainly influenced by the following four factors: center of gravity, wheel width, turning diameter and vehicle speed. This is especially true for tank cars, which are difficult to describe due to the effects of free movement of the liquid in the tank. Most of the studies conducted in the 1980s and 1990s were based on computer simulations using models with different processing capabilities.
THE INFLUENCE OF LIQUID LOAD MOTION ON ROLLOVER STABILITY OF ROAD TANKERS
This also applies if the load slides along the length of the bearings laterally. Numerous studies have been conducted examining the interaction of fluid scour and vehicle rollover. This method is based on replacing the movement of the liquid with a pendulum, the parameters of which are derived from the amount of liquid in the tank.
Miroslav Tesař *
Results of Simulation Tests
Another rotation appeared between the 6th and 7th seconds in the heavily loaded vehicle. This is the time when the heavily loaded vehicle passes from the right turn to the exit of the roundabout. At the same time, the vehicle with liquid load overturns due to the scouring effect of the liquid.
Experimental determination of an indicator diagram In order to determine the characteristics of the relative amount
With it, it is possible to determine and analyze engine indicators and evaluate the characteristics of heat emission from combustion. In the paper, the author presents the basic issues related to the analysis and simulation of indicator diagrams based on the randomly determined characteristics of the relative amount of heat emitted in combustion. Experimental determination of an indicator diagram To determine the characteristics of relative quantity.
THE METHOD OF DETERMINATION OF HEAT EMISSION CHARACTERISTICS IN PISTON SELF-IGNITION INTERNAL
Research is being stimulated by the development of electronic systems that control engine work, which are widely used in automotive vehicles. These systems allow the engine to achieve the necessary power and optimum performance indicators due to minimal fuel consumption, minimal emission of harmful components of exhaust gases and noise. In addition, it allows us to determine the balance composition of basic components of combustion products with respect to the angle of rotation of the crankshaft and also the engine work hardness, etc.
Andrzej Ambrozik *
- The preparation of experimental an indicator diagrams for analysis
- Combustion incipience, self-ignition delay period Combustion process incipience in forced ignition engines is the
- The determination of characteristics of heat emission in combustion on the basis of an experimentally
- The determination of characteristics of the relative amount of heat emitted in combustion
- Conclusions
- Results and discussion
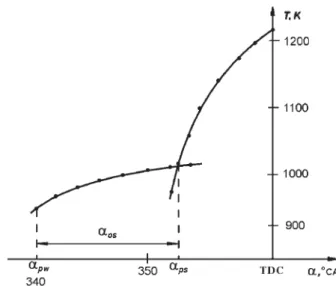
The method of determining the auto-ignition delay period, represented in the graphical form pw – fuel injection start. The determination of the characteristics of the relative amount of heat emitted during combustion. The amount of heat emitted during combustion. Thanks to the method of analyzing the real indicator diagram for piston self-ignition engines put forward in the article, it is possible to determine the delay time for self-ignition and the characteristics of the relative amount of heat released during combustion.
VISUALISATION RESEARCH INTO FUEL SPRAY PROPAGATIONVISUALISATION RESEARCH INTO FUEL SPRAY PROPAGATION
The special thing about the nozzle of this injector is the variability of the fuel nozzles during injection. The variability of the cross-sections of these holes is achieved by a rotating/sweeping movement of a needle (RSN injector). The parameters of the macrostructure of the jet fuel stream were determined based on measurements made using specially constructed equipment, which allowed direct observation of the development of the mist during fuel injection as well as in a chamber with a fixed volume [4 , 7, 8] and measuring the fuel distribution within the droplet mist.
Hubert Kuszewski – Kazimierz Lejda – Zygmunt Szlachta *
The range of the spray front
Most likely this was due to the analyzed (single) injection, at pb25 [bar] the fuel velocity at the injector outlet was higher than at pb20 [bar]. The range of the diesel fuel spray front formed by the classic injector at different background pressures in the observation chamber. The range of the spray front, formed by the RSN injector for fuels differing in physical properties.
The apex angle and surface area of the spray In Fig. 7 it may be seen that in the case of the RSN sprayer
This was caused by a reduction in the value of the index of fuel outflow from the injection holes. An additional reason for the increase in reach of the spray front when using higher viscosity fuel, observed for both types of injectors, was probably the increase in droplet size, due to the conditions conducive to their disintegration being more severe. 5 and 6 it can be seen that, as in the case of diesel fuel, the spray range of other fuels was greater for the RSN injector over the entire time of spray development.
Conclusions
Nomenclature
Experimental Procedures 1 Friction Test Equipment
The friction test unit was mounted in a vacuum chamber, which was placed on a pneumatic wet table. The vacuum chamber allowed to examine the friction behavior of the tested pairs in different environmental conditions. The 3 mm diameter stainless steel ball was fixed on top of the holder.
FRICTIONAL BEHAVIOUR OF THIN TIN FILMS WITH A COPPER INTERLAYER
Martin Komlossy – Marián Dzimko – Yoshinori Takeichi – Masao Uemura *
- Temperature Measurement of Substrate
- Deposition of Cu and Sn Films for Friction Tests Before starting the deposition of copper and tin layers for fric-
- Results and discussion
- Conclusions
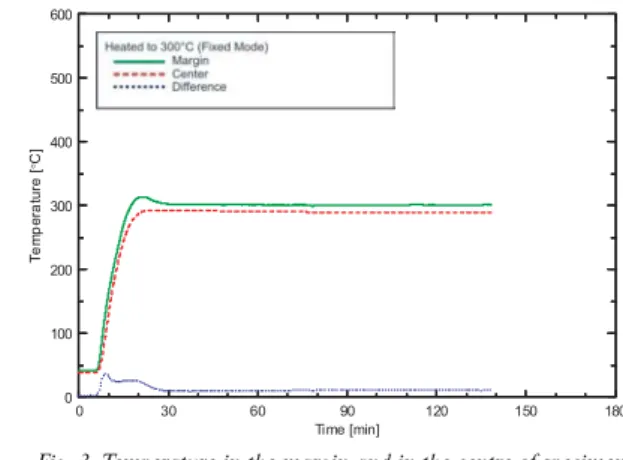
The heater attached to the top of the deposition chamber (Fig. 2) was used for heating. For the second method, the top of the substrate was heated to 300 °C and kept unchanged for 3 hours (Figure 5). Considering also the heating of the substrate, in the case of heated samples the lifetime is longer than for the non-heated ones.
UNIVERSITY OF ZILINA
3] DZIMKO, M., URAKAZE, K., HOSOI, N., UEMURA, M.: Tribological properties of silicon wafers coated with thin Pb-Sn films, Quarterly Journal SCIENCE VISION, July-September 1996, pp.
TRANSCOM 2005
Minister of the Slovak Ministry of Education Rector of the University of Zilina
English, German CONFERENCE FEE
1.000,-Sk for participants from the Slovak Republic
DAAD project “The Development of Robot Control System with Artificial Intelligence Application”
Theoretical mastery of robot control systems by applying artificial intelligence methods, mainly digital image processing and sensor systems. Realization of the control system for the power part, thanks to the mechanical part of the robot and the drive of its movement axes to design the right type of robot control, design of the power part, especially servo drive, power supply of the control units and the central control unit. The design of the implementation of a robot in a flexible manufacturing system, – the design of the robot control with a host computer.
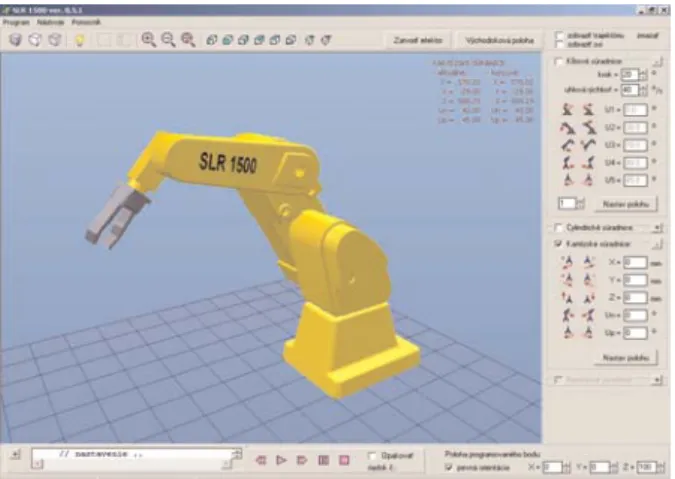
The Robot Control System and Simulation Software The goal of the development was to design software for simu-
The project participants were: the Robotics Division at the Faculty of Information and Electronics, University of Applied Sciences in Mittweida, Germany and the Department of Measurement and Automation at the Faculty of Mechanical Engineering, University of Žilina, Slovakia. The design of simulation program equipment of robot, computer simulation possibilities – simulation of robot functions, movement and manipulation functions: graphic model of robot (mathematical 3D model, determination of edge visibility, kinematics bonds), the design of simulation algorithms, design of software and verification of correct function . The robot control system and simulation software The aim of the development was to design software for simu-
THE DEVELOPMENT OF ROBOT CONTROL,
The DAAD (Deutscher akademischer Austauschdienst) project was based on the personnel exchange program between Germany and Slovakia (in the years. It was aimed at the development of systems for guiding robots using artificial intelligence.
ROBOT SIMULATION AND DIGITAL IMAGE PROCESSINGTHE DEVELOPMENT OF ROBOT CONTROL,
ROBOT SIMULATION AND DIGITAL IMAGE PROCESSING
Viera Poppeová – Juraj Uríček – Róbert Zahoranský – Tibor Galbavý – Klaus Müller – Swen Schmeisser *
- Robot Control in a Collision Situation
- Method Description
- Collision 3D Simulation
- Digital Analysis of Image
- Description of Computer Subsystem for Digital Analysis of Image
- Software Image Processing V 3
- Conclusion
- Transportation flux
In this case, the parts of the robot must be defined by geometric formats. During the movement of the robot we count distance from the ball to the flat or flats. The basic parameter to be determined in this case is kE – the share of defective products.
APPLICATION OF A TRANSPORTATION FLUX FOR DETERMINING QUALITATIVE INDICES
To perform a random quality control of an assembled assembly (by sampling) a number of workpieces to be taken for control must be determined from the total number of workpieces in the transport flow. After selecting a lot (population) quantity, a current share of defective products is determined as a ratio of the actually known number of defective products to the number of controlled products. This is the point on the diagram (Fig. 1) that determines such a number of controlled products after which the curve of amount of defective products is stabilized.
Aleksander Nieoczym *
Process monitoring at the working station
Sensors are placed not only in the workstation, where the main process is carried out, but also in the equipment that is part of the tools, e.g. To perform general control of the work, it is enough to read the parameters of randomly selected Snor Lmsubsets. This enables the determination of the location of occurrence of irregularities within the set of parts read by one of the Sor subsets.
Deutz-fahr Agrotron
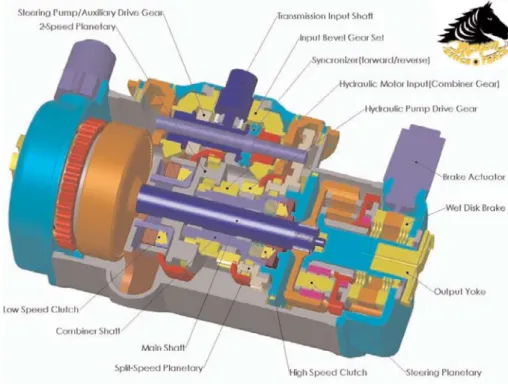
Vehicle manufacturers and transmission developers use the principles of a continuously variable transmission without interrupting the flow of power. The most famous manufacturers have developed differential transmissions with hydrostatic units installed in the parallel branch of the power flow.
DIFFERENTIAL HYDRO-MECHANICAL TRANSMISSIONS WITH HYDROSTATIC UNITS
František Brumerčík – Roman Kocúr – Milan Pažičan – Michal Lukáč *
- Silvatech defence
- Torvec-IVT
- Steyr CVT Hydrostatic unit
- Fendt-Vario-Gearbox
- Conclusion
The result is the Torvec hydraulic pump and motor – the big breakthrough behind the IVT™. The mechanical power on the internal gear and the hydrostatic power on the sun gear of the compound planetary gear combine to provide the correct power in the respective speed ranges. The speed and direction of rotation of the sun gear can be varied by adjusting the inclined plate at the hydrostatic pump from the maximum speed in the opposite direction (mode 1), via stop (mode 2) to synchronous operation (mode 3) with the internal gear.
COMMUNICATIONS – Scientific Letters of the University of Žilina Writer’s Guidelines
POKYNY PRE AUTOROV PRÍSPEVKOV DO ČASOPISU KOMUNIKÁCIE – vedecké listy Žilinskej univerzity