Project name: Effect of BERT-based grammar analysis on Google search results. I declare that the graduation project prepared by Oğuz Çolak was completed under my supervision. I declare that I have examined this graduation project by Oğuz Çolak which has been accepted by his supervisor.
This work is acceptable as a final project and the student is eligible to take the final project examination. In the first phase, the content of the pages visible in the first 20 of 50 different searches is scored with the pre-trained BERT model. The second phase manually creates a dataset that contains various SEO-focused metrics from the same pages and examines the importance of the BERT score among these features.
Keywords: BERT, bidirectional encoder representations of Transformers, SEO, search engine optimization, content quality, natural language processing, machine learning.
INTRODUCTION
Bidirectional Encoder Representations from Transformers (BERT) Literature Survey
It is a neural network-based technique for pre-training Natural Language Processing (NLP), and as Kim et al. 2020) states that the Natural Language Processing (NLP) community at the time of grammar induction, especially in recent years , has tended to use pre-trained language models (LMs). BERT (with ELMo) has proven surprisingly effective as a way to acquire contextualized word representations, and plays a key role in recent improvements to several models for various NLP tasks. 2019) is the official document published on BERT and the most comprehensive information can be obtained from this document. Papers provided by universities on the success of this model also provide valuable information on both the basics and details of the model. In one such article by Rogers et al. 2020), it is stated that the traditional workflow for BERT consists of two phases: pre-training and fine-tuning.
In fine-tuning for downstream applications, one or more fully coupled layers are typically added on top of the final encoder layer.
Content Quality Overview
Sections
UNDERSTANDING THE DATA
Features
Exploratory Data Analysis
- Data Cleaning
- Pre-processing for Tokenization
- Hyperparameter Tuning
- Tokenization
In this way, it is aimed that the model would effectively understand where the sentence begins and ends (Quijano et al., 2021). In this context, to process the data, all sentences must have the same length and a maximum of 512 characters. Since the sentences in the CoLA dataset have different lengths, [PAD] token is used to achieve this (Sun et al., 2020).
After determining the maximum sentence length with [PATH], attention masking is used to separate the path tokens from the rest of the sentence. Attention Mask is a method that separates which tokens should be processed in the model and which should not, thus leaving the path tokens out of the model. At this stage, wandb and sweep offer a great advantage in making the model better than the most effective hyperparameters.
It is very important that hyperparameters are designed to return the most suitable results, especially the number of epochs. For example, keeping the number of epochs at a low level can cause underfit problems, and keeping them at very high levels can cause overfit problems. For this reason, it is necessary to determine the ideal number of epochs, the number of layers and the number of nodes per node. layers, and to optimize the model in the most appropriate way to give a more efficient result.
Although there are models other than Grid search (Naive Bayes etc.) among the most preferred hyperparameter tuning methods, grid search, which is accepted as the most effective hyperparameter tuning method in the NLP area (Hutter et al., 2015) and preferred in many studies presented in papers and distributed on the web, was used in this project. It aims to maximize val_dhe accuracy and the values are set to the best hyper-recommended parameters to perform transfer learning. The importance in NLP is, of course, that every word in the text has a special meaning and significance.
MODEL SET UP
Train and Test Split
Pre-trained Model for BERT
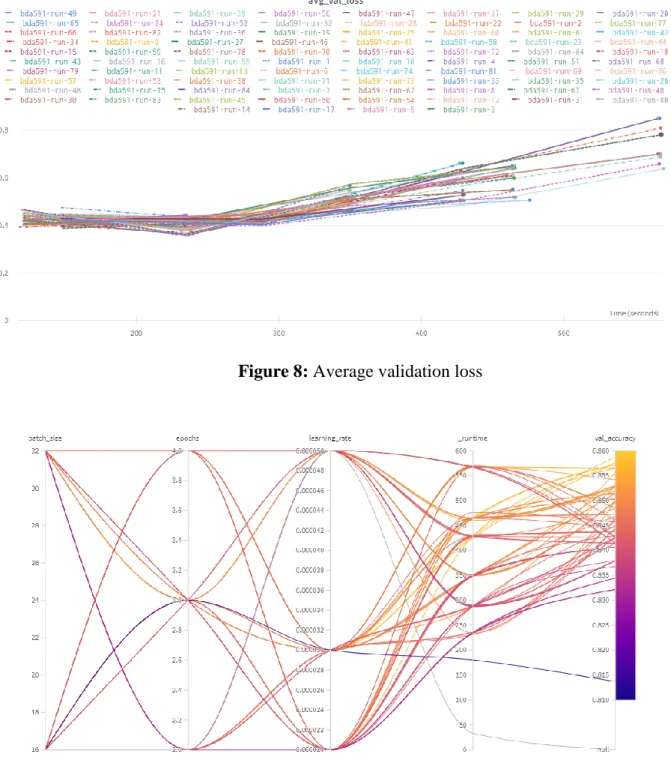
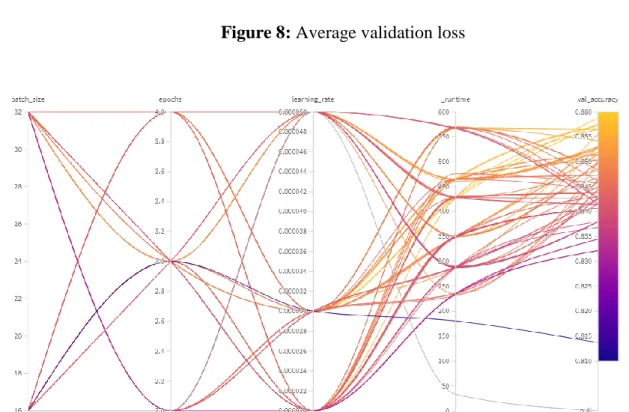
Epochs are found to be the most useful parameter in terms of both importance and correlation. The training loss values showing the errors in the training set and the validation loss values showing the errors in the validation set are also evaluated. This figure briefly shows that the best results are not achieved at the beginning or at the end of the training process, but at different hyperparameters, regardless of time.
Figures 6, 7, and 8 present the distribution of validation accuracy, average training loss, and average validation loss values obtained in different runs compared to the time spent on each run. In these figures, it is clearly seen that the average training loss and the average values of validation loss vary with the time spent in each run. Figure 9, on the other hand, shows how long it takes for the processes to progress through different batch sizes, epochs and learning rates, and finally, what validation accuracy values they reach.
And according to these results, it is observed that runtime is the parameter that has the greatest effect on the result, followed by epochs, learning rate, and batch size parameters, respectively.

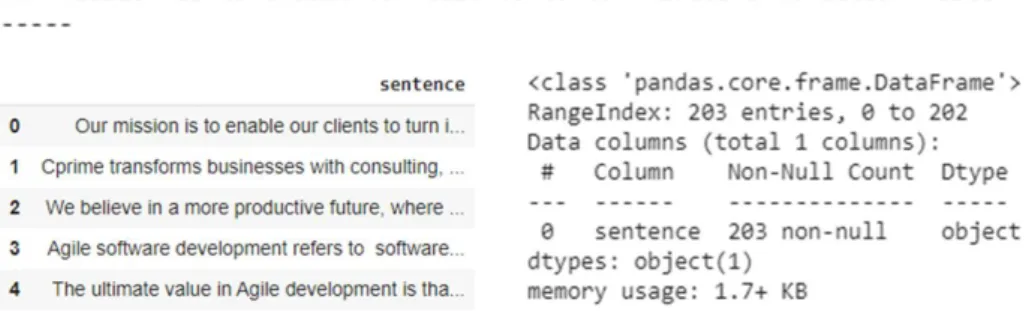
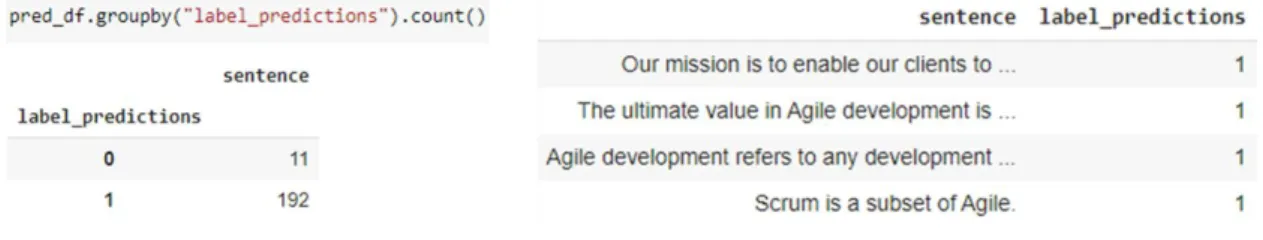
APPLICATION OF THE MODEL TO SEARCH RESULTS
THE SECOND PHASE: FEATURE IMPORTANCE
Understanding the Data
HTML_Size: The total size of the html resources on the page is included in the page file size. HTML_Count: The total number of html resources on the page is included in the number of requests during page load. Image_Size: The total size of the image resources on the page is included in the page file size.
Image_Count: The total number of image resources on the page is included in the number of requests during page loading. CSS_Count: The total number of css resources on the page included in the number of requests during page loading. JavaScript_Size: The total size of JavaScript resources on the page is included in the page's file size.
JavaScript_Count: The total number of javascript resources on the page is included in the number of requests during page load. Font_Size: The total size of the font resources on the page is included in the page file size. Font_Count: The total number of font resources on the page is included in the number of requests during page load.
Media_Size: The total size of media resources on the page is included in the page file size. Media_Count: The total number of media sources on the page is included in the number of requests during page load. Third_Party_Count: The total number of third-party resources on the page is included in the number of requests during page load.
Exploratory Data Analysis
For this, first of all, the table with min, max, quantile, standard deviation and mean values for all columns in the data is printed and reviewed. After a detailed examination of the values in the data set, it is decided that there are offsets in 41 columns and they need to be cleaned. In this context, all values above the 0.95 quantile in the relevant columns are equalized to 0.95, and all values below the 0.05 quantile are equalized to 0.05.
The reason why .90 and 0.1 values are not chosen here is that it is not desired to get rid of all the values that are considered outliers. Because in these features it aims to protect the superiority of pages with extreme values against other pages within the dataset. After cleaning most of the outliers, all features are also standardized by importing StandardScaler from sklearn.preprocessing.

MODEL SET UP AND RESULTS
- KNeighborsClassifier
- SVM Poly
- SVM RBF
- SVM Sigmoid
- Grid Search
- The Results and Discussion
As a first step, 85% of the data is split for training and 15% for testing to apply the model to the data. Consequently, in the model where the cross-validation value is set to 50, the average accuracy score is measured at the level of 0.79. In the model run without cross-validation, the measured accuracy score is also 0.79.
However, this time, unlike KNeighbors, 80% of the data is split for train and 20% for testing. Due to the high accuracy results obtained in SVM models, SVM Sigmoid is selected as the last choice. Since these values are factors that directly affect the user experience, it is a known fact that they directly affect the visibility of the page, so the first two results are not surprising if we evaluate them in the context of domain knowledge.
The Title Tag Focus Keyword feature is also a factor believed to influence search results, so it is an expected result that this feature is in the top 10. Not surprisingly, other features in the top 10 and not yet mentioned are also in this list, as it is already known that these qualities are among the important criteria due to the SEO experience and project managed over the years. The fact that the Total Time Savings feature is in the top 3 can be taken as an unexpected result.
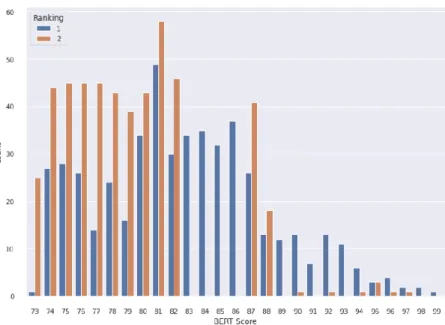
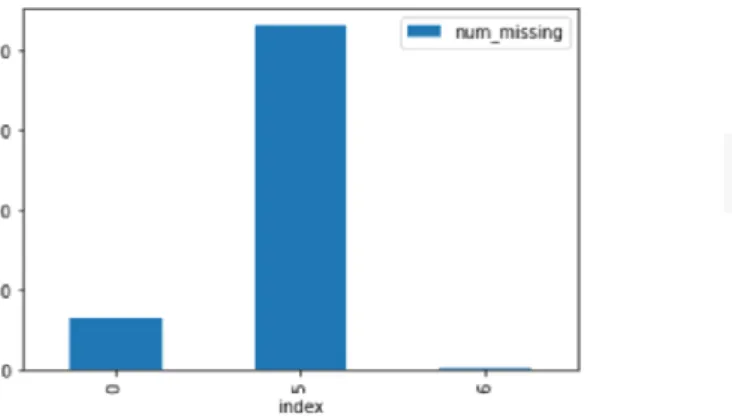
That the BERT score is in the top 10 can be accepted as an expected result due to the correlation observed when the distribution showing the correlation between the BERT score and the ranking values was evaluated before. At the same time, it is a result that will enable us to accept the results achieved in the project as successful despite the small size of the data set. However, Core Web Vitals, which will be rolled out in mid-June 2021, will have a major impact on search results, although it is desired to work with the relevant features of this project due to the inadequacy of the third-party tools at this stage and unstable results a critical amount of missing data errors were found and these features were removed from the dataset.