The Food Wattage Footprint model (FWF) is a project under the Natural Resource Management and Environment Department. This FAO study provides a global account of the environmental footprint of food waste (ie both food loss and food waste) along the food supply chain, focusing on impacts on climate, water, soil and biodiversity. This study provides a worldwide account of the environmental footprint of food waste along the food supply chain, focusing on impacts on climate, water, soil and biodiversity, as well as an economic quantification based on producer prices.
The Food Wastage Footprint (FWF) model was developed to answer two main questions: what are the impacts of food waste on natural resources?
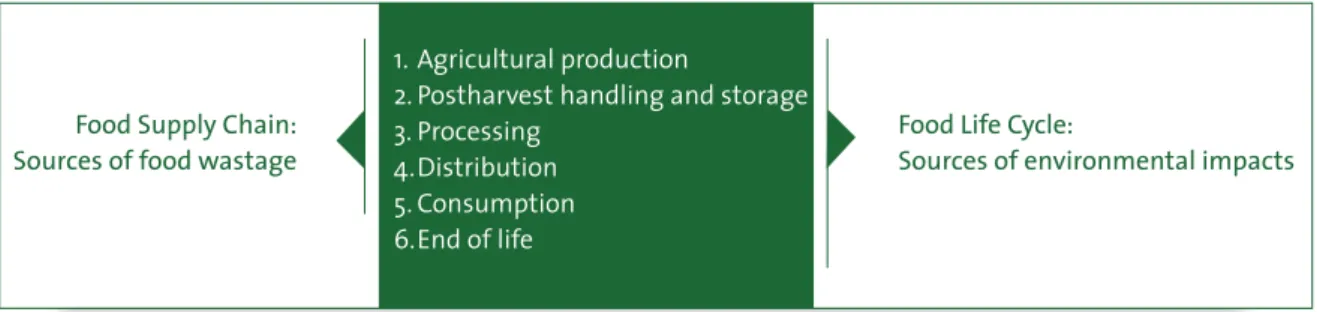
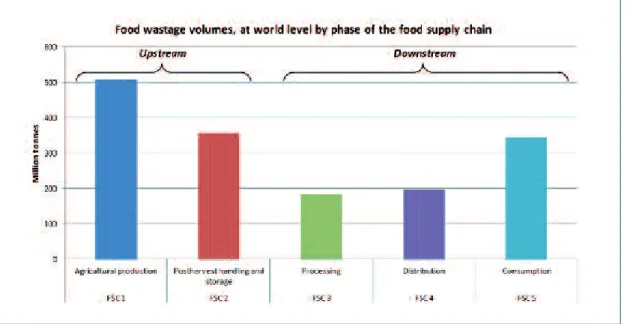
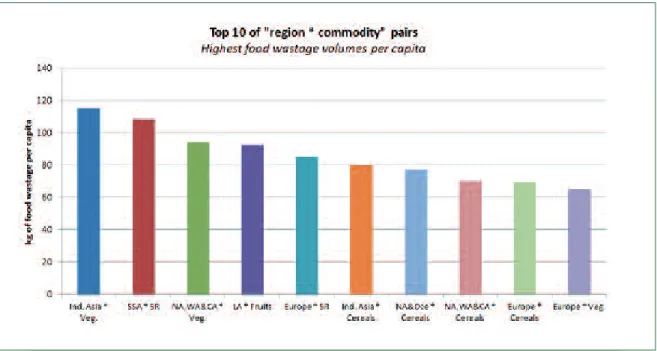
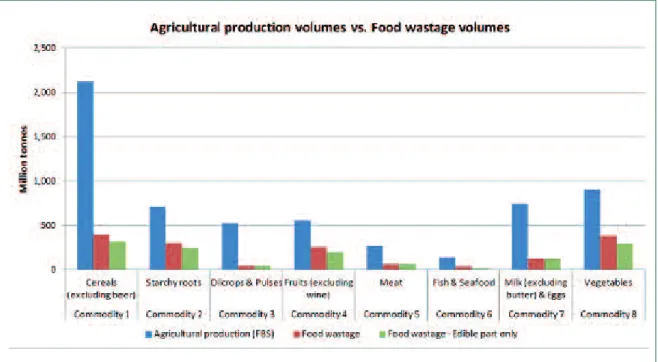
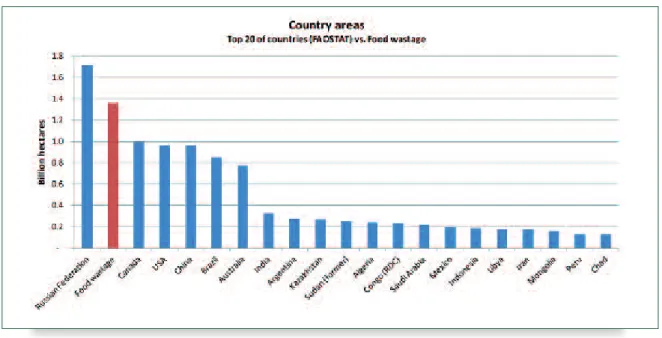
Food wastage volumes
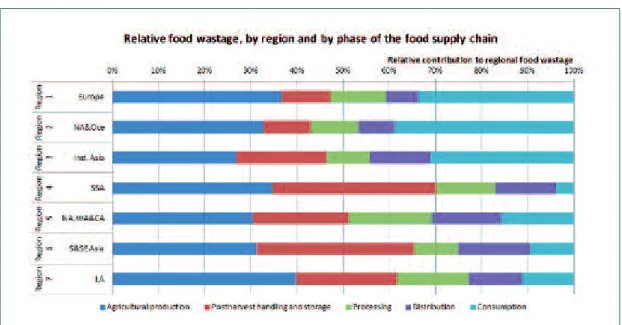
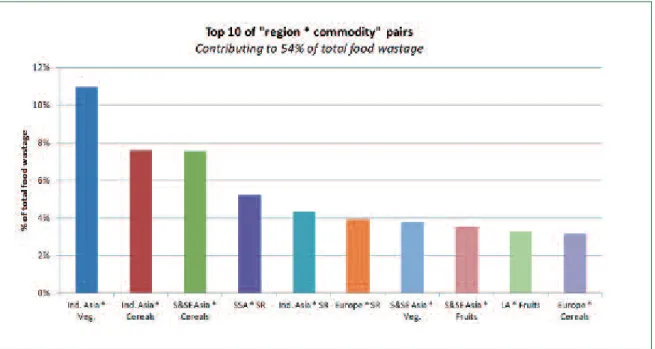
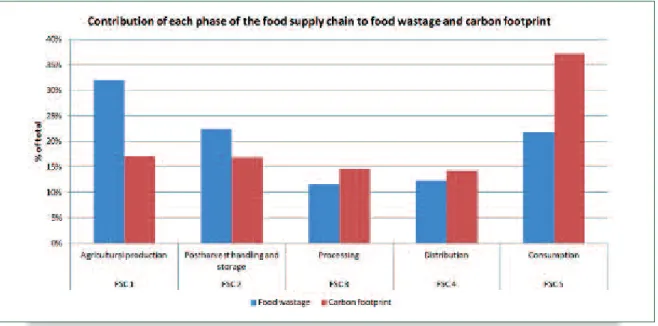
With 33 percent, agricultural production is responsible for the largest amount of total food waste. Thus, on average, food consumption is balanced between the upper and lower parts of the supply chain. Although SSA does not contribute much to food waste globally, its consumption of starchy roots is in the top 10 due to large amounts of food waste in the agricultural and post-harvest stages.
However, SE Asia no longer features in this top 10 and actually has the lowest amounts of food waste per capita.
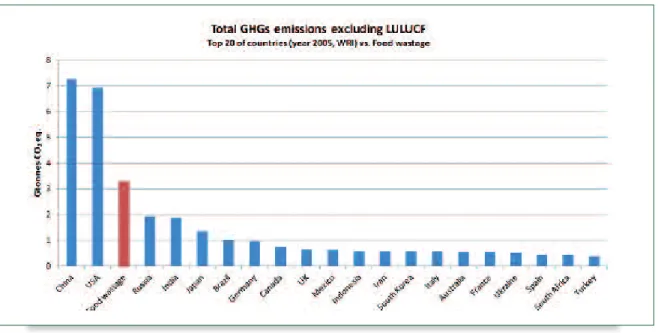
Carbon footprint
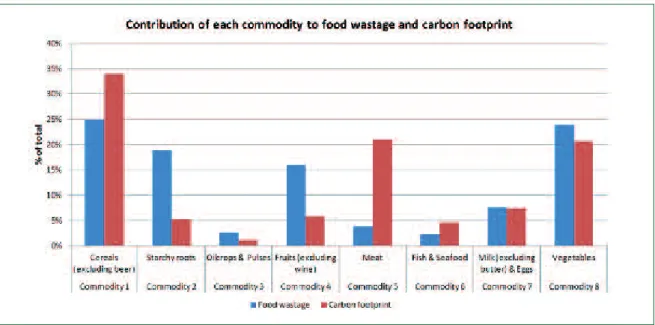
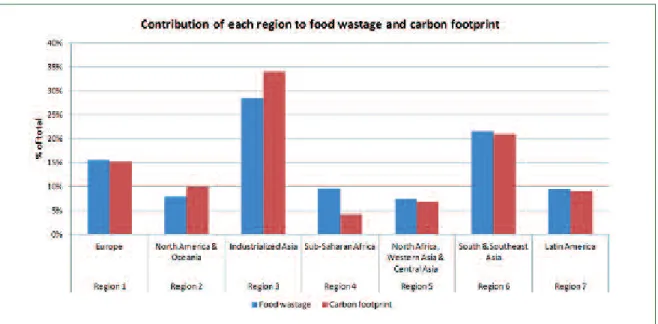
Cereals contribute the most to the carbon footprint of discarded food (34 percent of the total), followed by meat (21 percent) and vegetables (21 percent). Asia has the largest carbon footprint of food waste per capita (approximately 700 to 900 kg CO2eq. per capita per year), while SSA has the lowest per capita footprint (approximately 180 kg CO2eq.). As shown earlier, GHG emissions from the agricultural phase are always the largest contributors to the carbon footprint of each FSC phase.
Together, they account for more than 60 percent of the carbon footprint in each region. For example, the carbon footprint of cereals is as high as 51 percent and 40 percent of the total in S&SE Asia and India. As with the analysis performed for food waste volumes, the "region*commodity" pairs can be sorted according to their contributions to total carbon footprint.
The carbon footprint is calculated as the product of the amount of food wasted and the impact factor. Figure 14 presents the top 10 “region*commodity” pairs for carbon footprint along with their contribution to the amount of food waste. This number indicates whether the hotspot's carbon footprint is primarily due to high amounts of food waste or high impact factors.
Indeed, if the contribution to the total carbon footprint of a given "region*commodity" is high, but its contribution to the total volumes of food loss is low, then the driver of the carbon footprint is the carbon intensity of commodity (ie the impact factors used in the FWF model). In addition, it can be noted that cereals in Europe account for 3.2 percent of the total carbon footprint and 3.2 percent of the total food waste.
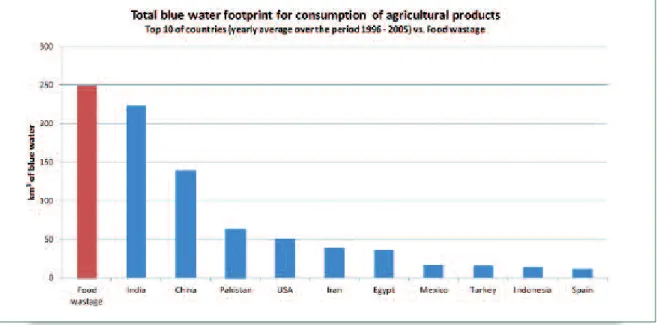
Water footprint
The size of the blue water footprint of food waste can also be shown by integrating it into a country ranking of the largest consumers of blue water. The blue water footprint of food waste calculated in this study focuses on the footprint of agricultural production. Therefore, the national water footprint accounts (Mekonnen & Hoekstra 2011) are shown in Figure 16 for the blue water footprint of national consumption of agricultural products.
Three key parameters affect an animal's water footprint: the animal's feed conversion efficiency, feed composition and feed origin. The average blue water footprint of food waste is approximately 38 m3 per inhabitant per year. In fact, this region accounts for 17 percent of the total water footprint of food waste, but only 7 percent of the total population.
This region represents only 4 percent of the total water footprint of food waste, but as much as 12 percent of the total population. It may be interesting to determine which part of the multiplication is the main driver behind the blue water footprint of the identified hotspots. The top 10 blue water footprint "region*commodity" pairs are presented in Figure 21 along with their respective contribution to the amount of food waste.
More specifically, the water footprint of grains in South-East Asia is mainly from the South Asia sub-region (due to India) and in Ind. NA&CA, which has the highest total blue water footprint per capita, dominates these rankings.
Land use
The following discussion examines the characteristics of land tenure/commodity production analyzed in this study. Schematically, the share of raw materials and pasture productivity will affect the intensity of occupation of non-arable land. The intensity of land occupation of products by monogastric animals can also be divided into arable and non-arable land.
Furthermore, wasted and wasted meat and milk take up about 40 percent of arable land (ie agricultural land). Lost and wasted food crops use only arable land and cover 52 percent of the total arable land occupied by food waste. In this region, 85 percent of the land occupied by food waste is non-arable land for meat and milk, especially for cattle, sheep and goats.
Feed rations include higher proportions of concentrate, resulting in more arable land but less occupation of non-arable land. In all regions, meat and milk are the largest contributors to the occupation of non-arable land. Arable land used to grow uneaten grains contributes 4-15 percent of the total land use of food waste in each region.
It can be noted that the driver for meat and milk seems to be mostly the land occupation intensity of the commodity, for both arable and non-arable land. Asia makes the same contribution to total food waste volumes, but makes different contributions to occupation of arable land.
Biodiversity
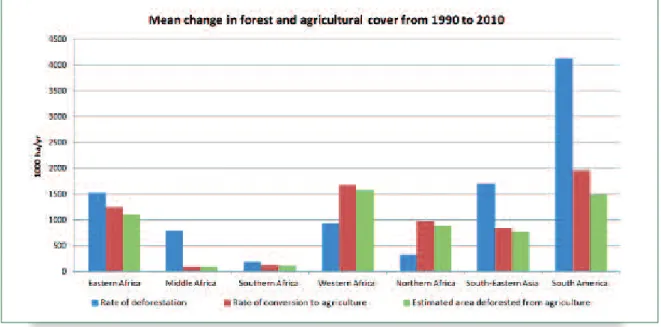
In addition, more than 50 percent of food waste at the agricultural production stage appears to be produced in regions whose soils, on average, currently have a low status in terms of land degradation. However, the majority of food production's impact on biodiversity occurs in low-income regions, such as sub-Saharan Africa and Latin America. While bioenergy crops have experienced rapid expansion over the past 10 years, particularly in the tropics, deforestation remains largely due to the production of food (Phalan et al. 2013).
For example, in the Humboldt Current (i.e. NA&Oce), the MTI plummeted as soon as the fishery for anchovies, a low trophic level species, started in 1955. For example, in the Agulhas Current (LA), the sharp increase in average trophic levels since the 1970s reflects the collapse of fisheries for sardine and anchovy, two species with low trophic levels14. In some cases, the greatest biodiversity impacts are on those resources and regions that also have the greatest amounts of food waste and/or the greatest environmental impacts.
For example, grain production is a major cause of food waste in most regions and probably poses the greatest threat to biodiversity, both in terms of deforestation and species threats. In contrast, although fruit and vegetable production is a significant source of food waste, especially in the tropics, with a large water footprint, it is likely to have relatively less significant impacts on biodiversity than grain production. There may also be a trade-off between the amounts of food wasted and its impact on biodiversity.
Meat, fish and seafood, and oilseeds and pulses account for small amounts of food waste in all regions. Similarly, although oilseeds and pulses are not significant in terms of food waste, their impacts on biodiversity are similar to those of cereals when grown in large plantations.
Economic assessment
Cross-analysis and key findings
The relative importance of rice is emphasized because of its high carbon intensity combined with high levels of waste. However, higher yields for rice and wheat result in a lower water footprint and lower land occupation in Ind. Rice emerges as an important element with high carbon intensity and high levels of waste.
Rice crops emit CH4 due to the decomposition of organic matter in flooded rice fields and therefore have higher impact factors compared to other cereals. The impacts of rice and wheat are more similar in terms of land use and water footprints. It can be observed that India and China contribute the most to the water footprint of cereals in their respective regions.
In absolute terms, more meat is produced, consumed and wasted in high-income regions (especially at the consumption stage) and in Latin America compared to low-income regions. In terms of land occupancy, the variability observed between regions in the contribution of arable or non-arable land is due to differences in production systems. This may include the composition of feed rations and the amount of land needed to produce the ration ingredients.
Due to data limitations, FAOSTAT identifies a particularly large category in its food balance sheets as 'other fruits', which prevents this hotspot from being detailed by major crop. For example, it is likely that the carbon intensity of vegetable waste is higher in Europe, due to the fact that a higher proportion of vegetables are grown in heated greenhouses.
Potential improvement areas
National water footprint accounts: green, blue and gray water footprint of production and consumption. Virtual water in food production and global trade: A review of methodological issues and preliminary results. In Proceedings of the International Expert Meeting on Virtual Water Trade, Value of Water Research Report Series no.