As the funder, the HTA program defined the research question and study design by creating the purchase order. The authors were fully responsible for all data collection, analysis and interpretation and for writing their work. Data sources: Electronic databases, MEDLINE EMBASE and all sections of the Cochrane Library were searched for systematic reviews, randomized controlled trials (RCTs) and other relevant literature on the effectiveness of diet and/or physical activity in preventing or delaying progression to T2DM. Databases were also searched for studies on the cost-effectiveness of interventions.
List of abbreviations
All abbreviations used in this report are listed here unless the abbreviation is widely known (e.g. NHS), or has been used only once, or is a non-standard abbreviation used only in figures/tables/appendices, in which case the abbreviation is defined in the figure legend or in the comments at the end of the table.
Executive summary
Background
Electronic databases were searched for relevant published literature on the cost-effectiveness of diet and/or exercise for IGT or IFG and a critical review was undertaken. Trials are protocol controlled, and patients are expected to remain on the treatments to which they are randomized.
Results
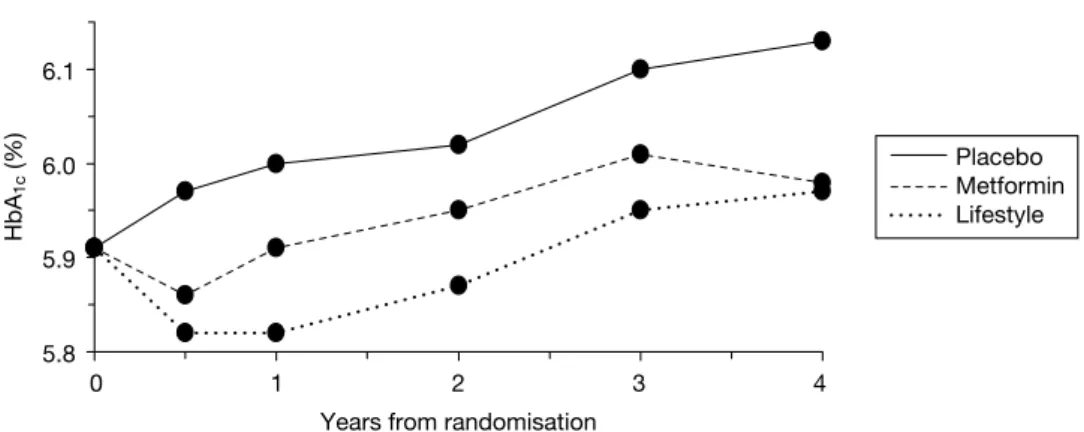
The benefits of the lifestyle intervention were greatest in those with the highest compliance and who achieved several of the goals (such as weight loss and dietary change). Using an early switch to metformin in the nonadherents means that those adherents who remain on diet and physical activity will do better than seen in the lifestyle arms of the trials.
Suggested research priorities
Conclusion
Funding
Introduction
Introduction
Nephropathy – disease of the kidneys which can lead to kidney failure requiring dialysis or transplantation. Diabetes is a leading cause of kidney failure and the second most common cause of lower limb amputation.
The development of type 2 diabetes mellitus
The presence of diabetic complications increases overall NHS expenditure per patient by more than fivefold and increases the chance of a person needing hospital admission by fivefold.9 Based on TARDIS-2 data, a person in the UK with T2DM has average direct costs of >£2000 per year, accounting for 4.7% of all NH2 expenditure.
Epidemiology of type 2 diabetes mellitus Global prevalence of type 2 diabetes mellitus
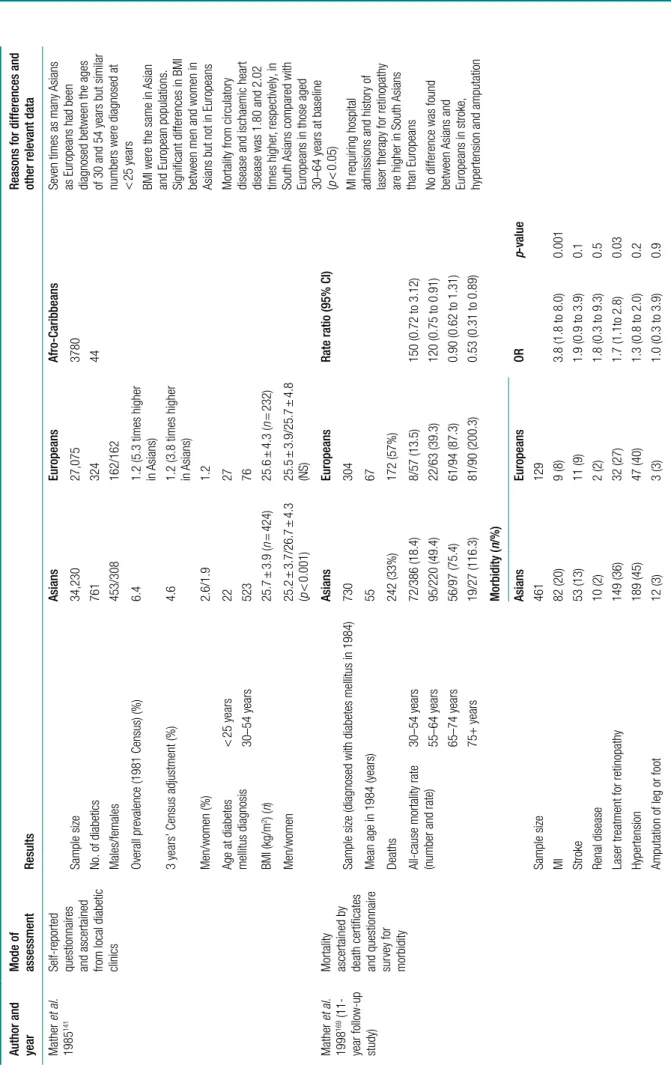
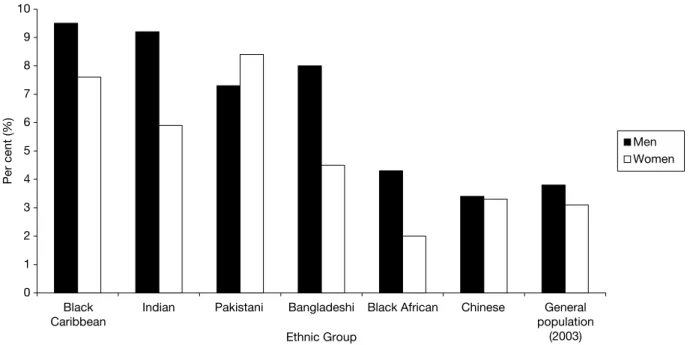
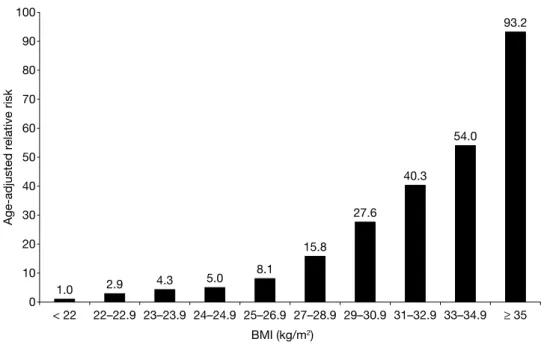
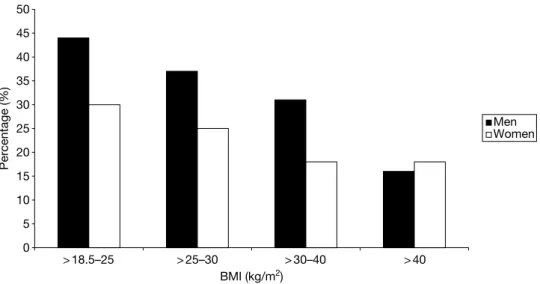
Age, weight and ethnic group are the three factors that most influence the prevalence of T2DM in the UK. The risk of diabetes is much higher in people of South Asian ethnicity (i.e., from the Indian subcontinent: Pakistan, India, Bangladesh, Nepal) (see Figure 1).
Treatment of type 2 diabetes mellitus
Reports of children with T2DM have only recently appeared in the UK.25 Compared with type 1 diabetes mellitus (T1DM), children with T2DM who presented later (12.8 years versus 9.3 years) were mostly female, overweight or obese (92% versus 28%) and a high proportion belonged to ethnic minorities. Like their adult counterparts, South Asian children have an increased risk of T2DM (RR = 13.7) compared to white children in the UK. It is therefore becoming clear that preventive interventions may also need to target a younger age group than previously thought to prevent progression to diabetes and heart disease later in life.
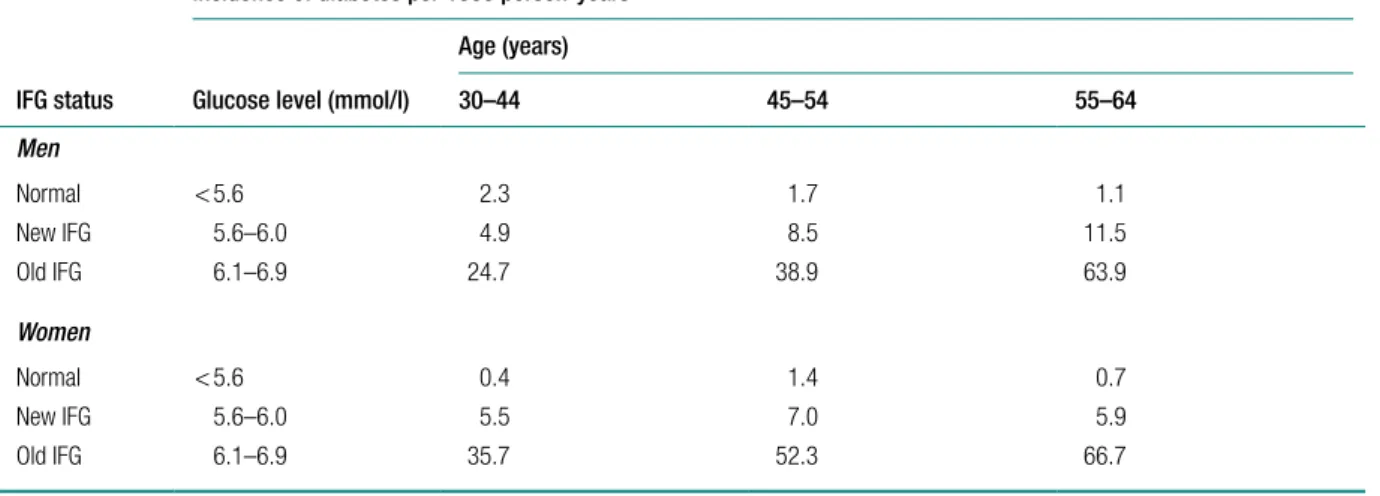
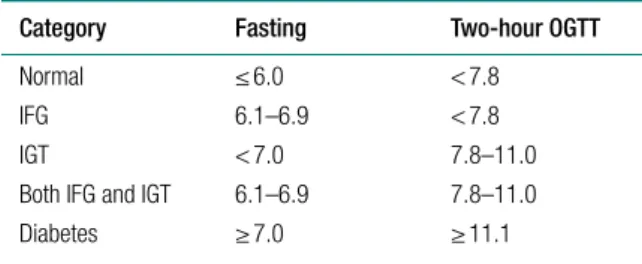
Epidemiology of impaired glucose regulation Definitions
In the USA, Nichols et al. 2007)43 compared the rates of progression of diabetes in humans with. In the Danish arm of the ADDITION42 study, the rate of IGT progression to diabetes in the first year was 18.9 per 100 person-years.
Quality of life
Current service provision for impaired glucose regulation
Whole population screening was assessed against the UK NSC criteria and did not meet a number of the criteria. However, the UK National Screening Committee has identified the need for a Vascular Risk Management Programme, which includes diabetes.
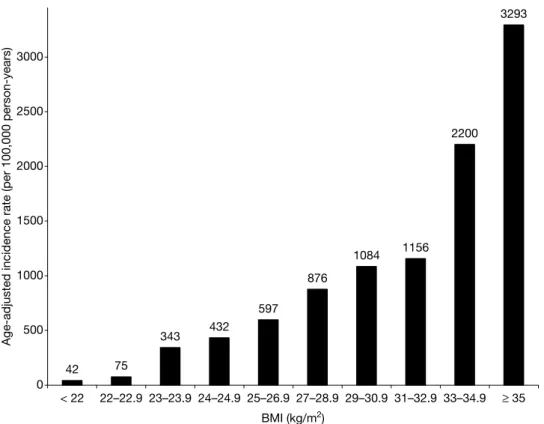
Obesity
When stratified by ethnic group, WC and WHR were generally found to have larger areas under the curve than BMI. In white English people, WHR in men and both WC and WHR were significantly better than BMI.
Qualitative aspects of diet
Receiver operating curves for the association of total diabetes with BMI, WC, and WHR for adults ≥ 40 years of age showed that WHR and WC generally had larger areas under the curve than BMI for both sexes, reflecting a statistically significant (p < 0.05) higher discriminative power for these two measures than for BMI. WC and WHR were significantly better predictors of future diabetes for both US white men and women and US black women.
Physical activity
However, no further risk reduction was observed in men who engaged in moderate-intensity activity (RR conducted a systematic review of moderate-intensity physical activity and diabetes risk. The higher risk of injury in high-intensity activity could have a strong negative impact on adherence to high-intensity physical activity compared to low-intensity activity.
Summary
Supporting evidence was also reported by Dishman and Buckworth, who found that, compared to moderate- or high-intensity activities, a greater increase in physical activity was observed for low-intensity activities. One issue is whether improving physical fitness can improve health, even in the absence of weight loss.
Current recommendations
Ethnicity
The prevalence of diabetes may be underestimated depending on the criteria used to diagnose diabetes in South Asians. This difference was greatest in South Asians with 20.3% having impaired glucose regulation by full WHO criteria compared with 4.4% by ADA criteria.
Diabetes associated risk factors in South Asians Waist–hip ratio
Physical activity is much lower in South Asians than in Europeans Fischbacher et al. 2004)160 reviewed 12 studies on levels of physical activity and fitness in South Asians (Indians, Pakistanis and Bangladeshis). Results in adults consistently showed lower levels of physical activity in South Asians than in the general population or white groups (South Asians' activity levels were.
Glycaemic control in South Asians
Comparing immigrants from the same community (Bhatia community in Gujarat) in Tanzania and the UK, diabetes mellitus and cardiovascular risk factors excluding hypertension were high in people living in Tanzania compared to immigrants to the UK. An older study by Samanta et al. 1991)155 from Leicester noted a marked difference in activity between South Asians and white people: 8% active compared to 33% active. 2002)161 noted that the barriers to physical activity in South Asian Muslim women were culture, language, religion, age and socio-economic status.
Complications of diabetes mellitus in South Asians
The reasons for poor glycemic control can be problems with adherence and education level, language barriers and fatalistic attitudes towards disease status.166,167 A cross-sectional study to assess the understanding of diabetes in the South Asian community reported that 28%. Thirty percent of Bangladeshi men had never attended school, compared to 0% of Indians and Pakistanis, and 18% of Bangladeshi women did not attend school, compared to 5%.
Predictors of diabetes in South Asians
Reasons for poor glycemic control may include problems with compliance and education levels, language barriers, and fatalistic attitudes toward disease status.166,167 A cross-sectional survey to assess understanding of diabetes in the South Asian community reported that 28%. of patients did not understand the term diabetes and 13% could not give any description; 22%. were unable to suggest any risk factors; and 20% could not provide a preventive measure.168 Among ethnic groups, Bangladeshis had lower levels of knowledge and education than Indians and Pakistanis. Thirty percent of Bangladeshi males had never attended school, compared to 0% of Indians and Pakistanis, and 18% of Bangladeshi females had never attended school compared to reports that mean fasting and 2-hour C-peptide concentrations and 2-hour insulin concentrations were significantly higher in Gujarati Indians than in whites and Afro-C people. sets of ribs.
Progression from impaired glucose tolerance to diabetes
1991)149 reported that mean fasting and 2-hour C-peptide concentration and 2-hour insulin concentration were significantly higher in Gujarati Indians than whites and Afro-Caribbean people (p < No significant differences were found between the white and Afro-Caribbean groups.
Prevalence of diabetes and other risk factors in populations with African origin
This could be due to the lower levels of cholesterol and higher levels of HDL-C than in Caucasians and Asians.145,174.
Prevalence of risk factors among people of Chinese origin
Research question
A significantly greater percentage of patients in the intensive lifestyle intervention (AHA step 2 and endurance training) (67%) achieved NGT at least once during 24 months than in the control group (30%). Participants in the control group received no dietary or exercise advice for the duration of the study.
Summary of findings from previous review
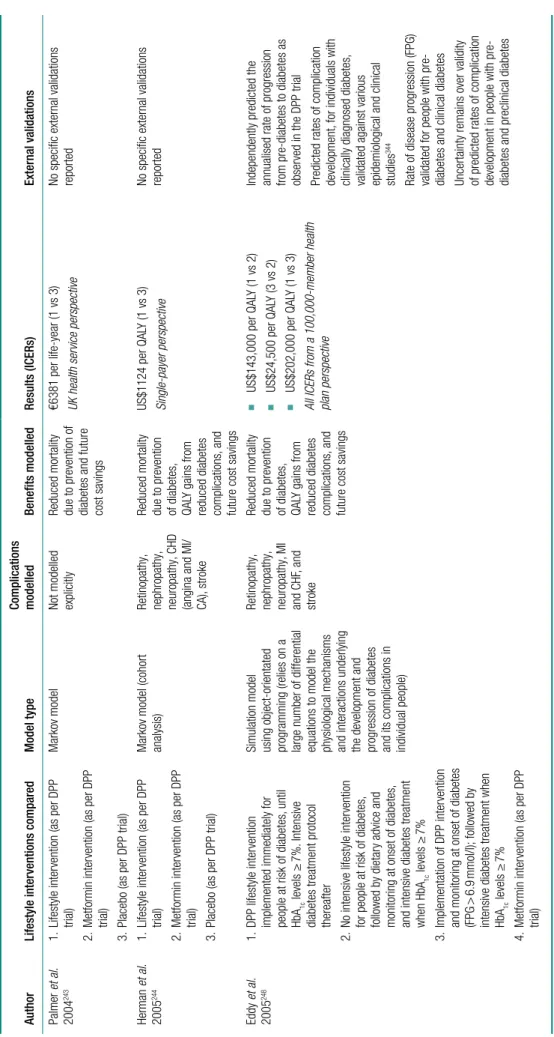
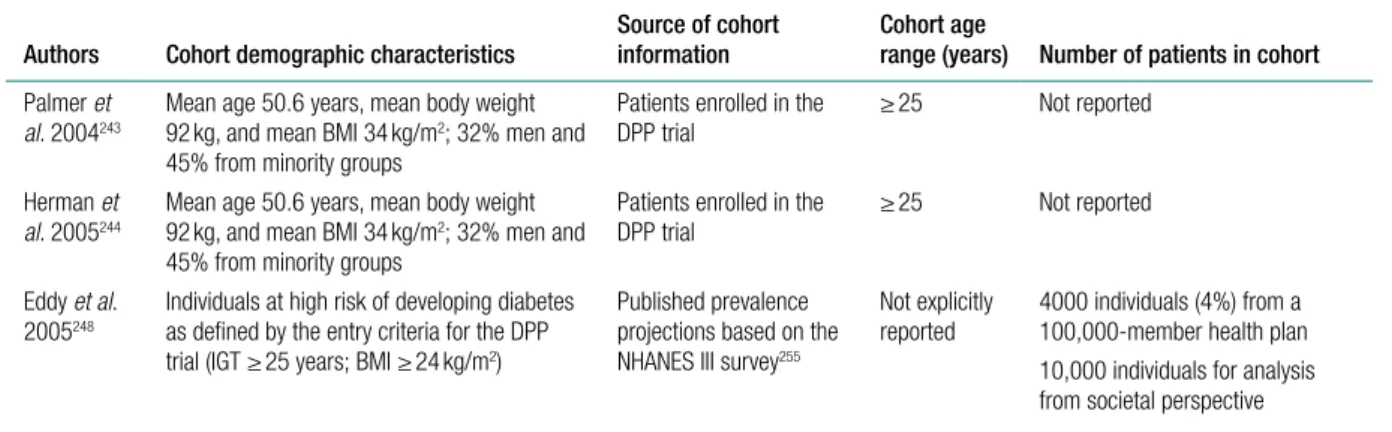
Thus, the findings of Eddy et al.243,244 are much less favorable than those of previous analyzes that evaluated the cost-effectiveness of DPP interventions. The incremental cost per QALY was also found to be sensitive to the discount rate, and most notably, the cost of the lifestyle intervention.
Discussion
It is unclear whether or not this increased risk is captured by Eddy et al.'s model. In Eddy et al.'s model, it appears that the lifestyle intervention affects quality of life only through its impact on the progression of diabetes and its complications.
Studies published since August 2006
However, their results indicated that the costs of the intervention were offset by savings, so that the QALY gain (of 0.20 at probably 6 years - the duration is unclear) is achieved at a lower cost than the non-prevention arm; prevention dominates in ICER terms. 2007)226 of the Indian Diabetes Prevention Program have published their cost and cost-effectiveness estimates. Another Australian study by Colagiuri and Walker (2008)270 used a different model – the Diabetes Cost-Benefit Model – to assess the cost-utility of screening for undiagnosed diabetes.
Conclusions/recommendations
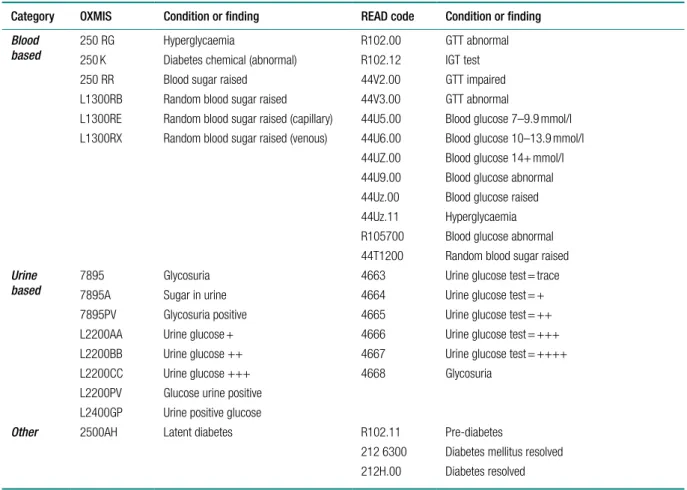
In the UK there is currently no national screening program for diabetes mellitus or IGT/IFG. IGT/IFG cases Those without a subsequent diagnosis of diabetes mellitus for at least 1 month after the index date.
Conclusions
Discussion
Statement of principal findings
Clinical effectiveness evidence issues
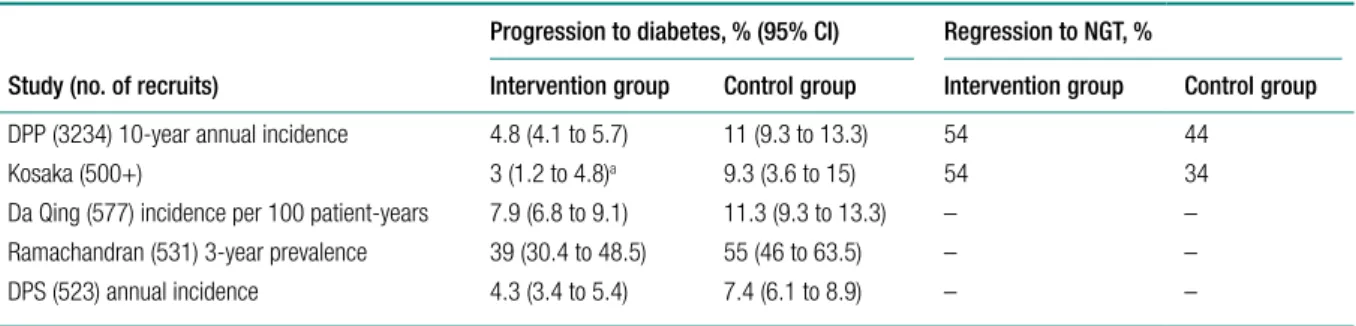
Trials were conducted in populations worldwide (China, Finland, India, USA, Japan, Netherlands, UK); as such, genetic and cultural variation can potentially confound the results. Progression rates varied considerably, with 80% of the intervention group in the Chinese trial (Da Qing190) progressing to diabetes.
Cost-effectiveness
Some lifestyle interventions were individualized, while others were delivered in groups, and the number of intervention contacts, for example with a dietitian, varied between trials. The analysis was not based on ITT, and as several subjects in the control groups developed diabetes and were withdrawn from the study due to treatment, this could have confounded the results.
Probabilistic sensitivity analysis
Threshold for discontinuing the lifestyle intervention
Adherence to lifestyle recommendations
Should intervention be earlier than at impaired glucose tolerance stage?
Implementation
All but one of the studies included in the review reported significant weight loss among participants. The conclusion of the review was that the role of physical activity independent of other lifestyle changes in the treatment of pre-diabetes remains uncertain.
Acknowledgements
Contribution of authors
Prevention of type 2 diabetes mellitus through lifestyle changes among subjects with impaired glucose tolerance. Increased physical activity is a cornerstone in the prevention of type 2 diabetes in high-risk individuals.