North Bristol NHS Trust Operational Plan 2017/18 to 2018/19
3
rdFebruary 2017
(version 3.2_PUBLIC)
Contents
1 Executive Summary ... 4
1.1 Introduction ... 4
1.2 Summary of progress against 2016/17 objectives ... 5
1.3 Objectives and priorities 2017 to 2019 ... 8
1.4 Key planning assumptions ... 9
1.5 Key risks to the delivery of this plan ... 11
2 Activity Plan ... 12
2.1 Planning assumptions ... 12
2.2 Summary activity plans ... 13
3 Quality Plan ... 14
3.1 Approach to Quality Improvement ... 14
3.2 Summary of the Quality Improvement Plan ... 15
3.3 Summary of Quality Impact Assessment process... 18
3.4 Monitoring quality standards ... 19
4 Workforce Plan ... 21
4.1 Workforce planning methodology ... 21
4.2 Workforce efficiency ... 21
4.3 Maintaining a safe and sustainable workforce ... 23
4.4 Workforce transformation ... 23
5 Financial Plan ... 25
5.1 Background & context ... 25
5.2 Financial forecasts and modelling ... 25
5.3 Efficiency savings for 2017/18 and 2018/19 ... 29
5.4 Capital Planning ... 30
6 Link to Sustainability & Transformation Plan (STP) ... 31
Figure 1 : Model used to determine objectives and priorities 8
Figure 2 : 2017/18 and 2018/19 Corporate Objectives 8
Figure 3 : 2017/18 Priorities 9
Figure 4 : 2017/18 activity plan 13
Figure 5 : Quality improvement governance structure 14
Figure 6 : Safety and Patient Experience Improvement Programme structure 16
Figure 7 : Trust QIA process 18
Table 1 : Progress against 2016/17 objectives 5
Table 2 : Progress and achievements in 2016/17 5
Table 3 : Key risks to the delivery of the operational plan 11
Table 4 : CQC domain improvement 2014 to 2015 15
Table 5 : Safety and Patient Experience priority workstreams 16
Table 6 : 2016/17 control total plan 25
Table 7 : 2017/18 and 2018/19 bridge analysis 27
Table 8 : Summary of 2016/17 to 2018/19 financial plan 28
Table 9 : 2017/18 cash flow plan 28
Table 10 : 2017/18 capital plan 30
Table 11 : Alignment of STP principles and NBT Strategy 31
Executive Summary
1 Executive Summary
1.1 Introduction
This Operational Plan builds on our five-year Strategic Plan published in 2016 and is a key output of our annual business planning process.
The plan sets out how we are going to respond to local and national challenges and continue our improvement journey.
We recognise the size of the challenge we face, but take confidence from the progress made in 2015/16 and 2016/17 on our Financial Recovery Plan (FRP), Care Quality Commission (CQC) domain ratings, operational performance improvement and the strategic intent of the Sustainability and Transformation Plan (STP) for Bristol, North Somerset and South Gloucestershire (BNSSG).
We have identified a number of risks that could impact the deliverability of this plan, and have defined actions to mitigate these. The key risks are shown in Section 1.6.
This plan is based on clear and pragmatic assumptions, that are summarised in Section 1.4, and defined in more detail in the activity, workforce, quality and finance sections of this plan.
North Bristol NHS Trust
North Bristol NHS Trust (NBT) is a centre of excellence for health care in the South West, we employ over 8,000 staff and have an annual turnover of £548 million.
65% of our income for patient care comes from the three Clinical Commissioning Groups (CCGS) of Bristol, North Somerset and South Gloucestershire. Most of the remaining 35% comes from NHS England (NHSE) as income received for the specialist services we provide.
Our vision is: “We will realise the great potential of our organisation by empowering our skilled and caring staff to deliver high-quality, financially sustainable services in state-of-the-art facilities. Clinical outcomes will be excellent and with a spirit of openness and candour we will ensure an outstanding experience for our patients.”
Our strapline is: Exceptional healthcare personally delivered Our values are:
Executive Summary
1.2 Summary of progress against 2016/17 objectives
The Trust’s operating plan for 2016/17 was designed to deliver the first year of the Trust’s five-year strategy and trust objectives were aligned to the eight themes of the strategy.
Each objective was underpinned by a number of actions, supported by milestones and key performance indicators, to enable progress to be monitored. In total, 57 actions were defined and the status of these (as at January 2017), is summarised below.
Table 1 : Progress against 2016/17 objectives
Action status (as at January 2017) #
Completed 22
Work-in-progress (to be completed by March 2017) 32 Not started – to be carried forward to 2017/18 3
Total 57
Progress and achievements against each of the eight strategic themes are shown in the table below.
Table 2 : Progress and achievements in 2016/17
Strategic themes Progress and achievements
1. Change how we deliver services to generate affordable capacity to meet the demands of the future
• Financial Recovery Plan updated and approved - the Trust is on track to meet its 2016/17 savings target
• Sale of Frenchay land
• Completion of phase 2 of the new Pathology Sciences Building
• Implementation of a range of internal service
reconfigurations to improve patient flow, including: ED streaming (Observation Unit), Acute Medical Unit (AMU), Ambulatory Emergency Care (AEC), Surgical Assessment Unit (SAU), hot clinics, Renal day case unit
• Implemented an Elective Recovery Programme to increase productivity, for example the number of surgical cases increased from 102 to 119 per day
2. Be one of the safest trusts in the UK
• Critical Care capacity increased from 40 to 46 beds
• Reduced same-day cancellations by 27% in Surgery
• Outstanding practice noted by the Care Quality Commission (CQC), in major trauma, dementia care and pre-admission prescribing services
• Our Pharmacy service won the Patient Safety
Executive Summary
Strategic themes Progress and achievements
category at the Exceptional Healthcare Awards
• Mortality indicators remain below 100, resulting in fewer observed deaths than would be expected for the case-mix of patients we treat (as measured by Hospital Standardised Mortality Ratio (HSMR) and Summary Hospital-level Mortality Indicator (SHMI))
• Implementation of Safecare Live to ensure consistent safe staffing
3. Treat patients as partners in their care
• Ask 3 questions patient engagement approach established to ensure patient involvement in key decisions
• Carers Strategy Group established to improve the involvement of carers in key decisions
• Bed-side welcome booklet launched to improve the availability of patient information
4. Create an exceptional workforce for the future
• Implemented improved workforce planning and recruitment processes to reduce reliance on temporary staff
• The Trust registered as an apprenticeship provider
• The Trust was selected by Health Education England (HEE) as the lead employer across BNSSG and Bath Swindon Wiltshire (BSW) STP footprints for the implementation of a new Nursing Associate role
• The MRI Breast Imaging team won team of the year at the Bristol Evening Post Healthcare Awards 5. Devolve decision making and
empower clinical staff to lead
• A leadership coaching programme was established in preparation for Service Line Management (SLM)
6. Maximise the use of technology so that the right information is available for the key decisions
• Lorenzo (our electronic patient record system), and supporting processes were stabilised
• A new Pathology IT system (LIMS), was implemented across BNSSG and Bath, in partnership with
University Hospitals Bristol, Weston Area Health NHS Trust and Public Health England
• 50% of staff update training is now delivered through e-Learning, reducing non patient-facing time
• A range of IT services were implemented to improve patient flow, for example electronic whiteboards and operational dashboards
7. Enhance patient care through
research • Draft Research and Innovation strategy produced 8. Play our part in delivering a • Supported the development of the Sustainability and
Executive Summary
Strategic themes Progress and achievements successful health and care
system
Transformation Plan (STP) for BNSSG
• Established clinical networks in Vascular, Urology and Breast services
• Worked with United Hospital Bristol to develop an integrated sexual health service for Bristol
Executive Summary
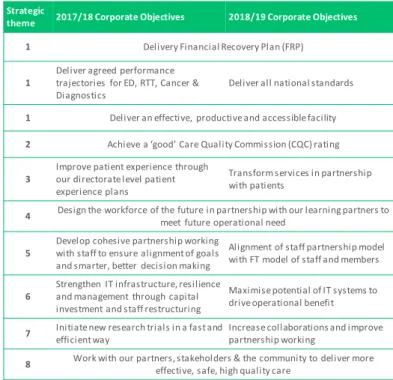
1.3 Objectives and priorities 2017 to 2019
2017/18 will be the second year of the Trust’s five-year strategy and the eight themes of the strategy have continued to inform corporate objectives, directorate Integrated Business Plans (IBPs) and priorities, as shown below.
Figure 1 : Model used to determine objectives and priorities
As part of our annual planning process, 2017 to 2019 corporate objectives, shown below, were agreed by Trust Board and then broken down into primary and secondary outcomes. The actions required to deliver these outcomes were then defined and used to inform directorate plans.
Figure 2 : 2017/18 and 2018/19 Corporate Objectives
2016-2021 NBT Strategic Themes
1. Change how we deliver services to generate affordable capacity to meet the demands of the future
2. Be one of the safest trusts in the UK 3. Treat patients as partners in their care 4. Create an exceptional workforce for the future
5. Devolve decision making and empower clinical staff to lead 6. Maximise the use of technology so that the right information is available for the key decisions
7. Enhance patient care through research
8. Play our part in delivering a successful health and care system 2017-19 Directorate
Plans 2017-19 NBT Corporate
Objectives 2016-2021 NBT Strategy 2016-2021 BNSSG Sustainability &
Transformation Plan (STP) External Context: NHSE, NHSI, CQC
2017/18 Priorities
Strategic
theme 2017/18 Corporate Objectives 2018/19 Corporate Objectives
1 Delivery Financial Recovery Plan (FRP)
1 Deliver agreed performance trajectories for ED, RTT, Cancer &
Diagnostics Deliver all national standards
1 Deliver an effective, productive and accessible facility 2 Achieve a ‘good’ Care Quality Commission (CQC) rating
3 Improve patient experience through our directorate level patient experience plans
Transform services in partnership with patients
4 Design the workforce of the future in partnership with our learning partners to meet future operational need
5 Develop cohesive partnership working with staff to ensure alignment of goals and smarter, better decision making
Alignment of staff partnership model with FT model of staff and members
6 Strengthen IT infrastructure, resilience and management through capital investment and staff restructuring
Maximise potential of IT systems to driveoperational benefit 7 Initiate new research trials in a fast and
efficient way Increase collaborations and improve
partnership working
8 Work with our partners, stakeholders & the community to deliver more effective, safe, high quality care
2017-19 Directorate Plans 2017-19 NBT Corporate
Objectives 2016-2021 NBT Strategy 2016-2021 BNSSG Sustainability &
Transformation Plan (STP) External Context: NHSE, NHSI, CQC
2017/18 Priorities
Executive Summary
Our clinical and operational leaders then worked together to agree the Trust’s priorities for 2017/18 and the key performance indicators to track progress, and these priorities are summarised in the figure below.
Figure 3 : 2017/18 Priorities
Critical to success will be the pace and scale of change to be delivered by the Sustainability and Transformation Plan and we will continue to work with our STP partners to design and implement a sustainable model of health and social care across BNSSG - examples of where we are already leading this work are included in section 6.
1.4 Key planning assumptions
Below are the key planning assumptions used to develop this plan. Further detail on the assumptions used can be found in the relevant section.
Activity assumptions
• We have applied a 2% non-elective growth assumption from 2016/17 to 2017/18 in medicine and A&E attendances and a 2% non-elective growth assumption from 2017/18 to 2018/19
• We have applied a flat elective activity profile assumption from 2016/17 to 2017/18 and a 2% elective growth assumption from 2017/18 to 2018/19
• Activity plans will deliver the key national standard performance trajectories submitted to NHS Improvement (NHSI)
• The activity plans have been aligned to workforce plans and any additional non- recurrent costs have been assumed to be covered in corresponding increases in income.
Strategic
theme 2017/18 Priorities Key performance indicators (KPIs) 1 Reduce Length of Stay by 10%
• Length of Stay (LoS)
• Bed occupancy rate
• Patients with >7day LoS 1 Deliver theatre productivity improvements
• No. cases per day
• Cancellation rate
• Day case rate 1 Deliver outpatient productivity
improvements • Did not attend (DNA) rate
• Clinic utilisation rate 1 Rationalise our retained estate • Cost/ m2
• Estate servicedesk issues 4 Deliver workforce transformation
programme
• Staff Friends & Family Test (FFT)
• Staff survey
• Meaningful appraisal rate 6 Implement a Business IntelligenceSystem • Informed decision making
• Reduced variability 6 Upgrade our IM&T enterprise network and
improve use of digital technology
• No. IT system faults
• New ways of working
6 Improve data quality • Decisions made on trusted
information 8 Work with partners to design & implement
a sustainable emergency care model across BNSSG
• Emergency care model for Weston agreed and implemented by STP partners
2017-19 Directorate Plans 2017-19 NBT Corporate
Objectives 2016-2021 NBT Strategy 2016-2021 BNSSG Sustainability &
Transformation Plan (STP) External Context: NHSE, NHSI, CQC
2017/18 Priorities
Executive Summary
Quality assumptions
• We will use our established quality governance structure and Quality Impact Assessment (QIA) process to support the implementation of our FRP and track the impact of our Safety and Patient Experience programme
• The objective to be one of the safest trusts in the UK and treat patients as partners in their care will be driven by our quality improvement programme
• We will use our Quality & Safety Improvement Team and Quality Improvement Faculty to continue to develop our internal quality improvement capacity and capability and through the STP we will continue to work with the AHSN to design and adopt a system-wide methodology for quality improvement.
Workforce assumptions
• We have assumed no redundancies – any reduction in funded posts will be achieved through turnover and existing vacancies
• We have assumed an improvement in annual turnover from 15.4% (2016) to 12.5% for 2017/18
• We have assumed recruitment can deliver the same volume as 2016/17 if required
• We will continue our STP leadership role for the development of new roles and support the move towards a shared recruitment strategy and collaborative working on apprenticeships
• We will continue to work with our commissioners to find a sustainable funding model that will enable us to deliver on the four priority standards for seven-day hospital services.
Finance assumptions
• The Trust has accepted the 2017/18 control total of £18.751m
• In 2018/19 the Trust would like to take advantage of the offer to agree a control total as part of an agreed recovery trajectory and has asked NHSI to consider a control total of £18m.
• Pay inflation assumes 1% pay award and increment for all eligible staff which for NBT is £0.8m higher than national assumptions funded in tariff
• Clinical Negligence Scheme for Trusts (CNST) premium as notified by the NHS Litigation Authority represents a 40% increase over 2016/17
• The impact of the junior Doctor contract has been calculated at £2m
• Sustainability and Transformation funding will be received by the Trust in 2017/18 and 2018/19
• Delivery of 80% of CQUIN schemes in 2017/18 and 2018/19
Executive Summary
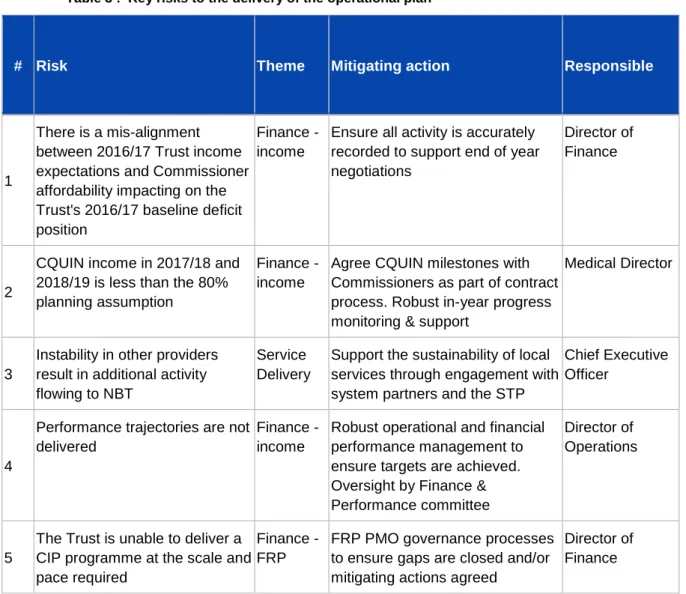
1.5 Key risks to the delivery of this plan
The table below shows the key risks to the delivery of this plan.
Table 3 : Key risks to the delivery of the operational plan
# Risk Theme Mitigating action Responsible
1
There is a mis-alignment between 2016/17 Trust income expectations and Commissioner affordability impacting on the Trust's 2016/17 baseline deficit position
Finance - income
Ensure all activity is accurately recorded to support end of year negotiations
Director of Finance
2
CQUIN income in 2017/18 and 2018/19 is less than the 80%
planning assumption
Finance - income
Agree CQUIN milestones with Commissioners as part of contract process. Robust in-year progress monitoring & support
Medical Director
3
Instability in other providers result in additional activity flowing to NBT
Service Delivery
Support the sustainability of local services through engagement with system partners and the STP
Chief Executive Officer
4
Performance trajectories are not delivered
Finance - income
Robust operational and financial performance management to ensure targets are achieved.
Oversight by Finance &
Performance committee
Director of Operations
5
The Trust is unable to deliver a CIP programme at the scale and pace required
Finance - FRP
FRP PMO governance processes to ensure gaps are closed and/or mitigating actions agreed
Director of Finance
Activity Plan
2 Activity Plan
We have applied a robust capacity & demand planning process, based on:
• 6-months of 2016/17 data
• Use of the Indicative Hospital Activity Modelling (IMAS) tool, as required in the planning guidance
• Additional check and challenge by the Intensive Support Team (IST).
2.1 Planning assumptions
Our activity plans are based on the following assumptions:
Non-elective planning assumptions
• 2% non-elective growth assumption from 2016/17 to 2017/18 in medicine and A&E
• 2% non-elective growth assumption from 2017/18 to 2018/19
• 2017/18 non-elective maternity growth is based on the CCG demographic model - 1.5% growth vs. 2016/17 forecast outturn (FOT)
• Delayed Transfers of Care (DTOC) and adherence to operational standards will continue at 2016/17 rates
• Patients who no longer require acute care and should be managed in the community for rehabilitation are managed in this setting in 2017/18 onwards and the notification given to commissioners to request this in 2016/17 is enacted
• Medical staff vacancies are filled in accordance to the directorate workforce plans.
• NBT will be supported and reimbursed for costs (delivery and opportunity cost) associated with taking on any additional non-elective activity as a result of other providers’ workforce or sustainability issues.
Elective planning assumptions
• Flat elective activity profile from 2016/17 to 2017/18
• 2% elective growth assumption from 2017/18 to 2018/19
• Theatre efficiency programme to increase day case activity across all specialties
• Through our Elective Improvement Programme we will increase the average number of cases per day.
• OP productivity has been reflected within specialty plans and is based on reducing DNAs, improving clinic utilisation and reducing cancellations
Activity Plan
• The impact of Quality, Innovation, Productivity and Prevention (QIPP) and Commissioning for Quality and Innovation (CQUIN) priorities will be incorporated in activity plans once these have been agreed with our commissioners
• The activity plans have been aligned to workforce plans and any additional non- recurrent costs have been assumed to be covered in corresponding increases in income.
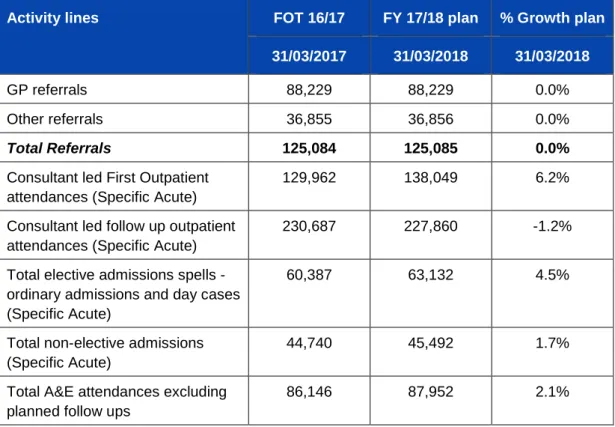
2.2 Summary activity plans
The table below shows a summary of our 2017/18 activity plan
Figure 4 : 2017/18 activity plan
Activity lines FOT 16/17 FY 17/18 plan % Growth plan 31/03/2017 31/03/2018 31/03/2018
GP referrals 88,229 88,229 0.0%
Other referrals 36,855 36,856 0.0%
Total Referrals 125,084 125,085 0.0%
Consultant led First Outpatient attendances (Specific Acute)
129,962 138,049 6.2%
Consultant led follow up outpatient attendances (Specific Acute)
230,687 227,860 -1.2%
Total elective admissions spells - ordinary admissions and day cases (Specific Acute)
60,387 63,132 4.5%
Total non-elective admissions (Specific Acute)
44,740 45,492 1.7%
Total A&E attendances excluding planned follow ups
86,146 87,952 2.1%
Quality Plan
3 Quality Plan
3.1 Approach to Quality Improvement
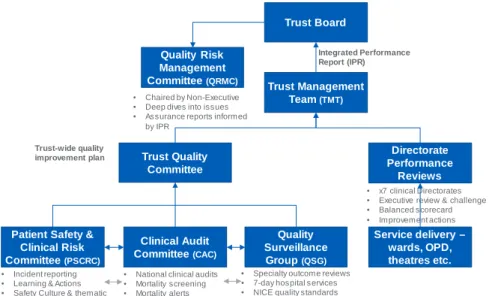
Governance structure
The named executive leads accountable for quality improvement at NBT are the Medical Director (safety and clinical effectiveness) and Director of Nursing (patient experience).
Figure 5 : Quality improvement governance structure
The Deputy Medical Director, Associate Medical Director for Safe Care, Quality and Safety and the Head of Patient Experience are responsible for leading the quality improvement programme. The governance structure to support delivery of the quality improvement plan is shown in the figure above.
Addressing Care Quality Commission (CQC) actions
Progress against actions resulting from Care Quality Committee (CQC) inspections are included in the Integrated Performance Report (IPR) and reported to Trust Board, Quality Committee and Quality Risk Management Committee.
The Trust was last inspected by the CQC in December 2015 and must-do actions and recommendations were incorporated into the Trust’s improvement plan. All actions from the December 2015 inspection were implemented by the agreed timescales.
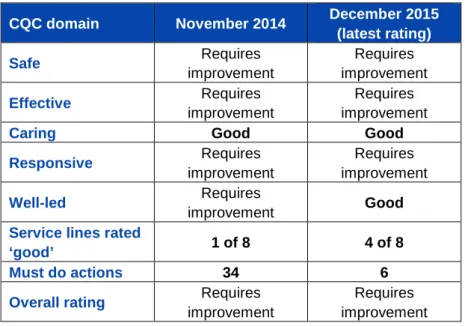
As shown in the table below, the improvement plan is delivering – 2 domains and 4 of 8 service lines are now rated good and at the last inspection, outstanding practice was noted in major trauma, dementia care and pre-admission prescribing.
To support the journey towards an overall CQC rating of good, the Trust also uses its internal auditors (KPMG) to provide independent assurance all actions have been fully implemented.
Trust Board
Trust Management Team (TMT)
Trust Quality Committee
Quality Risk Management Committee (QRMC)
Quality Surveillance Group (QSG) Clinical Audit
Committee (CAC)
Directorate Performance
Reviews
• National clinical audits
• Mortality screening
• Mortality alerts
• x7 clinical Directorates
• Executive review & challenge
• Balanced scorecard
• Improvement actions
• Specialty outcome reviews
• 7-day hospital services
• NICE quality standards
• Chaired by Non-Executive
• Deep dives into issues
• Assurance reports informed by IPR
Trust-wide quality improvement plan
Integrated Performance Report (IPR)
Service delivery – wards, OPD, theatres etc.
Patient Safety &
Clinical Risk Committee (PSCRC)
• Incident reporting
• Learning & Actions
• Safety Culture & thematic review
Quality Plan
Table 4 : CQC domain improvement 2014 to 2015
CQC domain November 2014 December 2015 (latest rating)
Safe Requires
improvement
Requires improvement
Effective Requires
improvement
Requires improvement
Caring Good Good
Responsive Requires
improvement
Requires improvement
Well-led Requires
improvement Good
Service lines rated
‘good’ 1 of 8 4 of 8
Must do actions 34 6
Overall rating Requires improvement
Requires improvement Improvement methodology
Quality improvement projects are implemented using established methodologies, including, but not limited to, Plan Do Study Act (PDSA), driver diagrams, experienced based co-design and rapid improvement events.
As defined in the STP we will continue to work with the Academic Health Science Network (AHSN), and our provider partners to develop a BNSSG system-wide methodology for quality improvement.
3.2 Summary of the Quality Improvement Plan
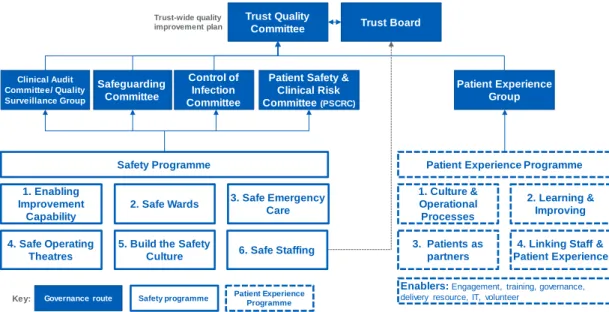
The figure below shows how our quality improvement programme (safety and patient experience), feeds into our quality improvement governance process. The programme’s priorities are informed through local commissioning intentions, including CQUIN schemes, internal risk assessment (incident reporting, complaints and risk registers), regulatory actions and staff engagement. The Trust’s quality priorities are aligned to the STP thorough executive level engagement with the detailed plans and the contribution NBT plays in their delivery.
Quality Plan
Figure 6 : Safety and Patient Experience Improvement Programme structure
Our quality improvement plan aligns with the Trust Strategy, for example:
• As part of theme 2, to be one of the safest trusts in the UK, we will maintain our HSMR rate below 100 and ensure the quality improvement governance process is developed to incorporate continuous learning into our safety programme, supported by robust measurement
• Theme 3, patients as partners in their care, forms part of our Patient Experience programme. We will continue to apply shared decision-making across the Trust, building on our Ask 3 Questions initiative, continuing to support the Patients as Leaders programme, developing the pan-Bristol healthcare change-makers forum in partnership with UH Bristol Foundation Trust, Bristol Community Health, NHS England and the Kings Fund
• As part of theme 5, devolve decision making and empower front-line staff, we will enable and empower our clinical leadership teams so they are both supported and held to account for quality, safety and patient experience.
The table below shows the focus areas of the programme. These areas are informed by national, local and commissioner priorities, CQUIN schemes, risk registers, learning from incidents, complaints and risk assessments and CQC inspections.
Table 5 : Safety and Patient Experience priority workstreams
Programme Workstream Focus areas
Safety
1. Enabling Improvement Capability
The Quality Improvement Team – that provides improvement and human factors coaching support and training to front line individuals and teams. This team work in the system as well as on the system.
The Improvement Network (IN) formed of staff skilled in patient safety, quality improvement, human factors, organisational development and innovation.
Trust Quality Committee
Safeguarding Committee Clinical Audit
Committee/ Quality Surveillance Group
Trust-wide quality improvement plan
Control of Infection Committee
Patient Experience Group
1. Enabling Improvement
Capability
2. Safe Wards 3. Safe Emergency Care
4. Safe Operating Theatres
5. Build the Safety Culture
1. Culture &
Operational Processes
2. Learning &
Improving
3. Patients as partners
4. Linking Staff &
Patient Experience
Safety programme Patient Experience Programme Governance route
Key:
Safety Programme Patient Experience Programme
Enablers: Engagement, training, governance, delivery resource, IT, volunteer
6. Safe Staffing
Trust Board
Patient Safety &
Clinical Risk Committee (PSCRC)
Quality Plan
Programme Workstream Focus areas
2. Safe Wards
Falls, medicines, Pressure Ulcers, Deterioration (Sepsis, AKI, NEWS, Fluids), Safe Indwelling devices, Safe Handover & Discharge, Care Bundles, Ward/Board rounds, Safety Thermometer & back to the Floor, End of Life Care
3. Safe
Emergency Care
Emergency Checklist, ED Quality Standards, Care Bundles
4. Safe Operating Theatres
Peri-Operative Care, NatSSIPS, Emergency Laparotomy, WHO Checklist
5. Build the Safety Culture
Learning from incidents/complaints, Culture survey, Leadership walk rounds
6. Safe Staffing Acuity/dependency, staffing levels, bank/agency, enhanced care, care hours/patient day
Patient Experience
1. Culture &
Operating Processes
Translate output from TDA assessment tool to
directorate objectives and plans; support directorates to implement and measure improvement in the experience of patients, engaging with them in service delivery and improvement.
2. Learning &
Improving
FFT response rate & use of data; national survey – improve thematic review & outcome; quality & timely complaint handling; Improve carer experience
3. Patients as Partners
Embed and spread the shared decision-making model of
‘Ask 3 Questions; Review & improve patient experience;
strengthen patient & volunteer partnerships, improving care and service development, including pan-Bristol Healthcare change-maker forum.
4. Linking staff and patient experience
Combine reporting – staff & patient FFT; enhance iCARE training
7-day hospital services
The Trust has undertaken the required self-assessments against 7-day working. We have focused on the four clinical standards identified by NHS England and the Academy of Royal Colleges as having the most impact on weekend mortality and these will continue to be our focus in 2017 to 2019, namely; Standard 2. Time to Consultant Review; 5. Access to Diagnostics; 6. Access to consultant- directed Intervention; 8. Ongoing Review.
Our reviews give confidence that our service provision is generally in line with national averages. We have identified areas where adherence is better but recording systems are insufficient to accurately and consistently reflect clinical practice. We have established a working group to address this issue, that will link to our work on ‘paper lite’ IT systems. We will also address any service specific issues as they are identified.
Quality Plan
Commissioners have been unable to fund beyond tariff for seven day working in 2017/18 or to approve Trust investment proposals and the Trust has advised that full compliance will not be possible.
During 2017/18 there will be a regional exercise to undertake gap analysis of standards compliance which will identify the opportunity to close this gap through a phased approach to service reconfigurations and activity centralisation.
Commissioners and the Trust will also work together as part of the STP urgent care programme through the duration of the contract, to achieve compliance for network specialist services and make progress towards the 2020 Seven Day Standards, based on agreement of explicit Commissioner priorities.
Commissioners agree not to apply contractual levers in respect of seven day standards where the provider has identified an investment requirement, pending the outcome of this review process. Commissioners and the Trust commit to progressing 7 day standards outside this process where no investment is required.
3.3 Summary of Quality Impact Assessment process
Figure 7 : Trust QIA process
The Trust applies the Quality Impact Assessment (QIA) process shown here to all Financial Recovery Programme (FRP) initiatives relating to pay, and all non-pay initiatives greater than £50k
The QIA is based on the National Quality Board guidance and covers the following areas:
1. Impact on safety
2. Impact on patient experience 3. Impact on clinical outcomes
4. Impact on access to services and waiting times 5. Impact on equality and diversity
Quality Plan
All QIA’s are created within the respective directorates and with effective clinical engagement to inform their development before sign off by the Directorate Management Team. The schemes are then reviewed and approved by the Medical Director and Director of Nursing. QIAs include identification of key performance metrics to identify potential impact on patient care and these are monitored through the appropriate governance route. The overall Performance Assurance Framework identifies any impact of CIP schemes, including the cumulative impact of several schemes, at divisional level and Trust level via the Integrated Performance Report.
This report includes run charts and trend analysis to ensure performance changes are identified and responded to appropriately
In addition, a risk assessment is completed for every FRP initiative and the Trust’s Risk Management Policy is applied. The risk profile of the FRP is reviewed by the Quality and Risk Management Committee (QRMC). A fortnightly report tracks the number of QIAs requested and signed off.
3.4 Monitoring quality standards
As part of the Trust’s annual business planning process each directorate produces its own business plan using a standard template that articulates its strategic objectives, annual plans, assesses its current position and future opportunities and sets out its activity, workforce, finance and quality priorities. Interdependencies are considered and are reviewed by the corporate planning team and then by executive directors.
The ongoing delivery of these plans is performance managed through monthly Directorate Performance Review meetings, which brings the Directorate Management Team together with the Executive Team to triangulate performance across all domains through the Performance Assurance Framework. At service level, speciality outcome data is triangulated through review within directorate management structures and corporately within the Quality Surveillance Group.
The Board Integrated Performance Report (IPR) is based on the CQC domains and drives actions for improvement. The IPR includes the following quality data:
• Patient Safety Dashboard: Incident reporting inc. Never Events, Safety Thermometer, Nutrition screening, falls, pressure ulcers, WHO checklist, infection control, VTE risk assessments, Single Sex breaches and medication errors
• Safe Staffing: QUESTT Early Warning Trigger Tool, Acuity/dependency, staffing ratios, bank/agency fill rates & recruitment profile
• Clinical Effectiveness: mortality & national audit
• Patient Experience: Friends & Family Test, specific comments, complaints, concerns & compliments
• Well Led: Staffing turnover, temporary staffing requests and fill rate, safe staffing compliance, recruitment activity, rostering effectiveness, sickness absence (short & long term), mandatory training compliance
Quality Plan
• CQC Inspection – outcomes & action delivery
Narrative within the IPR itself provides an overview of specific improvement actions and the Trust Board minutes demonstrate the debate this generates and follow through of key actions.
Workforce Plan
4 Workforce Plan
4.1 Workforce planning methodology
NBT has an established workforce planning cycle that is aligned to:
• Our annual business planning process – that triangulates workforce plans with financial plans, activity plans and quality standards to ensure workforce plans are affordable, safe and sustainable
• The Trust strategy – specifically theme 4: Creating an exceptional workforce for the future and theme 5: Devolve decision making and empower frontline staff to lead.
The outputs from these two processes have been used to develop an organisational development road-map, that defines the key areas of focus for 2017/18 and 2018/19. This includes, but is not limited to:
• Enabling and empowering our clinical leadership team
• Embedding the building blocks in preparation for Service Line Management (SLM)
• Continuing the progress directorates have made to improve staff engagement, well-being and responsiveness
• Improving the percentage of staff who receive a meaningful annual appraisal and development review
• Reviewing core training by role and requirement (statutory, mandatory and patient safety) to reduce unnecessary back-fill costs by:
- Promoting the use of training passports across BNSSG organisations - Removing duplication
- Continuing to build on our success with virtual learning - 50% of update training is now delivered through e-Learning.
The Director of Workforce and Organisational Development (OD), is accountable to the Board for delivery of the workforce plan and the reporting and performance of associated workforce key performance indicators (KPIs).
A Workforce Committee, chaired by a Non-Executive Director, provides strategic oversight of the workforce plan and monitors delivery against target.
4.2 Workforce efficiency
As part of our Financial Recovery Programme (FRP) we have established a Workforce Efficiency Programme consisting of three work streams: Administration, Nursing and Midwifery and Medical. Each work stream has a nominated project, finance and HR lead to ensure progression and alignment of workforce and financial aspects.
Workforce Plan
All work streams report to a monthly Workforce Efficiency Programme Board chaired by the Director of Workforce and OD and supported by the Medical Director, Director of Nursing, Director of Finance, Director of Operations and Workforce Programme Manager.
The efficiency work streams are working alongside directorates to enable the Trust’s financial recovery process by supporting the identification and implementation of cost improvement schemes that deliver a 5% reduction in pay expenditure by year end, therefore delivering full year effect savings in 2017/18.
The 5% target was informed by peer benchmarking (although limited opportunity was noted against the Model Hospital), Lord Carter review and STP plans around back office services and acute care collaboration.
Plans will include a combination of productivity improvements, skill mix changes, consultant Programme Activity (PA) and WTE reductions. A key principle of the Workforce Programme is to minimise redundancies to avoid further cost pressures.
We acknowledge that delivering a recurrent 5% reduction in pay cost is a substantial challenge for the organisation, but we take confidence from the progress we have already made as part of our FRP - between March 2016 and April 2016 we reduced monthly pay spend by £1.3m and maintained this through 2016/17 using a combination of the controls summarised below:
• Improved recruitment processes which deliver a faster, leaner and more efficient time to hire
• In order to provide continuity of care from our staff; sustained campaign to transfer agency staff to bank and substantive roles, including joint bank and substantive recruitment campaigns and a bank auto-enrol policy
• A more robust temporary staffing approval process
• No longer using agency staff to cover gaps in unregistered nurse, porter or domestic rotas – we have achieved zero agency spend in our ancillary team since November 2015.
• Our internal target to increase the percentage of rota gaps filled by internal bank from 85% to 95% in 2017/18.
These actions support our anticipated agency expenditure within the ceiling set by NHS Improvement for 2016/17.
Other initiatives we are applying to improve workforce efficiency include:
E-rostering: The Trust uses e-rostering across ward nursing, therapies and ancillary staff and will roll this out to all medical staff in 2017. We will also begin the implementation of the Carter Good Rostering Practice Guide recommendations from January 2017.
Sickness and absence management: a number of actions are in place to increase our grip on sickness and absence management, including:
Workforce Plan
• Supporting directorates to achieve improved performance in sickness absence rates and associated back fill costs, building on recent success in our Facilities team where sickness absence has reduced by 2% year to date when compared with 2015/16
• Development and launch of an e-learning module to support existing face to face support for managers in relation to the management of sickness absence
4.3 Maintaining a safe and sustainable workforce
We will ensure our workforce plans; vacancy management and recruitment processes at service, directorate and Trust level are aligned to ensure only funded posts defined in our workforce plans are advertised. This will include an assessment of evidence base, costs, and alternative solutions e.g. skill mix reviews.
We will apply a range of techniques to attract and retain staff with the value, knowledge, skills and experience we require. We will also work with our STP partners to prevent the unnecessary movement of staff between organisations.
NBT’s annual turnover for the last 12 months between December 2015 and November 2016 averaged was 15.4%. Following an Association of UK University Hospitals (AUKUH) benchmarking exercise the Trust has set a target for 2017/18 of 12.5%. Achieving this target will focus on targeted retention plans at directorate level supported by HR Partnering and organisation wide transformation improving opportunities and career progression pathways.
4.4 Workforce transformation
We are supportive of the STP Workforce Programme objectives to deliver:
• Collaborative working on apprenticeships
• Improved staff health and well-being; shared recruitment
• Exploring with our partners the opportunity for closer working and shared resources in relation to bank and e-rostering
• A common culture and STP workforce transformation, as demonstrated by the leading role we are taking in two of these areas - apprenticeships and workforce transformation.
Collaborative working on apprenticeships
NBT is a registered apprenticeship provider (Skills Funding Agency), with OFSTED Grade 2 GOOD for provision.
The centre provides education programmes for NBT and other employers across the health and social care economy, in primary and community, social care, independent employers.
We will continue to champion the role within service line, directorate, Trust and system level workforce planning processes and lead the development of the role through level 2, 3, higher and degree qualifications. Current work includes modelling
Workforce Plan
on directorate level apprenticeship opportunities, as a key element of the workforce plans.
STP workforce transformation
NBT is a teaching and learning organisation and we are supporting and leading on a number of workforce transformation projects, for example:
Transforming Our Nursing, Midwifery and Therapy workforce
NBT has been selected by Health Education England (HEE) as the lead employer across BNSSG and Bath Swindon Wiltshire (BSW) STP footprints for the implementation of the Nursing Associate role, via a 2-year education programme.
This provides an opportunity for NBT to plan and phase the introduction of this new role into our nursing workforce and share our learning in support of a national roll- out plan.
To develop a pipeline of registered staff we are focussing on the development and retention of our clinical and non-clinical Health Care Support Workers to deliver:
• Training programme alignment for the duration of any apprenticeship
• Roles that are meaningful in their own right
• Clearly defined progression pathways.
We are working toward closer integration of Occupational Therapy (OT) and Physiotherapy services through:
• Establishment of a Head of Therapy Services
• Providing integrated professional leadership across OT and Physiotherapy
• Moving to a model where 60% of band 3 therapy support workers are in integrated roles.
Building on the success in Neurology, as part of an innovation project funded by HEE, we will pilot a band 3 Enablement Assistant role in MSK and Medicine to assist with re-enablement and wellbeing, safety and discharge combining the qualities and skills of OT, physio and nursing.
Transforming our medical workforce
We are working with HEE and University of the West of England on the development of a new Physician Associate role. We are providing placements at NBT to support the pilot of this role and we are supporting work to develop an apprenticeship route, pending results from the pilot phase.
We are supporting the design of a new Doctors Administration Assistant role to support Foundation and STP grade doctors. This is part of a national programme to support ward based and GP based role development.
Financial Plan
5 Financial Plan
5.1 Background & context
The Trust originally planned for a deficit of £48m in 2016/17 but the Board decided not to accept the control total deficit of £22m set by NHS Improvement due to the level of risk in delivery of the required savings.
At 2016/17 quarter 1 the Trust reported a deteriorated forecast deficit of £52m which included loss of £8m income.
In 2016, the Trust was placed in Financial Special Measures and the Trust has been working with NHS Improvement (NHSI) on the delivery of a Financial Recovery Plan (FRP) which is focussed on delivery of the control total in 2016/17 but also a more sustainable position going into 2017/18.
As shown in the table, for the Trust to deliver the control total of £22m a further £8m of additional improvement was required on the assumption that £14m Sustainability and Transformation Funding (STF) will be available and the commissioners do not impose £8m fines under STF rules.
Table 6 : 2016/17 control total plan
££m
Original Forecast 52.0
Additional improvement actions (8.0)
Revised deficit 44.0
Sustainability funding (14.0)
Fines (8.0)
Control Total (22.0)
At recent checkpoint meetings with NHSI, the Trust presented a plan to deliver a deficit of £43.9m, pre-STF and fines, against the required £44m.
This forecast outturn position will be revised further once there is clarity on STF and fine abatement.
5.2 Financial forecasts and modelling
Planning assumptions
The financial plan is based on the following assumptions:
• The Trust has accepted the 2017/18 control total of £18.751m
• Inflation at 2.1% from 2017/18 onwards, although NBT is subject to additional costs pressures
• National efficiency requirement of 2% 2016/17 to 2020/21
Financial Plan
• For 2018/19 the control total set by NHSI is £12.091m. However, the Trust would like to take advantage of the flexibility being offered in terms of agreeing the control total as part of an agreed recovery trajectory and has asked NHSI to consider a control total of £18m. This would allow a year of stability following two years of significant change and give an opportunity to progress the more transformational aspects of the STP Plan
• Pay inflation assumes 1% pay award and increment for all eligible staff which for NBT is £0.8m higher than national assumptions funded in tariff
• Non-pay growth assumptions include:
- CNST premium as notified by the NHSLA which represents a 40% increase over 2016/17 and a £1.9m pressure above that allowed in the tariff
- Additional depreciation of £2.3m based on a number of assets moving from assets under construction at the end of 2016/17
- Other non-pay inflation above national expectations to account for expected increases in utilities, rates and potential increases related to Brexit
• The impact of the junior Doctor contract has been calculated at £2m based on actual posts but this will require robust management of rotas to avoid penalties for non-compliance.
• Income assumptions include:
- On the basis that the Trust is accepting the control total, it is assumed that fines will not be levied and that £13.6m STF is available
- Assumes no detrimental impact from commissioner QIPP or data/pricing challenges
- Assumes delivery of 80% of CQUIN schemes in both years which presents a risk as the schemes will be challenging to deliver.
- 0.5% of the CQUIN has been included as a risk reserve as per the published planning guidance
- Based on activity modelling produced by directorates referred to in Section 2.
Financial Plan
2017/18 and 2018/19 bridge analysis
The bridge analysis included in the table below demonstrates the impact of the financial planning assumptions listed above on delivery of the agreed control totals.
Table 7 : 2017/18 and 2018/19 bridge analysis
2017/ 18
£m
2018/ 19
£m
B/f deficit (21.9) (18.8)
Non-recurrent items (7.7) (8.2)
CQUIN Risk Reserve 1.5
Non-Recurrent CIP
Sustainability funding (14.0) (13.6)
FYE CIP shortfall from 16/17 (1.2)
Underlying position (44.8) (39.1)
Inflation above national assumptions in tariff (1.0) (0.7)
Tariff efficiency (2%) (10.8) (11.0)
Other tariff impacts (2.2)
Apprenticeship Levy (1.0)
CNST above national assumptions in tariff (1.9) (1.9)
Activity Growth (no additional contribution) 0 0
Junior Doctors contract (2.0)
Depreciation (2.3) (0.7)
CQUIN Risk Reserve (1.5) (1.5)
Other net cost pressures (4.1) (2.1)
Sustainability Funding 13.6 13.6
CIP Requirement 39.2 25.4
In–year Adjusted Surplus / (Deficit) 18.8 18.0
Financial Plan
The table below provides a summary of the financial plan.
Table 8 : Summary of 2016/17 to 2018/19 financial plan
Income/ cost area 2016/17 2017/18 2018/19
£’000 £’000 £’000
Clinical Income 470,740 482,186 490,977
Non-Clinical Income 82,855 82,440 82,513
Total Income 553,595 564,626 573,490
Pay Costs 334,251 330,341 329,212
Non-Pay Costs 204,307 214,868 222,973
Financing Costs 36,934 38,148 39,305
Total Costs 575,492 583,357 591,490
Surplus/ (Deficit) (21,897) (18,731) (18,000) Cash flow plan
The table summarises the cash flow plan based on the deficit position outlined above.
Table 9 : 2017/18 cash flow plan
Cash flow £’000
Operating surplus 18,346
Add back non-cash items 26,952
Movements in working capital -8,441 Net cash inflow from operating activities 36,857
Interest received 60
land receipts 5,000
Capital purchases -10,484
Net cash inflow from investing activities 31,433 Financing
Deficit loan 18,731
Loan repayments -2,620
Capital element of PFI -9,396
Interest paid -4,284
Interest element of PFI -33,864
Financial Plan
Cash flow £’000
Net cash inflow from financing -31,433
Net movement in cash 0
Opening cash balance 1000
Closing cash balance 1000
5.3 Efficiency savings for 2017/18 and 2018/19
The £39.2m (8% of controllable expenditure) savings requirement for 2017/18 reflects the amount required to deliver the control total of £18.751m. This is a stretching target driven by the tariff deflator, cost pressures, the non-recurrent impact of 2016/17 actions and the objective to reduce the current run rate deficit.
We have assumed it will not be possible to deliver this level of savings recurrently -
£8.2m is shown as non-recurrent in the plan submitted to NHSI - which will need to be recovered in 2018/19.
For 2018/19, based on a control total of £18m, the efficiency requirement will be
£25.4m which represents approximately 5% of controllable expenditure.
Financial Plan
5.4 Capital Planning
The 2017/18 capital plan utilises funding through land sales as well as depreciation funding. The cash from the Frenchay land receipt enables key capital priorities to be met as well as further repayment of the outstanding capital loan as stated in the business case for the sale of Frenchay.
We have prioritised our IM&T investment programme and plan to invest a further
£10m across 2017/18 and 2018/19 to deliver the network upgrade (subject to NHSi approval) and the Business Intelligence scheme.
Table 10 : 2017/ 18 capital plan
2017/ 18
£’000 Expenditure
Buildings 4,949
Medical equipment 4,500
IM&T 5,900
Other 4,712
Total expenditure before charity donations 20,061
Funding
Depreciation 17,800
Asset sales 4,831
Other (2,570)
Total Funding 20,061
Surplus / (Deficit) 0
Link to Sustainability & Transformation Plan (STP)
6 Link to Sustainability & Transformation Plan (STP)
The model of care and key principles described in the STP align well with North Bristol NHS Trust’s (NBT) strategy as shown in the table below.
Table 11 : Alignment of STP principles and NBT Strategy
STP principle NBT Strategic Theme [theme ref]
Standardise and operate at scale
Change how we deliver services to generate affordable capacity to meet the demand of the future [1]
Develop system wide pathways Play our part in delivering a successful health and care system [8]
Develop a new relationship with our
population Treat patients as partners in their care [3]
Develop a new relationship between organisations and staff
Create an exceptional workforce for the future [4]
Build on existing digital work as a driver and enabler for cultural change
Maximise the use of technology so that the right information is available for the key decisions [6]
The BNSSG STP is led by a System Leadership Group, of which the CEO of NBT is a member. We will continue to support the development and implementation of the three core transformation portfolios through this and other STP delivery groups we are part of, namely the leadership, clinical, workstream, enabling and spotlight working groups. For example:
Portfolio 1: Prevention, Early Intervention and Self Care: we will help inform the allocation and phasing of any transfer of Commissioner funds to support prevention and well-being.
Portfolio 2: Integrated Primary and Community Care: we will support the re- design of end of life, frailty, diabetes and respiratory patient pathways, and help inform the benefit realisation profile for the quantitative and qualitative metrics defined in the STP e.g. 30% reduction in admissions and attendances by STP year 3 for certain long term conditions, reduction in outpatient appointments by 15%, reduction in length of stay by 20%.
Portfolio 3: Acute Care Collaboration: this portfolio will have the largest impact on NBT and is the one we are most involved in. We are supportive of the overarching objectives; best use of hospital capacity; effective clinical pathways; specialist services and networks; sustainable services at Weston General Hospital, and we are actively involved in 3 of the spotlight projects – we will ensure our directorate plans are aligned to STP timescales and objectives in these areas. For example:
Link to Sustainability & Transformation Plan (STP)
Stroke pathway review
We are supporting the workstream clinical lead and have operational and clinical representation on the Stroke Pathway Review Board.
MSK programme
We are providing operational and clinical support to this spotlight project through our representation on the system T&O Steering Group that is leading this work, for example:
Workstream 1: MSK clinical pathways – we are supporting the Rheumatology pathway re-design work and the project to enhance the management of patients with MSK conditions in Primary Care. We will also champion the inclus