STATEMENT OF ACCOUNTS 2016-17 AND
ANNUAL GOVERNANCE STATEMENT
Contents Page
FOREWORD AND STATEMENT OF RESPONSIBILITIES ... 2
THE NARRATIVE REPORT ... ……10
MAIN FINANCIAL STATEMENTS Movement in Reserves Statement ... 21
Comprehensive Income and Expenditure Statement ... 22
Balance Sheet ... 23
Cash Flow Statement... 24
Notes to the Main Financial Statements ... 25
SUPPLEMENTARY FINANCIAL STATEMENTS Collection Fund Statement and Explanatory Notes ... 97
West Yorkshire Pension Fund and Explanatory Notes ... 100
GLOSSARY OF TERMS ... 128
ANNUAL GOVERNANCE STATEMENT ... 133
Introduction to the Council’s Statement of Accounts
The Council’s financial statements are set out in the pages following this foreword. They consist of the following:
1. The Narrative Report
The Director of Finance’s Report summarises the most significant items reported in the accounts and outlines the overall financial position of the Council for 2016-17. The money spent by the Council and where the money comes from is shown in a series of charts. There is a distinction between revenue spending (the annual cost of providing services) and capital expenditure, which has a long-term benefit for the citizens of the Bradford District.
2. Movement in Reserves Statement
This Statement shows the movement in the year on the different reserves held by the Council, analysed into “usable reserves”
(i.e. those that can be applied to fund expenditure) and other reserves.
3. Comprehensive Income and Expenditure Statement
The cost in the year of providing services in accordance with generally accepted accounting practices, rather than the amount to be funded in accordance with statute. The Council raises tax, and uses grants and other flows of income to cover the cost of services. The statutory financial result is shown in the Movement in Reserves Statement. This is different to the cost of services stated in accordance with generally accepted accounting practice, as shown in the Comprehensive Income and expenditure account.
4. Balance Sheet
The Balance Sheet shows the value at the Balance Sheet date of the assets and liabilities recognised by the Council.
5. Cash Flow Statement
The Cash Flow Statement shows the changes in cash and cash equivalents (short term investments of three months or less) of the Council during the reporting period.
6. Statement of Significant Accounting Policies
The Council’s accounts follow International Financial Reporting Standards (IFRS) since the 2010-11 financial year.
The accounting policies set out the specific principles, bases, conventions, rules and practices applied by the Council in preparing and presenting the financial statements. The accounting policies are based on interpretations and adaptations for the public sector set out in the CIPFA (Chartered Institute of Public Finance and Accountancy) Code of Practice on Local Authority Accounting in the United Kingdom (the Code).
7. Notes to the Main Financial Statements
The notes disclose information required by the Code and information that makes the accounts easier to understand. They show the specific accounting policies and estimates used and breakdowns of figures shown in the main Financial Statements.
8. Collection Fund Statement
The Collection Fund is an agent’s statement that reflects the statutory obligation for billing authorities to maintain a separate Collection Fund. The statement shows the transactions of the billing Authority (Bradford Council) in collecting Council Tax and non domestic rates and distributing it to major preceptors and the Government.
9. The Group Accounts
As the Council does not have any material interests in subsidiaries, associates and jointly controlled entities it is not required to produce a set of Group Accounts.
10. The Pension Fund Account
As the Council is the administering authority for the West Yorkshire Pension Fund, the activities of the fund are required to be reported alongside the Council’s main Financial Statements.
11. Glossary of Terms
In order to help readers, a Glossary of Terms widely used in relation to local authority finance and referred to within these accounts is included at the back of the document.
12. Annual Governance Statement
The Council is required to undertake an annual review of the effectiveness of its governance framework and system of internal control. The conclusions of this review are reported alongside the accounting statements.
Notes to the Main Financial Statements
Note No Note Page No.
Note 1 Statement of Significant Accounting Policies 25
Note 2 Prior Period Adjustments 37
Note 3 Accounting Standards not yet adopted, Critical Judgements and Assumptions and Estimation 39 Note 4 Adjustments between accounting basis and funding basis under Regulations 42
Note 5 Transfers to/from Earmarked Reserves 43
Note 6 Material Items of Income and Expense 45
Note 7 Post Balance Sheet Events 45
Note 8 Analysis of the Comprehensive Income and Expenditure 45
Note 9 Property, Plant and Equipment: Movement on Balances 46
Note 10 Valuations 48
Note 11 Capital Commitments and Obligations Under long Term Contracts 48
Note 12 Heritage Assets 49
Note 13 Investment Property 50
Note 14 Intangible Assets 51
Note 15 Construction Contracts 51
Note 16 Long Term Investment 51
Note 17 Long Term Debtors 52
Note 18 Current Assets and Current Liabilities 52
Note 19 Assets held for sale 53
Note 20 Provisions 54
Note 21 Unusable Reserves 56
Note 22 Cash Flow Statement 59
Note 23 Expenditure Funding Analysis 61
Note 24 Acquired and Discontinued Operations 66
Note 25 Trading Services 66
Note 26 Agency Services 66
Note 27 Road Charging Schemes 66
Note 28 Pooled Budgets Arrangements Under Section 31 of the Health Act 1999, and Section 75 of the Health Act 2006
67
Note 29 Termination Benefits 67
Note 30 Pension Schemes Accounted For As Defined Contribution Schemes 67
Note 31 Defined Benefit Pension Schemes 68
Note 32 Members’ Allowances 75
Note 33 Employees’ Remuneration 75
Note 34 Capital Charges and the Repayment of External Loans 79
Note 35 Leases 80
Note 36 Private Finance Initiative (PFI) 82
Note 37 Capital Expenditure and Financing 84
Note 38 Revenue Expenditure Funded From Capital Under Statute (REFCUS) 84
Note 39 Other Long Term Liabilities 84
Note 40 Deferred Income 85
Note 41 Related Party Transactions 85
Note 42 External Audit Costs 87
Note 43 Dedicated Schools Grant (DSG) 88
Note 44 Contingent Liabilities and Assets 89
Note 45 Grant Income 90
Note 46 Impairment Losses 90
Note 47 Financial Instruments 90
Note 48 Trust Funds and Custodial Money 96
City of Bradford Metropolitan District Council's Statement of Responsibilities The Council is required to:
Make arrangements for the proper administration of its financial affairs and to secure that one of its officers has the responsibility for the administration of those affairs. In this Council, that officer is the Strategic Director - Corporate Services.
Manage its affairs to secure economic, efficient and effective use of resources and safeguard its assets.
Approve the Statement of Accounts.
The Strategic Director - Corporate Services Responsibilities
The Strategic Director - Corporate Services is responsible for the preparation of the Council's Statement of Accounts in accordance with proper practices as set out in the CIPFA Code of Practice on Local Authority Accounting in the United Kingdom (the Code).
In preparing this Statement of Accounts, the Strategic Director - Corporate Services has:
Selected suitable accounting policies and applied them consistently.
Made judgements and estimates that were both reasonable and prudent.
Kept proper and up to date accounting records.
Taken reasonable steps for the prevention and detection of fraud and other irregularities.
Complied with the Code of Practice on Local Authority Accounting.
In addition he has issued:
A manual on the practices to be adopted in the preparation of the Council’s year end accounts.
Various corporate standards giving guidance on specific accounting issues.
The financial statements are subject to audit by the Council’s external auditors.
Certification of the Statement of Accounts
I certify that this statement of accounts presents a true and fair view of the financial position of the Council at 31 March 2017 and its income and expenditure for the year then ended. I authorise for issue the 2016-17 Statement of Accounts.
Signed:
Stuart McKinnon-Evans
Strategic Director - Corporate Services Date: 28 September 2017
Signed:
Cllr Michael Johnson
Chair of Governance and Audit Committee Date: 28 September 2017
To insert Audit Report
The Narrative Report
Financial Highlights Introduction
This Statement of Accounts provides comprehensive and detailed information about Bradford Council’s financial results for 2016-17. This section contains the headlines, comments on the financial results and performance against the internal budget plan, and summarises how the Council’s services measured up against non-financial targets for the year.
Two Financial Reporting Perspectives
The Council uses two complementary but distinct ways of reporting on financial performance, which reflect the legal and accounting environment:
The Statement of Accounts is prepared using generally accepted accounting principles, and this approach is used in presenting most of the information in the document.
The other reporting approach (which we call the “statutory” basis) reflects the principle that all revenue expenditure in the year has to be afforded within the money available to the Council from taxation and other sources of income.
The primary distinction between these two reporting approaches is that
the accounting approach includes transactions such as losses on disposals of assets, changes in the valuation of assets and liabilities, depreciation and costs for untaken leave by employees in the total income and expenditure for the year, whereas the statutory basis does not.
the accounting approach incorporates both usable reserves – which are internal funds available to support the Council’s revenue and capital operations – and so-called unusable reserves, which together represent the total
“taxpayer value” held in reserves. The statutory approach focuses on the usable reserves.
the statutory basis underpins the setting of the Council’s annual budget, and the internal financial management accountability and budgetary control system. It is also the basis for in-year financial reporting to the Council’s Executive and other Committees.
This section sets out the financial results from these two perspectives.
Headline Financial Results in Statement of Accounts Comprehensive Income and Expenditure Statement
Gross revenue spending on services was £1.194bn, £110m less than in 2015/16, with net expenditure on services at £397m, down £57m from 2015/16. In addition to the implementation of the Council’s budget reduction plan across all services, the main factors underlying these trends are:
A £88m reduction in gross expenditure on Children’s Services. £31m is due to higher reductions to the valuations of school buildings in 2015 compared to 2016. (A valuation is commissioned on all Council buildings and fluctuations in their value are shown in the Comprehensive Income and Expenditure account). £58m is because 37 schools have converted to academies which takes their expenditure outside the scope of the Council’s accounts.
A £13m reduction in gross expenditure in Corporate services, most of which is due to changes in the estimated values of the buildings used by the services.
The figure below shows the distribution of spending by service.
Sources of Income
Total income attributable to individual services was £797m, a reduction of £53m on the previous year, again, mainly reflecting academy conversions. In addition, £431m income not directly attributable to an individual service was received, down £6m on the year before, with Revenue Support Grant from Government contributing £23m of the reduction. Income from Council Tax and Business Rates (including the Top Up Grant) totalled £288m, £14m up on the previous year.
The overall financial result was adversely affected by two significant factors: first, the £127m loss to the Council’s balance sheet of assets on disposal, principally school buildings on conversion to academy; and secondly an increase in the pension liability of £129.7m.
Net Financial Result
The resulting net deficit on the income and expenditure account is £249.9m, compared to £25.6m in 2015/16.
Service Performance
This section summarises impact of services financed by the expenditure, with focus on performance against the indicators of success the Council chose to measure itself against. For more detail, see the 2016/17 Finance and Performance Outturn Report presented to the Council’s Executive of July 11 2017.
As mentioned previously, the Council Plan helps provide the framework for performance monitoring and reporting within the organisation and identifies 49 headline indicators to measure the Council’s performance and productivity. This section provides additional detail on performance against those indicators for the year up to March 2017 with additional performance and activity data included in the Departmental commentaries in Section 3 of this report.
Depending on their data source, indicators can be reported monthly, quarterly, half yearly or annually. In some cases where validation is required the information may be for a historic period particularly information related to regional and national comparators and performance reports need to be viewed in the context of the current resource climate and looking ahead, future performance may be at risk from a range of adverse factors that vary from service to service
Of the 43 indicators that have targets, 22 are on target, 6 are within acceptable variance and 15 are below target.
Better Health, Better Lives
The Better Health Better Lives Outcome includes all services provided by Department of Health and Well Being, Children’s Social Care and Sports and Leisure Services. Health and Well Being predominantly use the Adult Social Care Outcomes Framework (ASCOF) and the Public Health Outcomes Framework (PHOF) to help set priorities for care and support, measure progress and strengthen transparency and accountability.
Locally, these frameworks provide us with robust information, enabling us to monitor the success of local interventions in improving outcomes, and to identify our priorities for making improvements. They are a useful resource for our Health and Wellbeing Board which can use the information to inform strategic planning and a leadership role for local commissioning and is currently being used a crucial evidence for our new Home First Vision for Health and Well Being
Between 2015/16 and 2016/17 Bradford’s Adult Social Care performance has shown an improved direction of travel in a number of areas including;
proportion of adults with a mental health disability in paid employment has improved from 6.1% in 15/16 to 8% in 16/17, improving our regional ranking of 11 of 15.
73% of people receiving Adult Social Care Services say that they feel safe which is top 5 in the Region and 25th best from 152 councils with social services responsibilities.
Our Social Care related Quality of Life score encompasses multiple ASCOF domains from questions in our Annual Adult Social Care Survey, and at 19.5 is one of the highest in the Region and 28th highest from 152 councils.
Long-term support needs for older people met by admission to residential and nursing care homes - The best performance in Y&H and integral to the joint LA/NHS Better Care Fund
Overall delayed transfers of care from hospital (3.4 in 15/16 down further to 3.0 in 16/17) and although performance worsened on delayed discharges directly related to social care (from 0.2 in 15/16 to 0.6 in 16/17) this still continues to be one of the best performers both regionally and nationally i.e overall delayed discharges were improved
performance and those related to social care were reduced performance
Proportion of people who use services who feel safe has stabilised at 73% for the two year period which is currently 5th best in region and 24th out of 125 councils in national rankings
Proportion of adults with a Learning Disability who live independently is now at 89% from 86.3% which is one of the best performers in the region
However, there are also a number of areas of under performance and where performance on the previous year is down. These include;
Proportion of people who use the service who have control over their daily life (reduce from 79.2%, 6th in Y&H rankings to 75.1% in 16/17)
proportion of people using services who have as much social contact as they would like was 51% in 15/16 which was the 2nd best at a Regional level and 17th best nationally, but reduced slightly to 50.3% in 16/17
Proportion of adults using social care receiving Direct Payments, has reduced from 17.5% to 16.7% and remains comparatively poor to regional and national comparators
The effectiveness of re-ablement services has dropped down from 88.2% to 87.8%
Proportion of service users who can access information and advice services a shown a very slight reduction and is down from 70.8% in 15/16 to 70% in 16/17 which is still low in comparable rankings.
In Children’s Specialist Services performance in Child Protection provision all indicators are showing green or amber in RAG ratings. The percentage of Child Protection reviews carried out on time is consistently achieving the 99% target and is above both regional and national comparators of 92% and 94% respectively, as are indicators relating to Child Protection Conferences being held within targeted timescales (94% in Bradford compared to regional 75% and national 79%) and the percentage of Child Protection Plans lasting two years or more at the end of the year which are both at green.
A significant area of improvement has been the percentage of Child Protection cases which were visited every four weeks which has increased from 89% against a target of 95% in 15/16 to 95.11% and is now above the 95% target.
Other areas of social care services where performance is good include participation of Looked After Children (LAC) in their reviews (96% achieved against the 91% target) and the percentage of care leavers in Employment, Education and Training (currently 83.3% against a target of 81% for 19-21 year olds and 92% against target of 90% for 16-18 year olds).
Despite showing improvement on previous year’s performance an area of concern in Specialist Services continues to be the health indicators for LAC. Only 87.5% against the target of 95% had an annual health assessment compared to regional 92%
and national 90% comparators and only 90% of LAC against an internal target of 95% had their teeth checked by a dentist although this is still above regional and national comparators.
Additionally LAC visits carried out within agreed timescales (86% against 95% target) and the percentage of Personal Education Plans completed for LAC, which has varied in the year against the challenging 98% target, continue to be raised as
concerns at monthly performance meetings and in some cases are showing month on month improvements although still not achieving target.
Targets in the Council Plan in Public Health relate to successful completions of programmes for both drug and alcohol misuse with the aim of bringing them in line with National averages. Of the three performance indicators for these programmes, two are currently red and one is green.
the proportion of people in drug treatment programmes for opiate substances who successfully completed treatment and did not re-present for support within 6 months, was 4.5% which is below the national average of 6.7%.
the proportion of all people in alcohol treatment programmes who successfully completed treatment and did not re- present within 6 months was 36.6% which is slightly below the national average of 38%.
the proportion of people in drug treatment programmes for non-opiate substances who successfully completed treatment and did not re-present for support within 6 months was 39.8% which is above the national average of 37.2%
Great Start, Good Schools
The Council Plan indicators in the priority Great Start Good Schools are primarily annual indicators related to the take up of Early Education across ages 2-4 year old and Early Years development.
The Council Plan targets are to increase the annual average of 2 year old children taking up Early Education in Bradford from 65% to the England aspirational target of 80%, 3 year old children from 90% to the England average of 93% and 4 year old children from 97% to the England average of 99%. The most recent information show that both 2 year old (71%) and 3 year old take up (93%) have increased but take up for 4 year olds has dropped to 94% which is in line with national and regional trends.
In order to be assured of the quality of provision in the Early Years sector, another key target in this outcome relates to the percentage of Children’s Centres inspections which are rated good or outstanding. The target in the Council Plan is to ensure the percentage is higher than the Yorkshire and Humberside average of 70%. Bradford’s performance is currently at 69% which is unlikely to change in the immediate future, with no inspections currently taking place as Ofsted are revising the inspection framework.
Other indicators in this Outcome aim to ensure that the percentage of children achieving a good level of development in Early Years Foundation Stage is in line with the national average of 69% and performance improved from 62% in 2015 to 66% last year. Additionally the percentage of Year1 pupils working at the expected standards in phonics improved by 5% to 79% in 2016, which is up from 74% in 2015 bringing Bradford closer to the national average of 81%.
Better skills, more good jobs and a growing economy
In this outcome the number of new jobs created as a result of direct support from the Council is on track to meet the target of 155 by March 2018 with 118 being created by March 2017, the agreed timescales for processing of major planning applications is at 86% compared to the Council Plan target of 87% but is still above regional comparators, and the latest information has confirmed that the Gross Value Added is on target with that identified in the Council Plan of £9.5bn.
In total overall visitor numbers to Bradford Markets has dropped from 5.8m visitors in 2015/16 to 5.6m in 2016/17, below the Council Plan target of maintaining numbers at 5.8m. Since the beginning of the year both the Kirkgate and Keighley Markets have maintained footfall but Oastler Centre has seen a reduction in customers which can be attributed to the closure of the Morrisons supermarket at Westgate.
The total number of visits to museums is below that expected. This indicator is anticipated to be back on target when the launch/opening of Cliffe Castle Park following a major Lottery Fund project takes place in June with the consequent knock on effect on visitor numbers to Cliffe Castle museum, and the launch of two major exhibitions at Cartwright Hall along with the opening of the David Hockney exhibition in July 2017, take effect.
In terms of Housing, 184 homes have been delivered this year which is above the 2016/17 target and is therefore on track to deliver the overall target of having 750 additional affordable homes available by the end of 2017/18, as the Affordable Homes Programme will see delivery weighted to the end of the period. The number of private sector homes improved through Council intervention was 947 and therefore exceeded the 850 target in the Council Plan but the average length of stay in bed and breakfast is currently 11.8 nights which is currently above the target identified in the Council Plan of 9 and above the 2015/16 outturn figure of 9.4 nights.
Safe clean and active communities
In the Safe Clean and Active outcome the amount of kerbside recycling has increased in line with the Council Plan from 17,900 tonnes in 2015/16 to 20,200 tonnes in the current year, but the target to reduce the number of reported fly tipping incidents to below last years outturn of 8,574 has not been achieved with 9,030 incidents being reported in 2016/17. The overall percentage of missed bin collections is 0.15% which is above target of 0.13% but the trend is improving with the last quarter being reported as 0.12% and if continued will meet the Council Plan target.
The Council Plan includes targets related to people who agree that their local area is a place where people from different backgrounds can live harmoniously. When last reported in 2015/16, the figure was 62.6% which is 1.4% below the previous year and below the 65% target in the Council Plan which is the regional average. This will be re-measured in 2017/18 by the Police and Crime Commissioner survey and will be reported quarterly in the future.
A new indicator included in the Council Plan was to increase the number of people participating in community life/volunteering.
This is being measured using the Citizens Panel and the recent Place Survey. 59% of respondents said they took part in volunteering activities but this figure needs treating with some caution as there was some evidence that the question was not fully understood and the Citizens Panel may represent a cohort that may be more engaged in community activities. Further work is being undertaken to ensure a more accurate representation of the indicator going forward.
As part of the drive to move services to be delivered in and by communities, and to transfer Council Assets to be managed by community organisations, a target was set to complete 30 Community Asset Transfers (CAT) by March 2018. At 31 March 2017, 29 had already been completed with the service likely to complete as many again in 2017/18.
Well Run Council
In the well run Council theme, the target to achieve the agreed specific financial savings has been underachieved with £37.8m (83%) of the targeted savings of £45.6m being delivered although overall the budget underspent by £0.3m. Despite significant targeted management action being taken, sickness is still above the 9.76 days target in the Council Plan, with the average number of days lost per employee due to sickness absence in 2016/17 at 11.33 days which is also slightly above last years outturn of 11.29 days.
The Council Plan also includes a new indicator re increasing resident’s satisfaction with the Councils delivery of services by 10% by 2020. This was recently measured using the Citizens Panel and the recent Place Survey and at that time 39% of residents said they were satisfied which will now be used as a base line in determining performance for future reporting on this indicator.
The Council Plan also has specific targets regarding improving the collection rates for both Council Tax and Business Rates, 96% and 98% respectively. In 2016-17 Council Tax collection was 94% (0.2% down on 2015/16), but Business Rates collection increased in the current year to 97.1% compared to 96.9% in the previous year.
Balance Sheet Net Worth
The Council started the year with £202m in usable reserves and an unusable reserves deficit of £244m, yielding a net negative worth of £42m. While usable reserves close £11m down at £191m, the position on unusable reserves has deteriorated further to a deficit of £483m, resulting in the Council having a negative net worth of £292m.
The main movements that make up the decrease of £250m in the Council’s net worth were:
a £125.9m decrease in long term assets
a £10.8m increase in net current assets
a £134.8m increase in long term liabilities
Long terms assets stand at £1,023m. The long term liabilities of £1,354m are dominated by three items:
the pension liability of £830m. This long-term liability will be met by payment obligations estimated over more than twenty years (See below)
the £178m contractual liabilities for schools PFI contracts. Over time these will be matched by Government funding which is not shown on the face of the balance sheet, due to the accounting rules.
long-term borrowing from the Government’s Public Works Loan Board of £322m.
Pension Liabilities
The net Pension Fund deficit comprises the estimated cost of promises by the Council to pay future pension benefits to employees less the assets set aside to fund these promises. The assets set aside typically comprise equities, bonds, cash and property. Overall, the net Pension Fund deficit increased by £130m from £700m to £830m as at 31 March 2017.
This increase of £130m was caused by an increase to the pension liabilities, of £402m, less an increase in the value of assets set aside to fund them of £272m. The increase in liabilities mainly relates to a £386m change derived from the estimation model used by the actuary to value liabilities at 31 March 2017. The increase of £272m in the assets set aside to fund them comprises a rise in asset values of £282m and other reductions of £10m. This is a long-range estimate and liability, in which the actuary takes a 20 years plus perspective of financial market performance and of the life expectancy of pension recipients.
Capital Spending
Capital Spending in 2016-17
The Council spent £61.5m in the year (£70.6m in 2015-16), and received £0.5m in donated heritage assets.
The table shows total spend by department, including some of the major schemes Major Capital Schemes Expenditure 2016-17
Department and Schemes Main Schemes Total Spend
£000 £000
Health and Wellbeing 1,337
Children’ s Services 18,107
Primary Schools Expansion Programme 5,358
Capital Maintenance Grant 5,121
Schools direct revenue funding 2,277
Devolved Formula Capital 2,816
Place – Economy and Development Services 16,272
New Affordable Housing 5,859
Temporary Housing – Clergy House/Jermyn Court 1,487
Disabled Housing Facilities Grant 3,681
Leeds City Region Revolving Investment Fund 1,657
Place – Planning, Transport and Highways 14,608
Capital Highways Maintenance 4,887
Road Infrastructure works 1,155
Flood Funding 1,651
Place - Other 7,137
Replacement of Vehicles 2,003
Cliffe Castle 1,770
Corporate Services 4,039
Property Programme 3,432
Total 61,500
Where the money came from to pay for the spending on capital schemes in 2016-17
The Council can borrow to fund capital investment. It sets and observes a range of indicators covering the level of capital expenditure and the cost of financing it, to ensure borrowing is responsible and affordable. One such measure is the Council’s Capital Financing Requirement, which represents the amount of Council’s capital expenditure funded by internal or external borrowing. In 2016-17 it fell slightly from the level in 2015-16 of £665.655m to £653.419m. The Council’s medium term strategy is to reduce the cost of borrowing in line with the Council’s reduction in overall spend.
Other than borrowing, the Council receives capital grants towards some projects, reinvests its capital receipts, or uses revenue resources to fund capital spending.
In 2016-17 the capital spending of £61.5m was funded as follows:
£11.9m (20%) by borrowing generating capital financing charges which will form part of future revenue spending.
£38.8m (63%) from government and other grants.
£4.3m (7%) from revenue contributions and other revenue reserves.
£6.4m (10%) from capital receipts from the sale of land and buildings.
£0.1m (0%) from other Finance Leases.
Schools
In recent years, the value of Property, Plant and Equipment shown on the Balance Sheet has been volatile due to changes in convention about how to account for education assets and the ability of the Council to control the assets and influence future service potential.
Where the Council directly owns a school or where the School Governing body own the assets or have had rights to use the assets transferred to them, the school is recognised on the Balance Sheet. Community Schools are owned by the Council and are therefore recognised on the Balance Sheet.
Of the Council’s Voluntary Aided and Controlled schools, the majority are owned by the respective Diocese with no formal rights to use the assets passed to the School or Governing Bodies. The schools are owned by trusts run by religious organisations and provision is available by the extended goodwill of the trust. As a result these schools are not recognised on the Balance Sheet.
Where the ownership of a Trust/Foundation School lies with a charitable Trust, including Academies, the school is not recognised on the Council’s Balance Sheet.
There are seven Foundation schools where as the ownership lies with the School/Governing Body the school is recognised on the Council’s Balance sheet. The Council considers it exercises sufficient control over the school governing bodies to warrant recognition of any school where ownership is invested in the governing body.
In 2016-17 37 schools converted to Academies, 23 of which were Community Schools and as at 1 April 2016, on the Council’s Balance Sheet. Four Foundation Schools and two Voluntary Controlled Schools were included on the Council’s Balance Sheet as at 1 April 2016. The other eight schools (Voluntary Aided, Voluntary Controlled and Trust) were not on the Council’s Balance Sheet. In addition two Academy Schools constructed by the Council and on the Council’s Balance Sheet as at 1 April 2016 have during the year completed long term leases. The value of these disposals was £126.2m. The Council is not recompensed for any of these disposals. The table below categorises all Bradford schools and sets out the current accounting treatment.
Type of school 2015-16 2016-17 Accounting Treatment
Community 91 68 On Balance Sheet
Special Schools 6 6 On Balance Sheet
Foundation 13 9 2 Church of England Off Balance Sheet, 7 owned
by Governing Bodies On Balance Sheet
Voluntary Aided 29 24 Off Balance sheet
Voluntary Controlled 12 10 Off Balance sheet (with the exception of 3 VC schools the Council still holds the legal title)
Academies 35 72 Off Balance sheet
Trust 5 2 Off Balance sheet
TOTAL SCHOOLS 191 191
Nurseries 7 7 On Balance Sheet
For further information on how the Council decides which schools should be included on its Balance Sheet see the Critical Judgements in Applying Accounting Policies on page 39.
Significant Provisions at 31 March 2017
The provisions total £20.362m at 31 March 2017 (£22.726m at 31 March 2016) and are included in Note 20 on page 54. They are split on the Balance Sheet between short term, (up to one year from the Balance Sheet date), and long term.
The significant movements in provision balances in year were as follows:
a) The cost of planned future termination costs in 2017-18 and future years arising from the detailed saving proposals approved as part of the 2017-18 Budget has been assessed as £6.0m.
b) The provision to cover the risk of day to day insurance losses has been reduced by £0.5m to £7.4m.
c) The provision on personal property search fees is £0.1m.
d) After charging £2.3m to the Council’s provision for the outcome of successful appeals against the Valuation Office’s 2010 Business Rates Valuation list, a further £2.1m has been set aside for outstanding appeals. This leaves Bradford’s estimated share of lost Business Rates income as a result of appeals at 31 March 2017 at £5.8m.
Usable Reserves
Usable reserves total £191m at 31 March 2017, falling broadly into £166m reserves owned by the Council and £25m owned by community schools.
Council Reserves
The Council’s policy is to earmark its reserves to fund one-off or transitional activity while reducing its recurrent cost base, to hold some reserves unallocated to support future budgets, to allocate some reserves for capital expenditure, and to hold some reserves as contingency.
£98m of earmarked reserves are set aside for future revenue and capital commitments.
£14m of unallocated reserves available to support future budget decisions, a very small financial cushion in the context of the very significant fiscal challenge ahead.
The Council has a General Fund balance of £11m, which is an operational contingency representing less than 1% of gross revenue spending.
£43m revenue and capital grants are held pending being spent on their specified purposes.
A detailed analysis of all the Reserves held by the Council is set out in Note 5, Page 43.
School Reserves
The balances of £25.2m comprise £9.6m held by schools and £15.6m held centrally for school contingencies. Of the £15.6m for school contingencies, £5.9m has been used straight away to fund the 2017-18 budget and £5.1m relates to schools that have converted to academies where the authority is in the process of transferring final balances to the new academies.
Unusable Reserves
Unusable reserves represent positive or negative value owned by taxpayers. They cannot be used to support operational revenue and capital activity, and are typically related to long-term assets and liabilities in the balance sheet. They stood at
£483m deficit at the year end, and their key components are:
£160m revaluation reserve, which arises because of upward changes in the value of balance sheet assets. This value can only be realised if assets are disposed
£210m capital adjustment account, which reflects the timing differences between how assets are financed, and how they are charged for under accounting arrangements. This value will be released as those differences are eroded over the life of the individual assets.
The Pensions reserve of £830m deficit, which mirrors the Pension Fund liability described above. It alone causes the unusable reserves in total to be in deficit.
Taxation Council Tax
At 31 March 2017 the Council had collected 94.5% of the value of council tax bills for the year, (compared to 94.3% exactly at the same point last year).
After distributing in 2016-17 the opening surplus balance on the Council Tax Collection Fund, £3.1m, the Council Tax element of the Collection Fund ended the year £2.1m in credit. A surplus of £1.8m, Bradford’s 85% share, is reported in the accounting statements.
Bradford’s £1.8m surplus is just £0.2m less than the budgeted surplus that will be redistributed in 2017-18.
Business rates
As at 31 March 2017, the Council had collected 97.01%, compared to 96.9% at the same time last year.
Business Rates collected by Bradford Council are shared between itself, central government and the West Yorkshire Integrated Fire Authority. Any difference between what the Council forecast it would raise in Business Rates in 2016-17 (£128.5m) and what it has actually raised results in either a surplus or deficit on the Collection Fund.
A deficit of £11.9m was outturned, Bradford’s share being £5.8m. A reason for the deficit was the impact of appeals against rateable values. Successful appeals require the Council to refund business rates for 2016-17 and in many cases prior years.
This deficit on the Business Rates Collection Fund was fully forecast when the 2017-18 budget was set. As a result, the deficit has already been budgeted for and there will be no additional pressure in future years.
Financial Performance and Budgetary Control
This section of the report explains financial performance from the statutory reporting perspective, which reflects the internal budgetary control accountabilities. A more comprehensive assessment of departmental spending is contained in the 2016/17 Finance and Performance Outturn Report presented to the Council’s Executive of July 11 2017.
The Council underspent the approved net budget of £378m (£1.407bn gross expenditure), by £0.3m in line with previous forecasts. Despite the overall underspend, there are however a number of significant departmental budget variances.
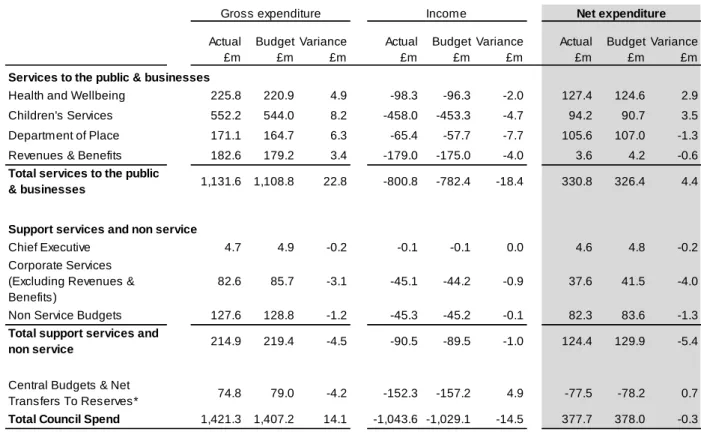
In the tables below, we show the planned and budgeted results from two perspectives.
Table 1a shows spending by Department, reflecting the Council’s internal management accountabilities. Budgets are allocated to Directors who are accountable for their departmental expenditure.
1a: Budgeted and Actual Expenditure and Income (Department)
*Includes £2.8m of deferred expenditure
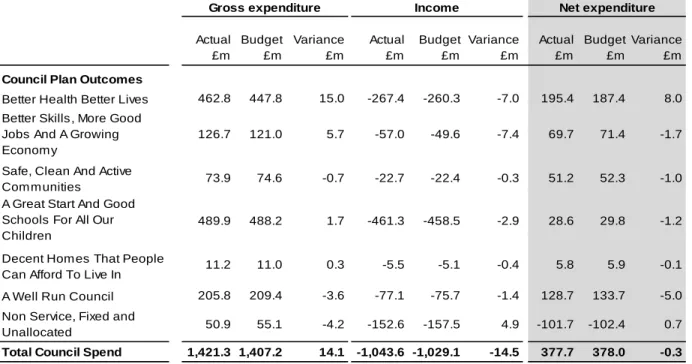
Table 1b shows spending by outcome to mirror the ambitions set out in the Council Plan. In spending their budgets, Directors undertake activities which help achieve outcomes. Typically a number of activities undertaken by different departments contribute to realising an outcome.
Actual
£m
Budget
£m
Variance
£m
Actual
£m
Budget
£m
Variance
£m
Actual
£m
Budget
£m
Variance
£m Services to the public & businesses
Health and Wellbeing 225.8 220.9 4.9 -98.3 -96.3 -2.0 127.4 124.6 2.9
Children's Services 552.2 544.0 8.2 -458.0 -453.3 -4.7 94.2 90.7 3.5
Department of Place 171.1 164.7 6.3 -65.4 -57.7 -7.7 105.6 107.0 -1.3
Revenues & Benefits 182.6 179.2 3.4 -179.0 -175.0 -4.0 3.6 4.2 -0.6
Total services to the public
& businesses 1,131.6 1,108.8 22.8 -800.8 -782.4 -18.4 330.8 326.4 4.4
Support services and non service
Chief Executive 4.7 4.9 -0.2 -0.1 -0.1 0.0 4.6 4.8 -0.2
Corporate Services (Excluding Revenues &
Benefits)
82.6 85.7 -3.1 -45.1 -44.2 -0.9 37.6 41.5 -4.0
Non Service Budgets 127.6 128.8 -1.2 -45.3 -45.2 -0.1 82.3 83.6 -1.3
Total support services and
non service 214.9 219.4 -4.5 -90.5 -89.5 -1.0 124.4 129.9 -5.4
Central Budgets & Net
Transfers To Reserves* 74.8 79.0 -4.2 -152.3 -157.2 4.9 -77.5 -78.2 0.7
Total Council Spend 1,421.3 1,407.2 14.1 -1,043.6 -1,029.1 -14.5 377.7 378.0 -0.3
Gross expenditure Income Net expenditure
Table 1b: Budgeted and Actual Expenditure and Income (Council Plan)
*Includes £2.8m of deferred expenditure
Service budgets and actuals include year end accounting adjustments for depreciation, impairment and pensions. They also include Facilities Management costs and budgets (utilities and repairs) which during the year are managed and controlled within Corporate Services. These affect Service’s budgets and actual spend but have nil impact on the final service variances.
Source: The Council’s ledger (SAP) as at 31 March 2017
The tables show that in aggregate the Council controlled spending within the overall net budget of £378m. However, there are significant variances from plan within that total.
Children’s Services overspent the £90.7m net expenditure budget (£544m Gross budget) by £3.5m.The overspend was largely attributable to;
o Increases in the overall numbers of Looked after Children and Children in Permanent arrangements impacting on the cost of Purchased Placements (£1.9m overspend) and Fees and Allowances (£1.3m overspend).
o The increases in the numbers of Looked After Children consequently resulted in not achieving the budget saving plan to reduce the number of Looked after Children causing a further £0.8m overspend.
o Increases in the numbers of Looked After Children also resulted in the underachievement of a £0.6m budget savings plan to reduce the remaining number of Looked after Children in typically more expensive external purchased placements by placing them in in-house care.
The overspend in Children’s Social Care services is underpinned by a 9% increase in children coming into care. This rise is 23% nationally. Benchmarking data shows that Bradford has 61 Looked after Children per 10,000 Children 0 to 17 years, compared with a national average of 65 and statistical neighbour average of 74 per 10,000 Children 0 to 17 years.
The Department of Health and Wellbeing (formerly Adult Services and Public Health) overspent the £124.6m net expenditure budget by £2.9m. The overspend was caused mainly by a £3.7m overspend within Adult Services comprising £3.9m on Purchased Care; a £1.2m underachievement of service user income, a £0.3m recurrent overspend on the BACES equipment service, £0.4m overspend on No Recourse to Public Funds, £0.3m on Deprivation of Liberty Safeguards (DOLS), offset by underspends of across the department.
The overspends in Adults and Children’s Social Care services linked to high demand outlined above were more than offset by underspends in other departments.
Actual
£m
Budget
£m
Variance
£m
Actual
£m
Budget
£m
Variance
£m
Actual
£m
Budget
£m
Variance
£m Council Plan Outcomes
Better Health Better Lives 462.8 447.8 15.0 -267.4 -260.3 -7.0 195.4 187.4 8.0 Better Skills, More Good
Jobs And A Growing Economy
126.7 121.0 5.7 -57.0 -49.6 -7.4 69.7 71.4 -1.7
Safe, Clean And Active
Communities 73.9 74.6 -0.7 -22.7 -22.4 -0.3 51.2 52.3 -1.0
A Great Start And Good Schools For All Our Children
489.9 488.2 1.7 -461.3 -458.5 -2.9 28.6 29.8 -1.2
Decent Homes That People
Can Afford To Live In 11.2 11.0 0.3 -5.5 -5.1 -0.4 5.8 5.9 -0.1
A Well Run Council 205.8 209.4 -3.6 -77.1 -75.7 -1.4 128.7 133.7 -5.0
Non Service, Fixed and
Unallocated 50.9 55.1 -4.2 -152.6 -157.5 4.9 -101.7 -102.4 0.7
Total Council Spend 1,421.3 1,407.2 14.1 -1,043.6 -1,029.1 -14.5 377.7 378.0 -0.3
Gross expenditure Income Net expenditure
Taking the outcome perspective (Table 1b), there was significant financial overshoot of £8m on Better Health Better Lives – and this reflect the nationally recognised concern of how to contain the costs of social care across all age groups. Conversely, the Well Run Council outcomes were associated with an underspend of £5m, with smaller underspends showing against the other outcome lines.
Financial Health of the Council
From the perspective of budgetary control, the Council performed well during 2016/17, delivering a small underspend against its approved plan. This was a good result against the backdrop of having delivered £173m savings between when austerity began in 2010 and the start of the year. Within that result, there were signals that it is difficult to contain the costs of social care for people of all ages, with the story of rising demand driven by demographic changes against constantly declining resources being true not only for Bradford by most Councils across England. The Council’s strong track record in delivering savings is a source of confidence, but the task remains of reconciling the expectation of citizens and clients, the requirement of the statutory framework we work in, and the available resources.
Overall the balance sheet weakened, mirroring a significant loss of assets, particularly as schools convert to academies, and the further increase in the pension liability. In fact, the pension liability is the dominant factor in the balance sheet in aggregate, but it should be seen in the context of a 20 years plus outlook. While cash and cash equivalents fell from £74m to £57m, the Council’s working capital remains acceptable. Long-term borrowing increased to £322m (reflecting the first new loans taken out by the Council in December 2016, though interest rates on new loans are historically low, and the financing costs remain in tune with its Medium Term Financial Strategy.
2017/18 and Beyond
The Council’s four year plan is underpinned by a financial plan that requires continuing reductions in the real cost of services, reflecting the decline and likely eventual disappearance of central Government Revenue Support Grant by 2020/21. This financial plan requires stringent and consistent cost control, which in the first half of 2017/18 continues to prove particularly challenging in respect of reducing the demand for and cost of social care for people of all ages. Alongside cost control, the Council’s long-term financial health will depend on the buoyancy of the Council Tax and Business Rate yields. Our strategic priorities of improving transport connectivity and raising educational achievement, which underpin many of the Council’s desired outcomes, are key factors in creating more and better jobs. They are also pivotal to the longer term prosperity of the Council.
Our capacity to pursue these growth and prosperity goals is, in turn, dependant on our ability to manage the costs of social care. More generally, economic fortunes will be affected by Brexit, with direct and indirect impact on our tax bases and demand for services. The future of social care – how it should be financed and organised, and how it works alongside health care – must now be a burning concern for central government, with consequences for local government’s financial prospects. The outcome of these factors in the Council’s financial environment are unpredictable so in the short to medium term the primary financial challenges remain cost control, income growth where practicable, and prudent reserves management.
Movement in Reserves Statement
This Statement shows the movement in the year on the different reserves held by the Council, analysed into “usable reserves”
(i.e. those that are real cash) and other non cash reserves. The closing 31 March 2017 General Fund Balance of £36.020m comprises £10.803m (£10.803m in 2015-16) balances generally available to the Council and £25.217m (£33.803m in 2015-16) cash balances held on behalf of schools under the Local Management Scheme.
The deficit on the Provision of Services line of £150.476m (deficit of £85.336m in 2015-16) within the Income and Expenditure account is reversed out of usable reserves into unusable reserves. This is because by statute many of the accounting transactions making up the deficit cannot be charged against the General Fund Account. Unusable reserves have reduced by
£238.921m (reduction of £9.922m in 2015-16).
General Fund Balance
Earmarked General
Fund Reserves
Capital Receipts Reserve
Capital Grants Unapplied
Total Usable Reserves
Total Unusable Reserves
Total Council Reserves
Note 4 Note 4 Note 4 Note 4 Note 4 &
Balance Sheet
Note 21 &
Balance Sheet
Note 21 &
Balance Sheet
a b c D e f G
(a+b+c+d) (e+f)
£000 £000 £000 £000 £000 £000 £000
Balance at 31 March 2015 i a+h
49,159 134,993 1,770 32,077 217,999 -234,520 -16,521 Movement in reserves during 2015-16
Surplus/ (deficit) on provision of services (page 22)
j
-85,336 0 0 0 -85,336 0 -85,336
Other Comprehensive Income and Expenditure (page 22)
k
0 0 0 0 0 59,703 59,703
Total Comprehensive Income and Expenditure (page 22)
l J+k
-85,336 0 0 0 -85,336 59,703 -25,633
Adjustments between accounting basis
& funding basis under regulations (note 4)
m
68,968 0 3,078 -2,421 69,625 -69,625 0
Net Increase/Decrease (-)before transfers to Earmarked Reserves
n I+m
-16,368 0 3,078 -2,421 -15,711 -9,922 -25,633 Transfers to/from Earmarked Reserves
(Note 5, p43)
o
11,815 -11,815 0 0 0 0 0
Increase/Decrease(-) in 2015-16
p n+o
-4,553 -11,815 3,078 -2,421 -15,711 -9,922 -25,633
Balance at 31 March 2016 q i+p
44,606 123,178 4,848 29,656 202,288 -244,442 -42,154 Movement in reserves during 2016-17
Surplus/ (deficit) on provision of services (page 22)
j
-150,476 -150,476 -150,476
Other Comprehensive Income and Expenditure (page 22)
k
0 -99,416 -99,416
Total Comprehensive Income and Expenditure (page 22)
l J+k
-150,476 -150,476 -99,416 -249,892
Adjustments between accounting basis
& funding basis under regulations (note 4)
m
135,734 -1,182 4,953 139,505 -139,505 0
Net Increase/Decrease (-)before transfers to Earmarked Reserves
n I+m
-14,742 -1,182 4,953 -10,971 -238,921 -249,892 Transfers to/from Earmarked Reserves
(Note 5, p43)
o
6,156 -6,156 0 0 0 0 0
Increase/Decrease(-) in 2016-17
p n+o
-8,586 -6,156 -1,182 4,953 -10,971 -238,921 -249,892 Balance at 31 March 2017 q i+p
36,020 117,022 3,666 34,609 191,317 -483,363 -292,046
Comprehensive Income and Expenditure Statement
This statement shows the accounting cost during the year of providing services in accordance with generally accepted accounting practices, rather than the amount to be funded from taxation. Authorities raise taxation to cover expenditure in accordance with regulations; this may be different from the accounting cost. The taxation position is shown in the Movement in Reserves Statement.
2015-16 2015-16 2015-16 2016-17 2016-17 2016-17
Gross Expenditure
Gross Income
Net Expenditure
Gross Expenditure
Gross Income
Net Expenditure Restated Restated Restated
£000 £000 £000 £000 £000 £000
223,030 -96,824 126,206 Health and Wellbeing 223,540 -96,924 126,616
633,553 -511,504 122,049 Children’s Services 545,347 -454,654 90,693
158,744 -49,600 109,144 Department of Place 160,439 -55,252 105,187
188,133 -182,379 5,754 Revenues & Benefits 182,561 -178,760 3,801
5,074 -121 4,953 Chief Executive 4,715 -100 4,615
69,351 -8,189 61,162
Corporate Services (Excluding
Revenues and Benefits) 56,536 -9,669 46,867
2,864 -1,436 1,428 Non Service Budgets -2,692 -1,821 -4,513
23,916 135 24,051
Central Budgets & Net Transfers
to Reserves 23,981 135 24,116
1,304,665 -849,918 454,747 Cost of services 1,194,427 -797,045 397,382 6,514
Other Operating Expenditure
(Note 8a) 128,627
60,955
Financing and Investment income
and expenditure (Note 8b ) 55,060
-436,880
Taxation and non-specific grant
income (Note 8c) -430,593
85,336
Surplus (-) /Deficit on Provision of Services
150,476 8,743
Surplus (-)/Deficit on revaluation of
non current assets -4,580
-68,446
Re-measurements of the net
defined benefit liability 103,996
-59,703
Other Comprehensive Income
and Expenditure 99,416
25,633
Total Comprehensive Income
and Expenditure 249,892
.
Balance Sheet
The Balance Sheet shows the value as at the Balance Sheet date of the assets and liabilities recognised by the Council. The net assets of the Council (assets less liabilities) are matched by the reserves held by the Council. Reserves are reported in two categories. The first category of reserves is usable reserves, which represent real cash available to the Council to provide services. The Council must maintain a prudent level of these reserves for unexpected events. The second category of reserves does not represent real cash. It includes reserves that hold unrealised gains or losses (for example the Revaluation Reserve) where amounts would only become available to provide services if the assets are sold; and reserves that hold timing differences shown in the Movement in Reserves Statement line “Adjustments between accounting basis and funding basis under regulations”.
31 March 2016 31 March 2017
Notes
£000 £000
1,063,943 Property, Plant and Equipment 935,181 Note 9
36,261 Heritage Assets 36,867 Note 12
45,734 Investment Property 48,604 Note 13
1,460 Intangible assets 785 Note 14
1 Long term investment 1 Note 16
1,433 Long term debtors 1,484 Note 17
1,148,832 Long Term Assets 1,022,922
7,238 Short Term Investments 21,025 Note 18
652 Assets Held for sale 491 Note 19
2,237 Inventories 1,909 Note 18
77,070 Short Term Debtors 74,560 Note 18
74,038 Cash and Cash Equivalents 56,253 Note 18
161,235 Current assets 154,238
-3,523 Cash and Cash Equivalents (Overdraft) -7,042 Note 18
-29,486 Short term borrowing -13,623 Note 18
-91,032 Short Term Creditors -85,123 Note 18
-9,383 Provisions -9,791 Note 20
-133,424 Current Liabilities -115,579
-13,343 Provisions -10,571 Note 20
-306,127 Long term borrowing -322,409 Note 47c
-891,280 Other Long Term liabilities -1,012,286 Note 39 -8,047 Capital Grants Receipts in Advance -8,361 Note 45 -1,218,797 Long Term Liabilities -1,353,627
-42,154 Net Liabilities -292,046
-202,288 Usable Reserves -191,317 Note 5
244,442 Unusable Reserves 483,363 Note 21
42,154 Total Reserves 292,046
The total assets less liabilities of the Council are financed by movements in reserves. There was a reduction in total reserves of
£249.892m from a deficit of £42.154m at 31 March 2016 to a deficit of £292.046m at 31 March 2017.
Cash Flow Statement
The Cash Flow Statement shows the changes in cash and cash equivalents of the Council during the reporting year. The statement shows how the Council generates and uses cash and cash equivalents by classifying cash flows as operating, investing and financing activities. The amount of net cash flows arising from operating activities is a key indicator of the extent to which the operations of the Council are funded by way of taxation and grant income or from the recipients of services provided by the Council i.e. fees and charges. Investing activities represent the extent to which cash outflows have been made for resources which are intended to contribute to the Council’s future service delivery. Cash flows arising from financing activities are useful in predicting claims on future cash flows by providers of capital (i.e. borrowing) to the Council.
2015-16 2016-17
£000 £000
85,336
Net (surplus) or deficit on the provision of services (Comprehensive
Income and Expenditure Statement page 22) 150,476
-178,358
Adjustments to net surplus or deficit on the provision of services for
non-cash movements (Note 22 d) -232,423
44,640
Adjustments for items included in the net surplus or deficit on the provision of services that are investing and financing activities (Note
22 d) 43,970
35,537 Interest and dividends received and paid ((Note 22 d) 37,186
-12,845 Net cash flows from Operating Activities (Note 22 a) -791
-30,701 Investing Activities (Note 22 b) 19,900
67,988 Financing Activities (Note 22 c) 2,195
24,442 Net (increase) or decrease in cash and cash equivalents 21,304
Balance Sheet Movement
94,957
Cash and cash equivalents at the beginning of the reporting period (Balance Sheet page 23: Current Assets Cash and Cash
equivalents less Current Liabilities Cash and Cash Equivalents) 70,515
70,515
Cash and cash equivalents at the end of the reporting period (Note 18, page 52) (Balance Sheet page 23: Current Assets Cash and Cash equivalents less Current Liabilities Cash and Cash
Equivalents) 49,211
24,442 Net (increase) or decrease in cash and cash equivalents 21,304
Statement of Significant Accounting Policies Note 1.
The following notes are provided to give more detailed analysis in support of the main financial statements. They include all the information authorities are required to disclose except that for this Council the following disclosure requirements are not relevant for the 2016-17 Statement of Accounts:
Schemes under the Transport Act 2000 (road user charging and workplace parking levy schemes): The Council has not entered into any such activities.
Business Improvement District (BID) schemes: No such schemes have been established by the Council.
Changes in depreciation method: There has been no change to the way fixed assets are depreciated.
Changes in the basis of amortisation of intangibles: There has been no change to the way in which intangible assets are amortised.
Analysis of net assets used by General Fund services, Housing Revenue Account (HRA) Services and trading services:
The Council has no HRA and none of its trading services uses a material level of the overall net assets.
The accounts have been prepared in accordance with:
The Accounts and Audit Regulations 2015.
The Code of Practice on Local Authority Accounting in the United Kingdom 2016-17 issued by the Chartered Institute of Public Finance and Accountancy (CIPFA).
International Financial Reporting Standards (IFRS) issued by the International Accounting Standards Board as adopted and adapted by the Code.
Fundamental Accounting Principles
Where specific legislative requirements and accounting principles conflict, legislative requirements are applied.
Consistent accounting policies have been applied both within the year and between years unless otherwise identified.
The accounts have been prepared on a going concern basis and reflect the reality or substance of the transactions and activities underlying them, rather than their formal character.
The financial statements give a true and fair presentation of the financial position, financial performance and cash flows of the Council.
Balances and transactions are recognised gross rather than netted off each other.
Comparative information is disclosed in respect of the previous period for all amounts reported in the current period’s financial statements.
The concept of materiality has been used such that insignificant items and fluctuations under an acceptable level of tolerance are permitted, provided in aggregate they would not affect the interpretation of the accounts.
Where estimation techniques are required to enable the accounting practices adopted to be applied, then the techniques which have been used are, in the Council’s view, appropriate and consistently applied. Where the effect of a change to an estimation technique is material, a description of the change and, if practicable, the effect on the results for the current period is disclosed separately.
i. Accruals of Income and Expenditure
Activity is accounted for in the year that it takes place, not simply when cash payments are made or received. In particular:
Revenue from the sale of goods is recognised when the Council transfers the significant risks and rewards of ownership to the purchaser and it is probable that economic benefits or service potential associated with the transaction will flow to the Council.
Revenue from the provision of services is recognised when the Council can measure reliably the percentage of completion of the transaction and it is probable that economic benefits or service potential associated with the transaction will flow to the Council.
Supplies are recorded as expenditure when they are consumed – where there is a gap between the date supplies are received and their consumption, they are carried as inventories on the Balance Sheet.
Expenses in relation to services received (including services provided by employees) are recorded as expenditure when the services are received rather than when payments are made.
Interest receivable on investments and payable on borrowings is accounted for respectively as income and expenditure on the basis of the effective interest rate for the relevant financial instrument rather than the cash flows fixed or determined by the contract.
Where revenue and expenditure have been recognised but cash has not been received or paid, a debtor or creditor for the relevant amount is recorded in the Balance Sheet.
There are a small number of exceptions to the accruals concept: