Objective of the study
Research hypothesis
The introduction of Eucalyptus tree species in Ethiopia
Coppicing ability of Eucalyptus species
To achieve more cutting blades per stubble for intended uses short rotation period with smaller stem diameter is recommended (Robert, 2005). The rotation period for Eucalyptus species is not uniformly standardized due to different products and environmental conditions.
Impact of Eucalyptus plantation on soil nutrients
These fast-growing, short-rotation tree plantations, such as Eucalyptus, use high amounts of nutrients from the soil compared to slow-growing species (Heilman and Norby, 1997). For example, in Australian eucalyptus plantations, soil density increased from 0.58 Mg.m-3 to 0.7 Mg.m-3 after clear-cutting and high-intensity burning.
Biomass production potential of Eucalyptus
Another study by Turner and Lambert (2000) in Brazil showed that soil organic carbon content was lower in Eucalyptus plantations compared to the adjacent native vegetation site. Some management practices such as clear felling and high intensity burning have also had significant impacts on soil quality (Pennington et al., 2004).
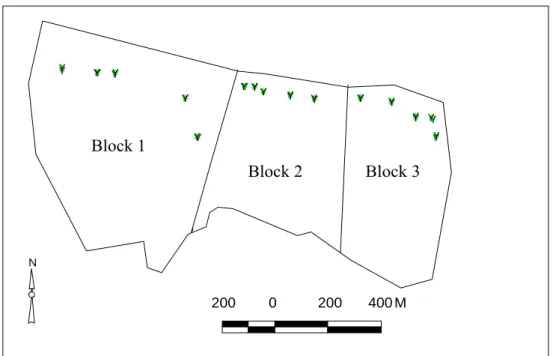
Study area description
Site selection and location of the study area
Agro-ecology of the study site
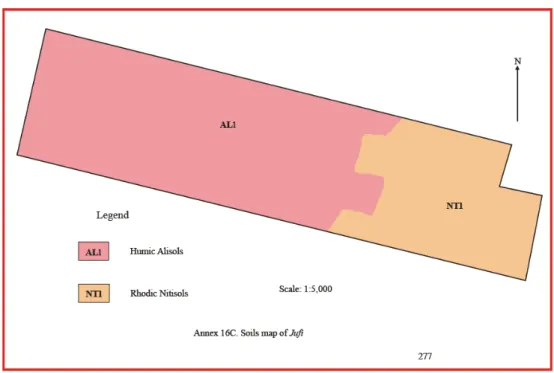
Major soil types in Jufi area
The entire area of Block 1 and most parts of Block 2 are dominated by Nitosols, while Block 3 is mainly dominated by Alisols and some parts have Nitisol soils.
The history of E. camaldulensis plantation establishment in Jufi site
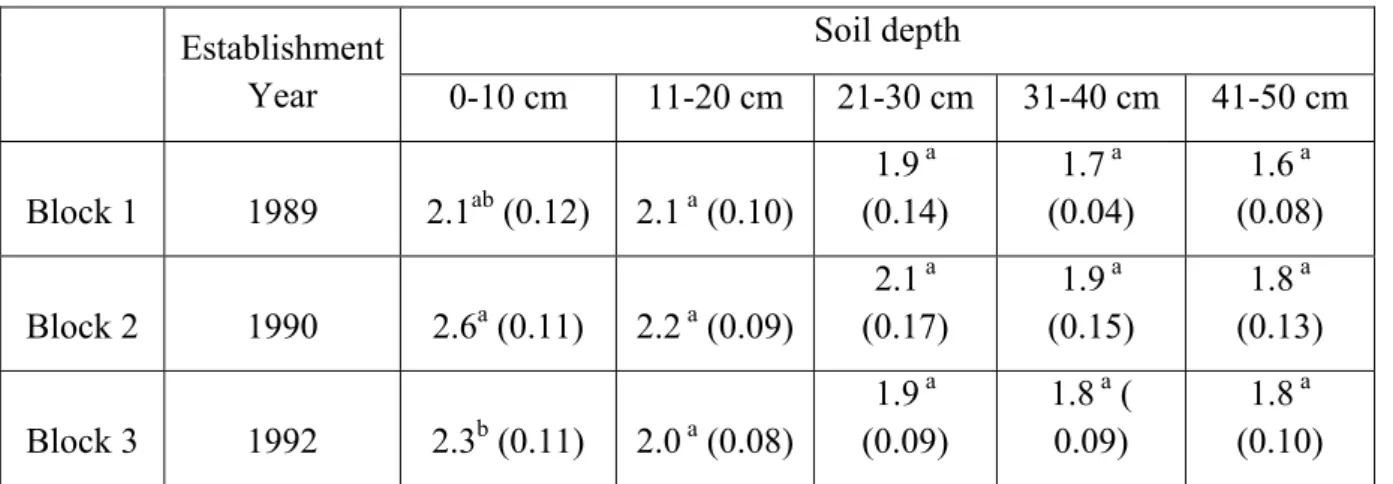
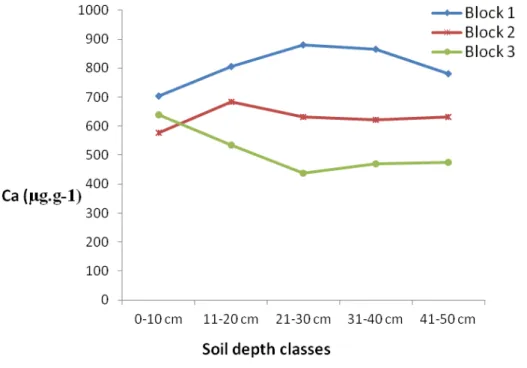
There were no observations of the statistically significant differences in soil pH (CaCl2) between different plantation blocks (Table 6). Similarly, there were no significant differences in the mean values of soil pH (CaCl2) along the soil depths of E. Soils in block 1 were more acidic than those in locks 2 and 3. Soil pH increased with increasing depth for all blocks .
This may be due to the high density of trees in lower DBH classes per hectare. This may be due to the presence of a higher number of trees in lower DBH classes in all blocks. The relative variation of phosphorus content in E. camaldulensis leaves between DBH classes may also be due to the age of the leaves.
The possible reason for the variation across DBH classes may be due to the age of the leaves. This may be mainly due to the large number of plants in the lower DBH classes.
Jufi E. camaldulensis plantation coppice regeneration inventory
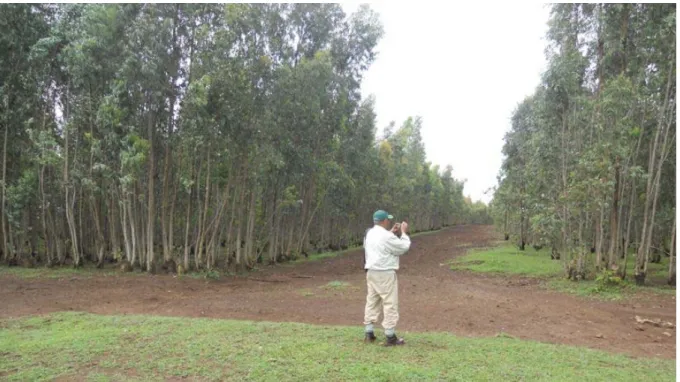
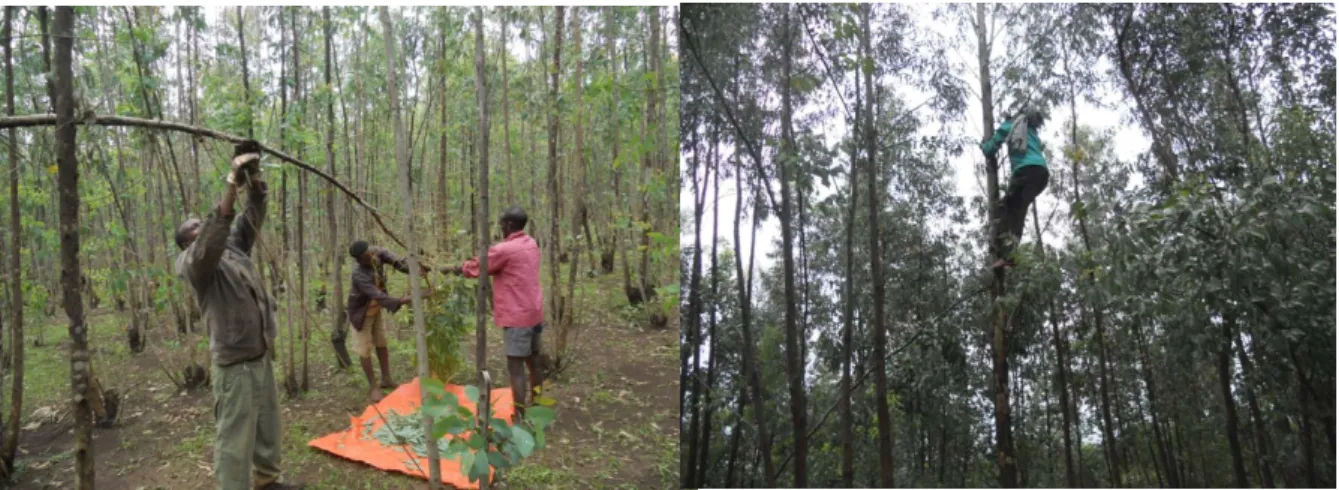
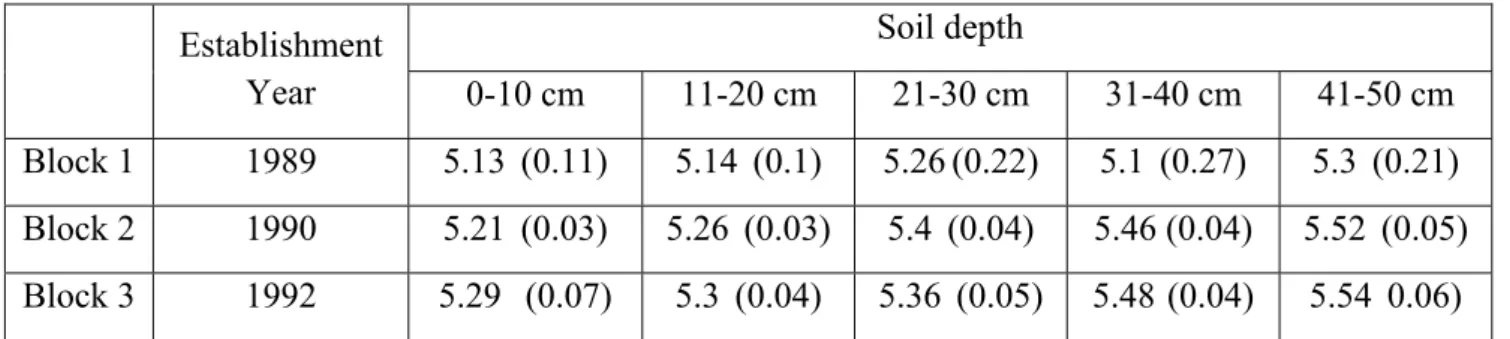
Leaf sample collection from the E. camaldulensis coppices
Then 100 g fresh samples were taken from the total weight and air dried to prevent mold spoilage. Subsamples of 15 g were taken from each air-dried sample and transported to Vienna for laboratory analysis.
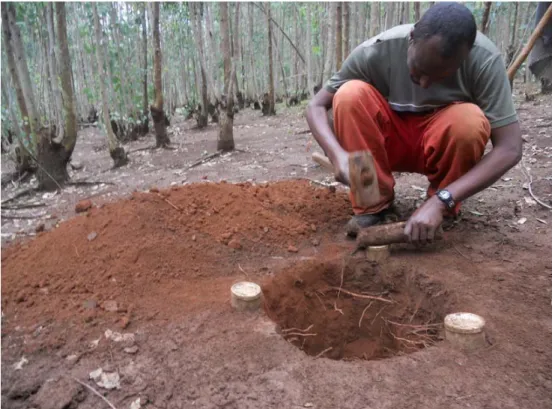
Soil sampling procedures
Soil samples were collected for each depth profile from three points (Fig. 6) and then hand mixed. From these composite samples, 300 g fresh sub-samples were taken and air-dried, of which 150 g sub-sample was packed and brought to Vienna for laboratory analysis.
Laboratory analysis procedures
- Sample pre-treatment
- Carbon and nitrogen content analysis
- Soil pH measurement
- Sample extraction and element analyses
- Calculations
Total P and S were extracted using aqua regia according to the Austrian standard procedure (ÖNORM L1085, 2009). Leaf samples were extracted in a mixture of HNO3 and HClO4 according to the Austrian standard procedure (ÖNORM L results indicated in appendix 5).
Data analysis
However, to compare the results with (Zerfu 2002), we only used Ca, K and Mg to calculate the CEC.
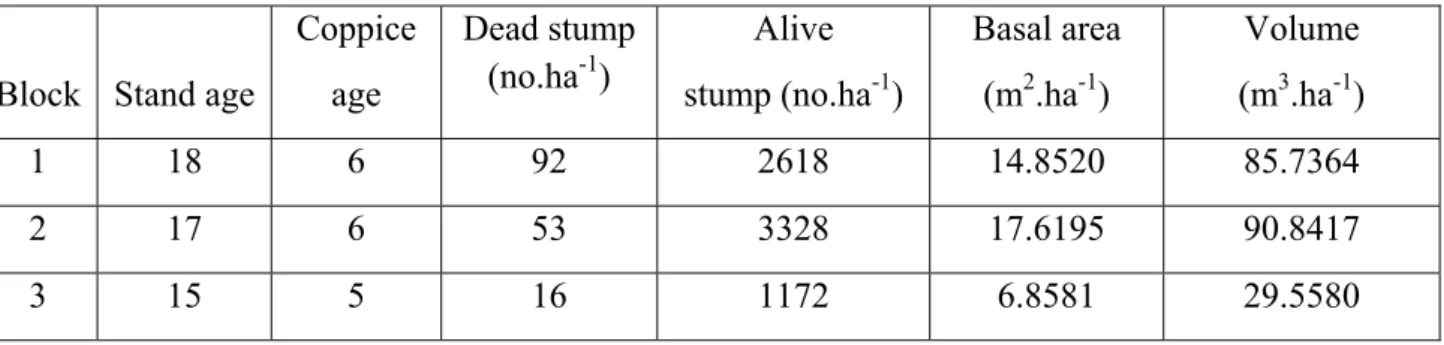
Plantation inventory
Soil organic carbon
Soil nitrogen
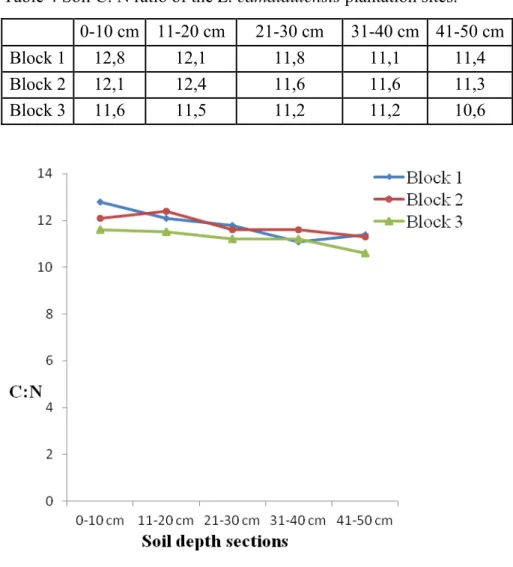
Soil C: N (carbon nitrogen ratio)
21 Avoiding the block separation and pooling along the soil depths, ANOVA showed significant differences in the C:N across all soil depth sections. Significantly higher C:N ratios were found in the upper soil portion and decreased smoothly with increasing soil depth (Fig 9).
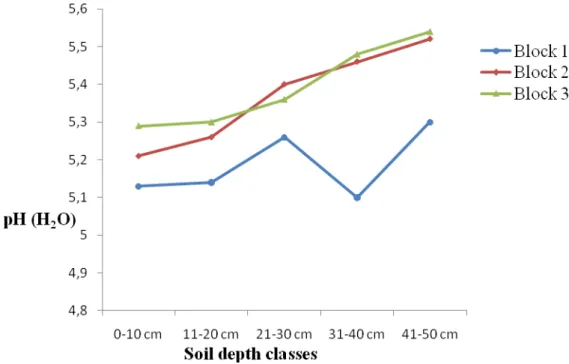
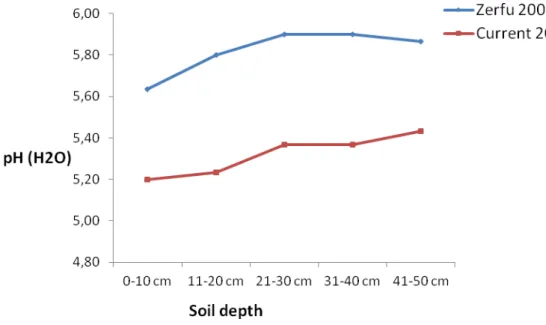
A remarkable observation is that with increasing soil depth the pH (H2O) increases, which also indicates the decreasing soil acidity with depth (Fig. 10). 23 while higher ones were observed in the lower soil sections, meaning that soil acidity decreased in the lower soil sections (Fig 11).
Exchangeable cations
- Calcium
- Potassium
- Magnesium
- Manganese
- Sodium
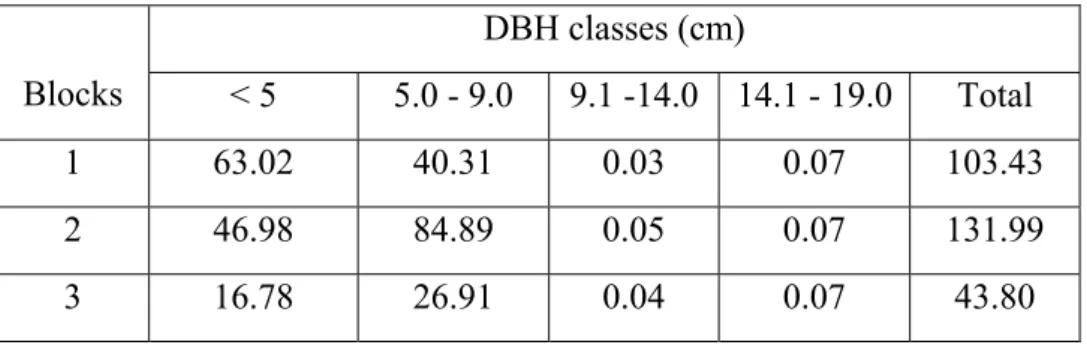
The highest K+ content was observed in block 2 for all soil depth sections except for the 0-10 cm soil depth where block 3 exceeds it once. The change in K+ content under block 1 in the soil depth mostly showed a regular rate of reduction while compared to the other blocks (Fig 13). Mn++ content decreased significantly as soil depth increased downward for all blocks (Table 8).
Irregular pattern of variation for the soil exchangeable Na+ was also observed between the soil depth sections for all blocks (Table 7 and Fig 16).
Cation exchangeable capacity
The higher the number of trees, the higher the leaf nitrogen content. camaldulensis leaf nitrogen content in trees varied with the DBH classes of the plants. In contrast to the nitrogen content, the phosphorus content of the leaves did not show a strong variation according to the DBH classes. As with the content of nitrogen and phosphorus, this decrease can also be due to the higher number of trees in lower DBH classes.
Based on the DBH classes, this study showed that higher contents of most nutrients were found in the leaves of the low DBH classes.
Nutrient contents in E. camaldulensis coppice leaves
Nitrogen
Almost two-thirds of this nitrogen (60.93%) in this block is contributed by the leaves of tree seedlings. Of the total content, 38.31% of nitrogen was stored in tree saplings smaller than 5 cm DBH. This indicates that leaf nitrogen content relatively decreased as the DBH of the hives increased (Table 11).
Phosphorus
Potassium
Sulfur
Calcium
Magnesium
Soil chemical properties under E. camaldulensis plantation site
- Soil organic carbon content
- Soil nitrogen content
- Soil C: N
- Soil pH (H 2 O) content
- Differences between soil pH in H 2 O and CaCl 2
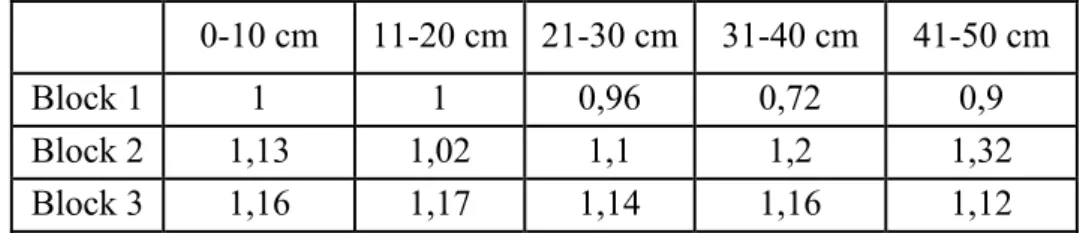
Bohra and Lodhiyal (2010) also showed that soil pH value decreased with increasing age of eucalyptus planting. The pH values (CaCl2) are lower than the pH values (H2O) under all plantation blocks and along the soil depth sections. Changes in soil pH values measured in CaCl2 and H2O suspensions showed steady state in blocks 2 and 3 and unstable variation under block 1 across soil layers (Table 13 and Fig 19).
The difference in resulting values of soil pH measured in CaCl2 and H2O suspension varied approximately above 1.0 and below 1.2 for block 2 and 3 and for block 1 varies above 0.6 and below 1.0 along the soil depth sections.
Soil Exchangeable cation
Calcium
Potassium
Magnesium
2008) observed 30% lower content of exchangeable Mg++ in soil under Eucalyptus plantation compared to pasture soils. 2010) described the reduced amount of exchangeable Mg++ under Eucalyptus plantation due to the negative balance between nutrient input and production exported through timber harvesting and reduced import from litter decomposition or weathering. This assessment was primarily conducted by comparing the results of the current study with that of Zerfu (2002). The difference between the current result and the one 10 years ago showed no difference for the 0-10 cm soil depth, although an increase in soil N content was observed for the rest of the soil depth classes, but not statistically significant (Fig. 22 ).
Note: The values indicate the difference between the results of the cation concentrations in the current study, subtracted from the results obtained by Zerfu (2002). Nuno and Manuel (1996) also reported that leaf nitrogen content of the leaves of the Eucalyptus species decreased from the top to the bottom of the canopy. Nuno and Manuel (1996) also reported that foliar phosphorus accumulation decreased from the top to the bottom of the canopy in leaves of the Eucalyptus species.
Cation exchangeable capacity
Change in soil properties after 10 years of E. camaldulensis coppice growth …
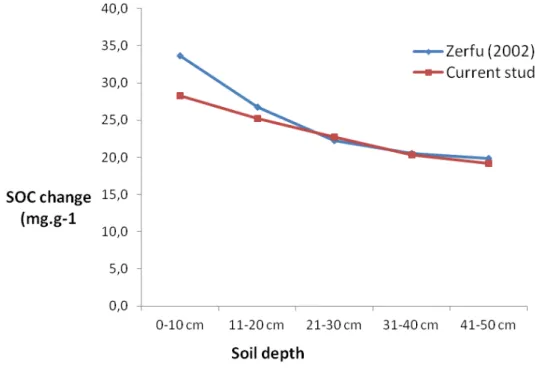
Change in soil organic carbon
Therefore, the hypothesis assumed that growing E. camaldulensis decreases the SOC is proven to be true as the results of this study show decreasing SOC content in most cases and no change in some cases. Reduced SOC was also observed by Zinn et al. 2002) in the sandy soils of the Cerrado region of Brazil, where variations were compared under different land uses. For example, in the 0-60 cm soil profile, total SOC loss was 9 and 11 Mg.ha-1 under Eucalyptus and Pinus, respectively.
In addition, Perez (2008) stated that monoculture fast-growing plantations will release retained SOC through felled, used and often burned trees, resulting in CO2 to the atmosphere.
Change in soil nitrogen
Change in soil C:N
The younger leaves can accumulate more phosphorus than old leaves. 2008) also found that phosphorus content was lower in mature leaves than young leaves for tree species of A. Nuno and Manuel (1996) also reported that the potassium content in foliage decreased from the top to the bottom of the canopy in leaves of the Eucalyptus species and the net reduction in nutrient content reflects relocation of nutrients from green leaves. 2010) reported, the rapid decrease in K+ with increasing age is attributed to leaching rather than residue decomposition. Therefore, it is important to assess the impact of expansion on soil nutritional status by considering rotational cycles and long-term effects of the species on soil characteristics.
Research results of the Dong men Eucalyptus Demonstration Project, Guangxi State Forest Farm Enterprise Guangxi, China.
Change in some soil exchangeable cations
Change in cation exchangeable capacity
In addition to the analysis of nutrient content, we also measured the volume of the beehive stand in order to estimate the above-ground wood productivity of the site. Also, the appropriate representativeness of the sampling may not be really sufficient, because only 30 soil pits were used to represent the 35 ha plantation, and the biomass assessment covered only leaf samples, i.e. for example, this study only covered sampling during three months of the year, which may not be truly representative in the case of leaf samples.
Temporal changes of biomass production, soil properties and soil flora in Eucalyptus globulus plantations in the central highlands of Ethiopia.
Nutrient content in E. camaldulensis leaves
Nitrogen
Trees in lower DBH classes have higher nitrogen content than trees with higher DBH classes in E. Trees in lower DBH classes have relatively younger leaves than trees with higher DBH classes. 2008) indicated that the nitrogen content was lower in mature leaves than in young ones for the same tree species of A.
Phosphorus
Potassium
Sulfur
Calcium
Magnesium
This study aimed to assess the changes in nutrient concentrations in the soil and leaf biomass after 10 years in an E. Until now, it is not clear what caused the increase in the level of N in the soil. Quadratic functions for biomass estimation in Eucalyptus camaldulensis energy plantations in the semi-arid region of northeastern Nigeria.
Ecological Impact Assessment of Eucalyptus Plantations in Comparison with Agricultural and Grazing Areas in the Highlands of Ethiopia. Alteration of soil chemical properties by eucalyptus cultivation in five regions of the Rio Doce Valley. Soil organic carbon affected by afforestation with Eucalyptus in the Cerrado region of Brazil.
Nutrients change in E. camaldulensis leaves after 10 years
Conclusion
In the current assessment, the SOC change was very strong in the upper soil horizons compared to the deeper ones. Soil pH was found to be lower than 10 years before at all soil depths under all E. It was also observed that BA and volume were strongly related to DBH and number of trees per acres.
This is primarily because growth is a function of nutrients extracted from the soil and absorbed from the atmosphere.
Recommendation
The outputs reported in this study are only limited to the site conditions and plantation characteristics as in the current study area Jufi. Ecological trends of understory species of Eucalyptus plantations in Bhar and Tarai region of Indian central Himalaya. Decomposition and nutrient release from litter in Eucalyptus grandis plantation on three different soils in Entre Rios, Argentina.
Biomass production of eucalyptus border plantations and their effects on highland vertisol crop productivity in Ethiopia. Quantification of nutrient content in the above-ground biomass of teak plantation in a tropical dry deciduous forest of Udaipur, India. Nutrient degradation and release from leaf litter of Eucalyptus globulus grown under different water and nutrient regimes.
Map of the Jufi plantation site and its surrounding
GPS readings (coordinates) of Jufi Plantation area
Geographical locations of 0-20 cm depth soil sample pits at Jufi plantation site….72
Soil N and C content (mg.g -1 ) in Jufi E. camaldulensis coppice plantation sites….74
Tree number per DBH classes under block 2
Tree number per DBH classes under block 3
Volume and basal area of E. camaldulensis in block 1
Volume and basal area of E. camaldulensis under block 3