Conversely, when cells such as pollen are exposed to air, the cell wall is involved in protection against desiccation (Katifori et al., 2010; Moore et al., 2008). In multicellular plant organisms, the cell wall is involved in cell cohesion in the plant tissue (Diet et al., 2006; Silhavy et al., 2010) and thereby influences cell division, cell growth and elongation.
THE PLANT CELL WALL OF HIGHER PLANTS – AN INTRODUCTION
The middle lamella
The primary cell wall
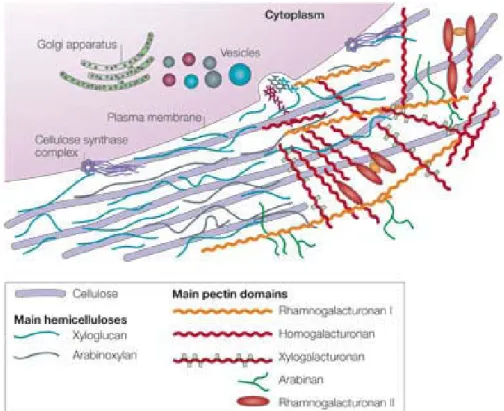
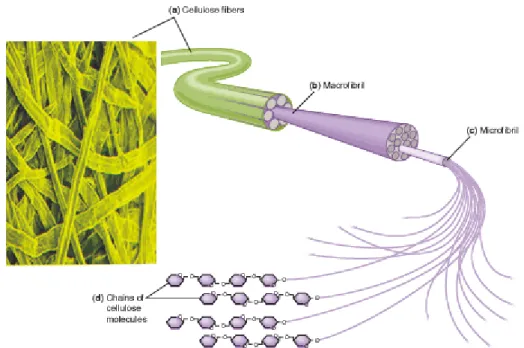
Cellulose fibers (thick violet stems) synthesized by the cellulose synthase complex are connected via hemicelluloses such as xyloglucan (blue stems) as well as pectic compounds such as rhamnogalacturonan-I (orange line) and rhamnogalacturonan-II (red oval), which are synthesized in the Golgi. apparatus.
The secondary cell wall
Cell wall compounds
- Cellulose and callose
- Lignin
- Plant Cell wall proteins (with a focus on AGPs)
- Hemicelluloses (with a focus on xyloglucans)
- Structures of xyloglucans
- The pattern of branching
- An overview about the different side chains
- Examples of the diversity arising from the combination of both branching pattern and variety of side
- Function of xyloglucans
- Role of the monosaccharides constituting xyloglucans
- Pectins (with a focus on rhamnogalacturonan II)
- Homogalacturonans (HG, HGA)
- Rhamnogalacturonan I (RG‐I)
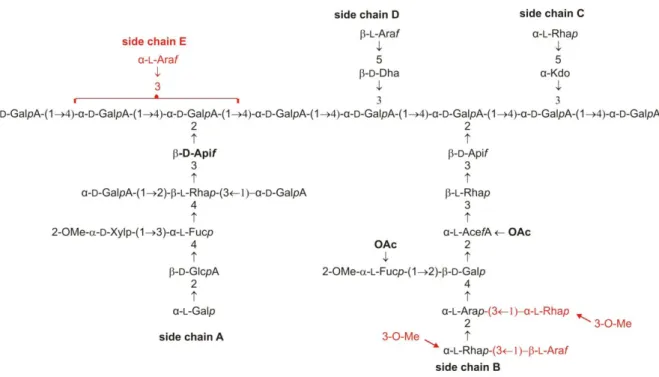
- Rhamnogalacturonan II (RG‐II)
Xyloglucans are the most abundant hemicellulose in the primary cell wall (Hoffman et al., 2005; Schädel et al., 2010). This type of side chain was initially described in argan tree (Argania spinosa, family Sapotaceae) (Hilz et al., 2007).
Enzymes involved in the biosynthesis and modification of fucosylated cell wall compounds
- Biosynthesis of GDP‐L‐fucose
- Genes involved in xyloglucan biosynthesis and modification/degradation
- Genes involved in xyloglucans biosynthesis
- Genes involved in xyloglucans modification/degradation
- Genes involved in arabinogalactan proteins biosynthesis
- Genes involved in rhamnogalacturonan‐II biosynthesis
AtXT1 could use G5 substrate (GGGGG) as acceptor to give GXGGG, in addition it showed activity towards cellopentaose ((β-D-Glc-[1→4])4-D-Glc) and cellohexaose acceptor substrates (Faik et al., 2002). Cell wall analysis of this line showed reduced L-fucose and D-galactose contents (Reiter et al., 1997).
Aims of this work
MATERIAL AND METHODS
Materials and chemicals used in this work
Kits used in this work
Organism used in this work
- Bacterial methods
- Bacteria strains and cultivation
- Photometric measurement of the optical density (OD 600 ) of bacteria cells
- Preparation of CaCl 2 competent E. coli Top10 cells for transformation by heat shock
- Preparation of electrocompetent A. tumefaciens UIA142 cells for transformation by electroporation
- Transformation of bacteria
- Cryostock preparation
The cells were centrifuged a second time and the pellet was resuspended in 6 ml of 0.1 M CaCl2 and mixed with sterile glycerol (87. This preculture was transferred to 500 ml of LB liquid medium supplemented with 25 µg/ml gentamycin and grown at 29 °C , until an OD600 of 0.5 – 1.0 was reached.
Plant methods
- Plant lines used in this study
- Surface sterilization of A. thaliana seeds, sowing on soil, and stratification
- Cultivation of plants on soil
- Surface sterilisation of A. thaliana seeds and cultivation of plants on solid MS medium
- Cultivation of plants as in vitro liquid culture
- Transformation of plants: transient expression of proteins by leaf infiltration of N. benthamiana
- Transformation of plants: stable transformation of A. thaliana by floral dipping
- Screening of A. thaliana overexpression lines
- Screening of A. thaliana knockout lines
- Crossing of A. thaliana
- Harvesting of A. thaliana seeds
The seeds were immediately washed with 1 mL of water during 3–4 washing steps and then planted in soil using a pipette. After floral immersion, seeds were collected and screened on a selection medium, MSS supplemented with 50 μg/mL kanamycin.
Molecular biologic methods
- DNA‐Vectors
- Vectors for subcloning
- Vectors for heterologous expression in plants
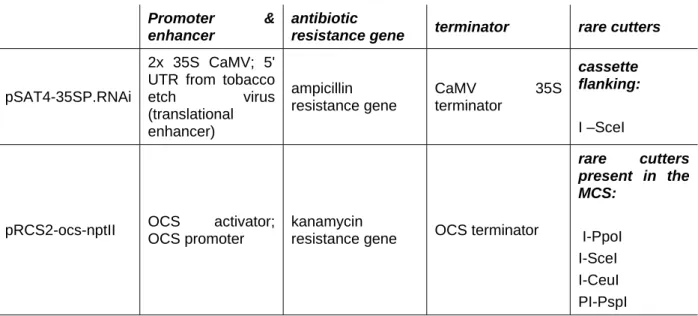
- Vectors for down regulation of genes by RNAi silencing
- Isolation and purification of nucleic acids
- Preparation of plant RNA
- Isolation of plant genomic DNA by quickprep method
- Preparation of bacterial plasmid DNA (miniprep)
- Purification of DNA fragments from solution (PCR mix, enzymatic reactions)
- Purification of DNA fragments from agarose gel
- DNA‐precipitation
- Photometric measurement of nucleic acids
- Synthesis and amplification of nucleic acids by PCR
- DNA‐primers for PCR
- Plant knockout screening by PCR
- Cloning PCR
- PCR screening of bacterial colonies (colony PCR screening)
- Overview of PCR settings
- cDNA synthesis by reverse transcription
- DNA sequencing
- Modification of DNA
- Overview about DNA‐modifying enzymes used for cloning
- Enzymatic digestion of DNA for cloning
- Dephosphorylation of vector DNA
- Cloning and Ligation
- Agarose gel electrophoresis of nucleic acids (AGE)
- General cloning strategy
This system contains two types of vectors: pSAT vectors that are used to make the RNAi expression cassette, which is then transferred to the T-DNA region of the expression vector pRCS2. This special enzyme was used for the excision of the expression cassette from the pSAT4-35SP.RNAi vector prior to transfer to the binary plant expression vector pRCS2-ocs-nptII. The sequence was reverified and the expression cassette was excised with the homing enzyme I-Scel and cloned into the T-DNA region of the binary plant expression vectors pRCS2-ocs-nptII.
Methods related to protein biochemistry
- Isolation of plant proteins for SDS‐PAGE and Western Blot
- Measurement of protein concentration
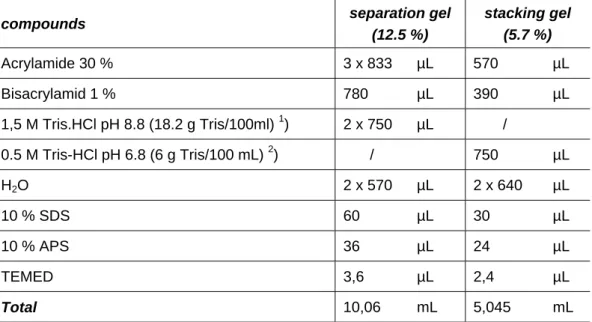
- SDS‐PAGE
- Coomassie blue staining
- Western Blot
- Gel‐affinity‐chromatography
- Fucosidase activity assay
- Fucosyltransferase 1 activity assay
- Acetylesterase activity assay
The gel was incubated for 30 minutes in the fixing solution (500 ml MetOH, 70 ml acetic acid and water to 1 L) with shaking. The gel was carefully placed on the membrane and covered with another pre-soaked Whatman paper. After elution, the gel was washed with 1xTBS-T and the flow-through was also collected.
Methods related to glycan biochemistry
- Preparation of xyloglucan oligosaccharides for analysis of endogenous xyloglucan pattern of Arabidopsis
- Preparation of xyloglucan oligosaccharide as enzymatic substrate
- Puridylamination (PA)‐labelling of xyloglucans for analysis by HPLC
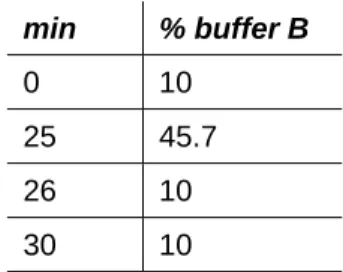
- Separation of xyloglucans by HPLC
- Purification of substrate XXFG‐PA by HPLC and verification by MS
- Purification and digestion of RG‐II
- Enzymatic release of whole RG‐II monomers
- Release of side chains by mild TFA‐hydrolysis
- Reduction of released RG‐II
- Purification of polysaccharides via carbon columns
- Analysis of xyloglucans by MALDI‐TOF‐MS
- Analysis of RG‐II by ESI‐TOF‐MS
Reduction of released RG-II or side chains was performed using sodium borohydride (NaBH 4 , Roth). Chemically or enzymatically released oligosaccharides from xyloglucans and RG-II were purified via carbon columns (Hypersep Hypercarb, Thermo Scientific). After this washing step, full RG-II was eluted by switching to a formate buffer pH 9 (0.3% formic acid, brought to pH 9 with ammonia) and increasing the percentage of AcCN over 20 min to 40%.
GUS‐staining
Total RG-II was analyzed by a ternary gradient starting with deionized water containing 0.1% formic acid and increasing the AcCN content to 15% over 10 min. ESI-MS analysis was performed with a capillary voltage of -2.7 kV and 75% dissociation energy was determined for MS/MS experiments.
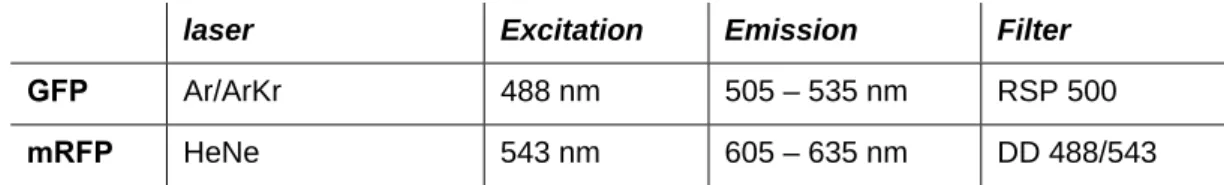
Confocal Laser Scanning Microscopy (CLSM)
ST-mRFP, a secreted version of rat α2,6-sialyltransferase fused to mRFP ( Batoko et al., 2000 ; Strasser et al., 2007 ), was used as a marker for colocalization, as it is known to naming both Golgi and Golgi. apoplast. Dual-color imaging of cells coexpressing AtFuc95AGFP and marker protein STmRFP was performed using simultaneously a 488 nm argon laser line and a HeNe 543 nm laser line. This piece of leaf was placed with the lower epidermis layer up in a drop of water on a glass slide and lightly covered with a coverslip.
RESULTS
Bioinformatic information concerning both AtFUC95A and AtFXG1
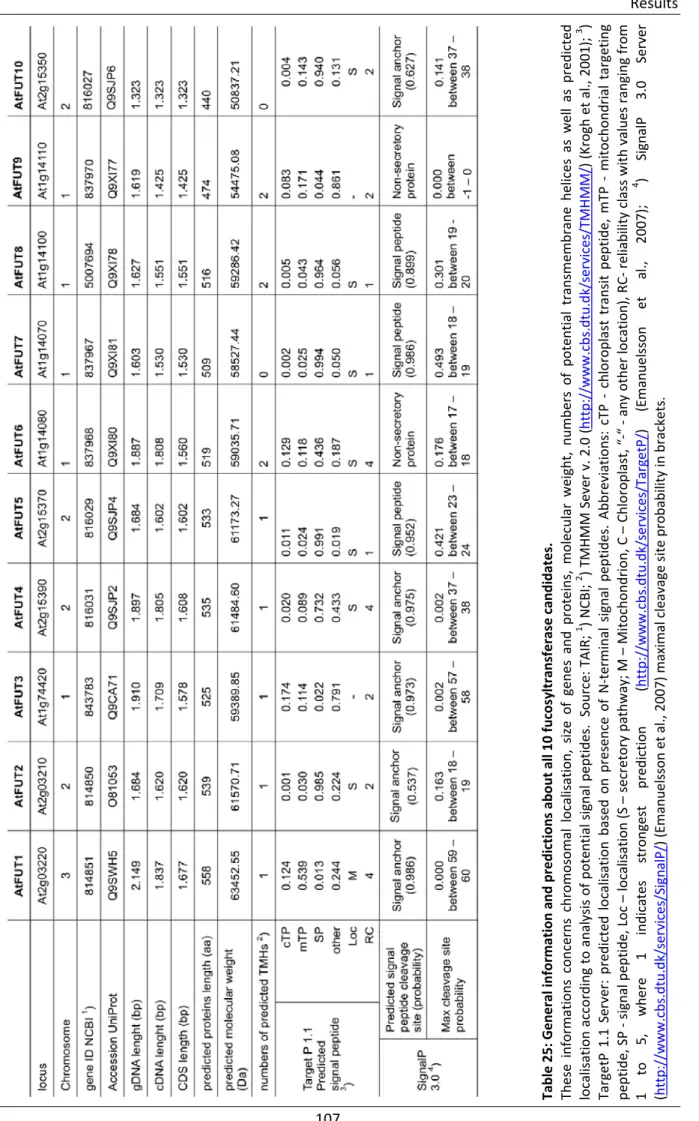
- General information and predictions
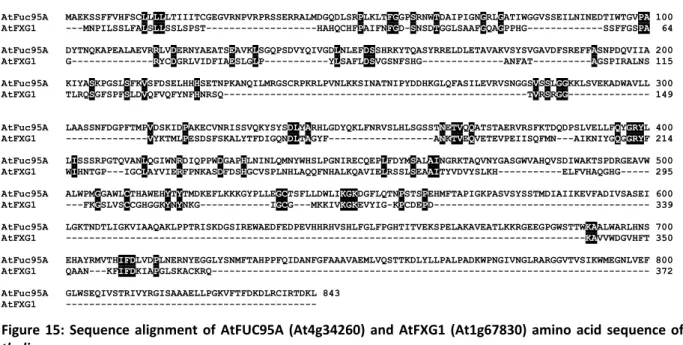
- Analysis of sequence homology between AtFUC95A and AtFXG1
- Comparison of AtFUC95A and AtFXG1 sequences to other homologues
The amino acid sequences of both AtFUC95A and AtFXG1 were compared and analyzed using the web tool Multalin (http://multalin.toulouse.inra.fr/multalin/). To show phylogenetic differences, AtFUC95A and AtFXG1 amino acid sequences were compared with their respective homologues in other organisms. Blast searching of both AtFUC95A and AtFXG1 revealed a set of hits that provided information on their potential.
Study of AtFUC95A and AtFXG1 knockout plants
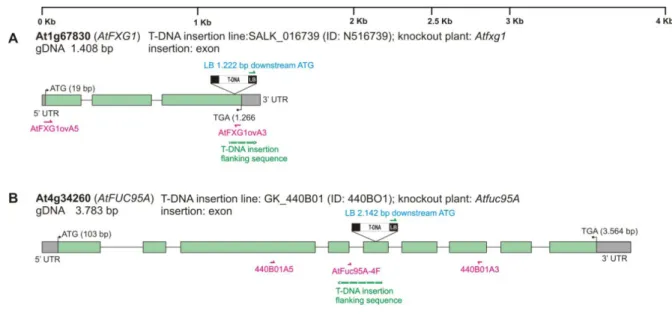
- Obtaining of knockout plants
- Identification of AtFUC95A and AtFXG1 knockout plants
- Confirmation of T‐DNA insertion by sequencing
- Confirmation of knockout status at the cDNA level
- Xyloglucan profile of AtFUC95A knockout plants but not of AtFXG1 knockout plants differs from wild type
- AtFUC95A knockout plants are defective in α1,2‐fucosidase activity but not AtFXG1knockout plants
Therefore, a direct screening for homozygous knockout plants has been performed using gene-specific primers flanking the T-DNA insertion point. Genomic DNA was isolated from young leaves of putative knockout plants for AtFXG1 and AtFUC95A. Screening of AtFXG1 knockout plants was performed with the flanking primer AtFXG1ovA3 and the left border specific primer LBa1 (Figure 18C, lane 2) and in the case of AtFuc95A with the flanking primers 440B01A5 and LB-GABI-KAT_new (Figure 18C, lane 3 ).
Characterisation of the biochemical role of AtFXG1 in A. thaliana
- Cloning of AtFUC95A and AtFXG1 into plant binary expression vectors
- Fucosidase activity assay on transiently expressed proteins shows no activity of AtFXG1
- Transient expression of AtFXG1 is enhancing the esterase activity of N. benthamiana leave extracts
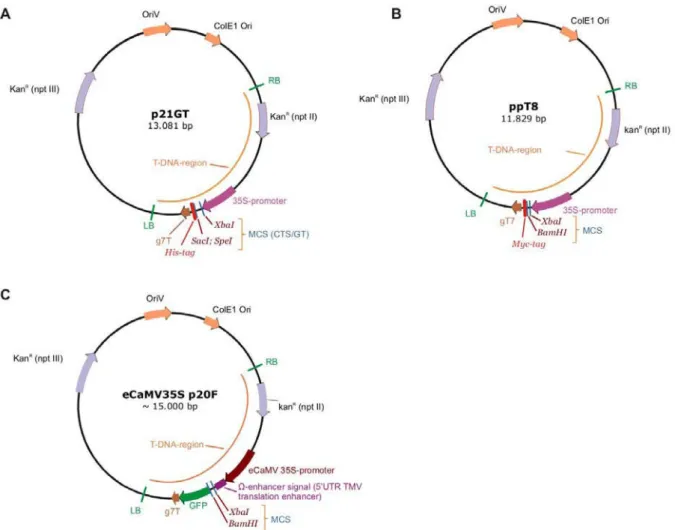
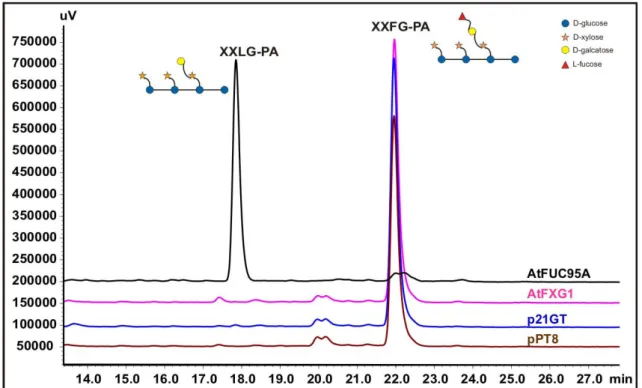
In the case of AtFUC95A, a clear conversion of XXFG-PA to XXLG-PA has been observed by removal of the terminal L-fucose. Its HPLC pattern was similar to that obtained with the leaves transformed with the empty vector p21GT and ppT8 (Figure 23). No conversion was detected at all for AtFXG1; the xyloglucan pattern was the same as for the empty vector controls.
Subcellular localization of AtFUC95A
- Characterization of an antibody produced against AtFUC95A
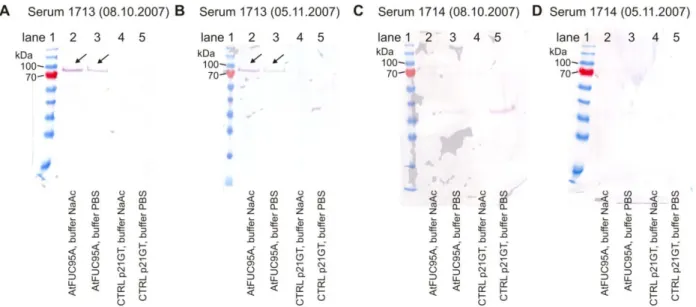
- Detection of AtFUC95A by western blot with non‐purified rabbit sera
- Purification of antibodies from rabbit sera and detection of AtFUC95A
- Subcellular localisation studies of AtFUC95A by GFP‐fusion in N. benthamiana show its presence in the
- Vector modification and cloning of AtFUC95A‐GFP
- Transient expression in N. benthamiana and confocal laser scanning microscopy (CLSM)
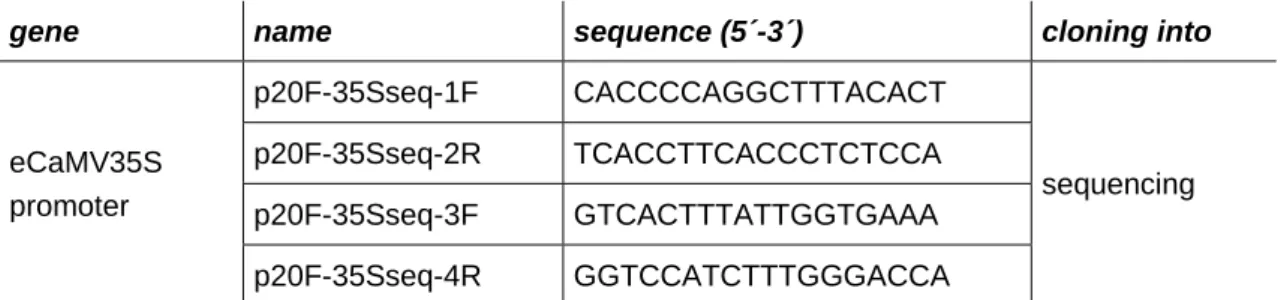
The limbs of the new promoter were sequenced to confirm its presence with the correct orientation (sequence primers are given in Table 9). Overlay of AtFUC95A-GFP and ST-mRFP images showed staining of the same compartment (Figure 27) indicating that AtFUC95A accumulates in the apoplast. The labeling of the same compartment of both AtFUC95A-GFP and ST-mRFP indicates that AtFUC95A accumulates in the apoplast.
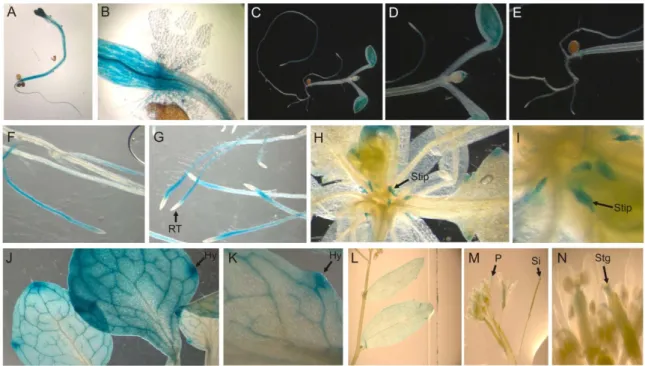
GUS‐promoter studies reveal a strong expression of AtFUC95A in the hypocotyls and the root
A closer look at the rosette revealed a strong labeling of the small leaves (stipules) emerging from the stem (Figure 28 H and I), indicating a high expression of AtFuc95A at this stage of development, while the grown leaves remained very weak or not stained (Figure 28 H and L). A strong labeling was observed in the elongated hypocotyl of the young seedling that was cultured for 5 days in the light (A and B). Young seedlings that were grown for 5 days in the dark showed strong labeling in the hypocotyl, cotyledons, and shoot apex (C to E).
Determination of the natural variability of red wine RG‐II and setting of method of analysis
- variability of chain A
- variability of chain B
- Attempt of determining which gene is responsible for fucosylation of RG‐II side chain B
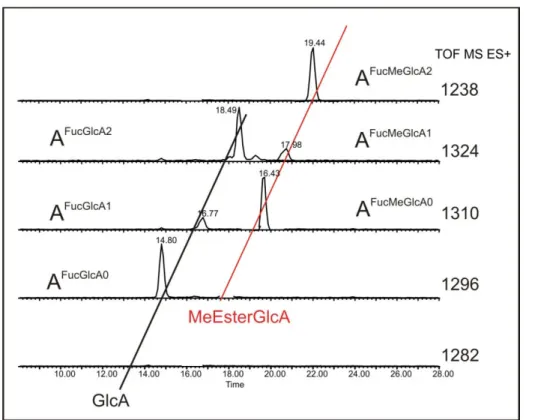
FucGal corresponds to the described A side chain, while GalGal corresponds to the A side chain by replacing the fucose residue with galactose. Single ion mass (SIM) observation for different masses obtained after TFA hydrolysis allows distinguishing two series of three peaks differing in retention times (Figure 30). The presence of two methyl groups on one galacturonic acid of the AFucGlcA2 structure was confirmed by TOF-MSMS ES- analysis (Figure 33).
General information on AtFUT1 gene family
- Sequence homology between the ten members of AtFUT1 gene family
- Cloning of fucosyltransferase genes for expression in plants
- Enzymatic assays with recombinant fucosyltransferases
The amino acid sequences of the fucosyltransferase candidates were compared and analyzed using web tool Multalin (http://multalin.toulouse.inra.fr/multalin/). AtFUT1 active on xyloglucans and an empty vector control were included as controls for the assay. With AtFUT1 as the enzyme, a conversion of non-fucosylated XXLG to fucosylated XXFG of approximately 43.4% could be detected.
Study of knock‐out or knock‐down plants affected in genes playing a putative role in RG‐II
- Study of knock‐out plants for fucosyltransferases genes
- Obtaining of AtFUT knockout plants
- Confirmation of T‐DNA insertion by sequencing
- Confirmation of knockout status on cDNA level
- Comparison of RG‐II structures from Atfut knock‐out mutants and wild type plants
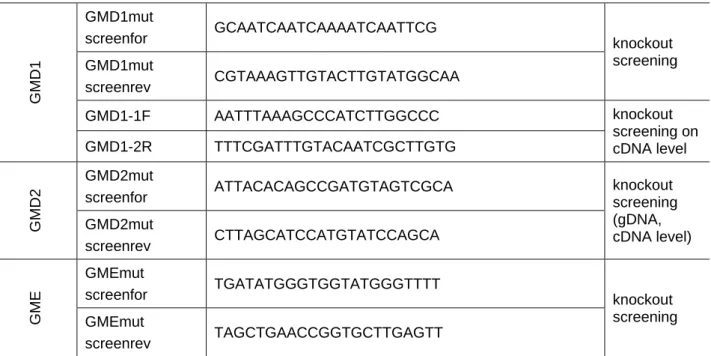
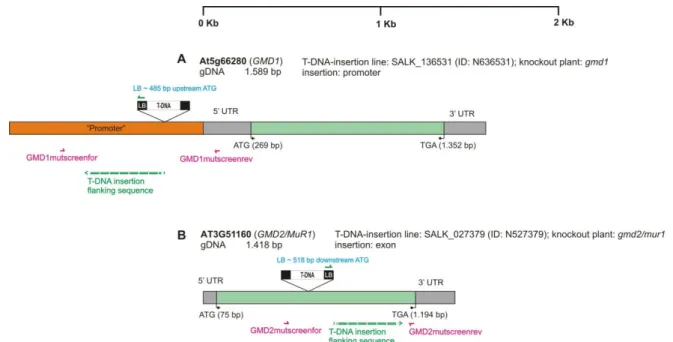
- Study of knock‐out plants for GDP‐D‐Mannose 4,6‐dehydratase (GMD)
- Obtaining of GMD knockouts
- Confirmation of homozygous gmd knockouts by sequencing
- Confirmation of GMD knockout status on cDNA‐level
- Crossing and identification of gmd double knockout plants
- Analysis of sugar nucleotides of plants defective in GDP‐L‐fucose biosynthesis
- Analysis of RG‐II from GMD knockout plants
- Study of plants affected in the expression of the GDP‐mannose 3,5‐epimerase (GME) gene
- Attempt to obtain GME knock‐out plants
- Silencing of GME by RNAi
- Analysis of sugar nucleotides from GME RNAi plants
- Analysis of RG‐II from GME RNAi plants
This screen was repeated in the progeny generation on 3 plants using flanking primers (Figure 41C, lanes 2-4). The signal was weaker in intensity than the corresponding wild-type control signal (Figure 44C, lane 3). This screening is repeated in the progeny generation using flanking primers (Figure 47C, lanes 2 and 4) as well as flanking and left border-specific primers (Figure 47C, lane 3).
DISCUSSION
In some cells, terminal α1,2-linked L-fucose residues containing epitopes were located close to the plasma membrane, in others they were present in the outer parts of the wall ( Freshour et al., 2003 ). Expression was detected in roots, but no labeling was observed in aboveground tissues, whereas hypocotyl, leaves, and stipules were labeled in the wild type ( Freshour et al., 2003 ). Comparison with mutants affected for xyloglucan-specific fucosylation could rule out a consequence of fucosylation of this type of polymer in the dwarf phenotype of mur1 (Ryden et al., 2003).
Lerouxel O, Cavalier DM, Liepm an AH, Keegstra K (2006) Biosynthesis of plant cell wall polysaccharides – a complex process. Reiter WD, Chapple C, Somerville CR (1997) Arabidopsis thaliana mutants with altered cell wall polysaccharide composition. The pectic polysaccharide Rhamnogalacturonan II (RG-II) is known to form borate cross-linked dimers that play a key role in plant cell wall integrity.

APPENDIX
List of tables
Abbreviations
Arabidopsis. detection with a time-of-flight analyzer SAP shrimp alkaline phosphatase SDS sodium dodecyl sulfate SIC selected ion chromatogram SIM selected ion monitoring.
Poster 1
Using the Gus promoter fusion strategy, very strong labeling can be seen in the hypocotyl of six-day-old seedlings. A clear conversion from XXFG-PA to XXLG-PA can be observed in the case of AtFuc95A, but not for AtFXG1 (no conversion can be exceeded with empty plasmid-transformed plants). This is additional evidence that AtFuc95A acts as a 1,2-fucosidase but not AtFXG1. Preparation of xyloglucan oligosaccharide from 5-day-old etiolated seedlings and subsequent MS MALDI-TOF analysis reveals no change in xyloglucan composition in terms of fucosylation between wild-type Col-0 (WT) and AtFXG1 knockout (AtFXG1 KO), while AtFuc95A knockout (AtFuc95A KO) shows a different xyloglucan oligosaccharide profile, a strong increase in XXFG.
Poster 2
Here we investigate the consequences of the depletion of GDP-L-fucose and GDP-L-galactose. key enzymes involved in the biosynthesis of both activated sugars have either been knocked out or silenced. No GDP-L-fucose could be detected in GMD2 KO and GMD1/GMD2 double knockout plants. Here we characterize plants knocked out or knocked down for enzymes involved in the biosynthesis of GDP-L-fucose and GDP-L-galactose by analyzing their content for these nucleotide sugars and the consequences for RGII structures.
Poster 3