I declare under oath that this thesis was drafted by me, without any unacceptable help and without the use of sources other than those referred to in the text and listed in the list of references. I further declare that all the persons and institutions have helped me directly or indirectly in the preparation of the paper. Many thanks also to Susanne Krumböck for teaching and constant support for me in the laboratory work as well as Aneta Szymusik for providing knowledge on methodological issues.
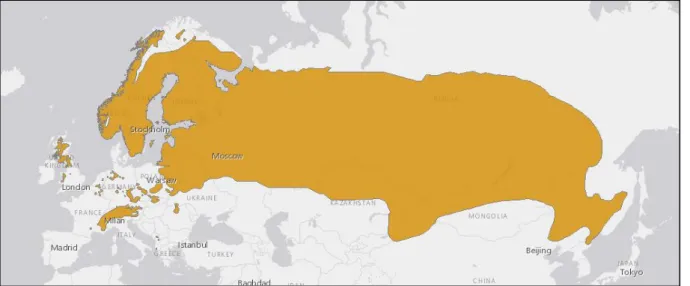
Populations of the Austrian Alpine black grouse, Tetrao tetrix, are among the largest populations of black grouse in Central Europe and are therefore important for conservation issues in this species. These alpine black populations are described as metapopulations, and migration barriers further exacerbate gene flow. Analyzes of faeces, feathers and tissue samples as well as the calibration of the Tirol dataset were successful.
Introduction
- G ENERAL STATUS OF BLACK GROUSE POPULATIONS
- S ITUATION IN THE A USTRIAN A LPS
- C ONSERVATION NEED OF A USTRIAN A LPINE POPULATIONS
- C ONSERVATION GENETICS OF BLACK GROUSE
Those populations are assumed to be isolated from each other as distances exceed the assumed maximum dispersal distance (Höglund et al. 2003). This leads to reduced genetic diversity and a greater impact of genetic drift and inbreeding, with populations ultimately facing higher risks of extinction (Höglund et al. 2007). Also, artificial disturbances such as anthropogenic recreational activities show negative influence on black grouse (Ingold 2005; Arlettaz et al. 2007).
As a consequence, genetic diversity is lost and population structure increases, significantly degrading already small populations (Frankham et al. 2010). SSRs are short base sequences (such as CA, CTAT) repeated several to hundreds of times (Frankham et al. 2010), typically located in the non-coding region. Therefore, population structure and other genetic parameters of populations can be analyzed (Höglund 2009; Segelbacher and Höglund 2009; Frankham et al. 2010).
Aims of this study
Methods
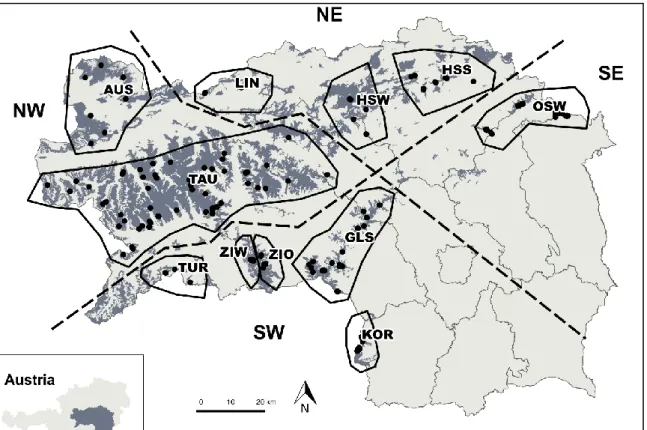
- S TUDY AREA S TYRIA
- S TUDY AREA T YROL
- E XTRACTION AND AMPLIFICATION OF SSR S
- E XTENSION AND CALIBRATION OF THE T YROLEAN DATASET
- G ENOTYPING
- A NALYSIS OF GENETIC DIVERSITY
- A NALYSIS OF POPULATION STRUCTURE
Feather samples were thawed feathers and remains of captured birds and frozen at −40 °C in paper envelopes for storage. Sections covered with uric acid were avoided, as urine (especially urea) contains additional polymerase chain reaction (PCR) inhibitors (Khan et al. 1991). Lysis was performed overnight at 55 °C with constant shaking, then the samples were centrifuged and further steps were performed according to the standard protocol.
Tissue samples were extracted using the same GenElute Mammalian Genomic DNA Miniprep Kit (Sigma-Aldrich) following an adapted standard protocol. Already existing Tyrolean data had to be calibrated, as microsatellite fragment length data is a relative quantity dependent on electrophoretic mobility due to temperature, fluorescent labels and others (de Valk et al. 2009) as well as laboratory factors such as an internal size standard , laboratory equipment or even the experience of the researcher (Moran et al. Since non-invasive samples have varying amounts and quality of DNA and may therefore lead to incorrect genotype assignment, genotyping was performed using a multi-tube approach (Navidi et al.
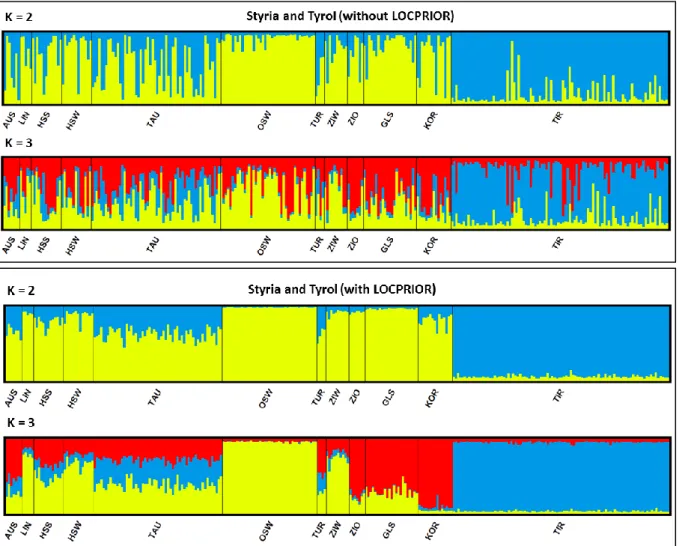
Micro-Checker 2.2.3 (Van Oosterhout et al. 2004) was then used to check for genotyping errors due to null alleles, dominance of short alleles and stuttering, as these errors can cause deviations from Hardy-Weinberg relationships. Analysis of molecular variance (AMOVA), F-statistics and pairwise FST values were calculated using Arlequin 3.5.2.2 (Excoffier et al. 2005). A systematic Bayesian clustering approach implemented in STRUCTURE 2.3.4 (Pritchard et al. 2000) was used to delineate groups of individuals based on differences in their genotypes.
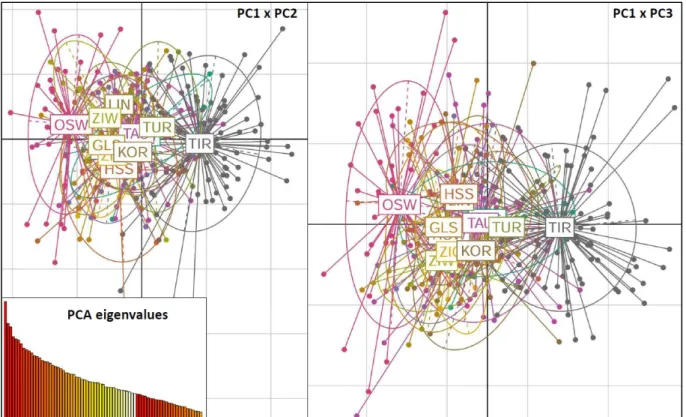
Results from STRUCTURE 2.3.4 (Pritchard et al. 2000) were analyzed for best fit K using the web application of Structure Harvester (Earl and VonHoldt 2012), determined by the highest AK and specific patterns of L(K) according to Evanno et al. already. . Averaging over all iterations and visualization via bar plots was done with the web application CLUMPAK (Kopelman et al. 2015). The population structure was further analyzed using a principal component analysis (PCA) and a principal component discriminant analysis (DAPC) (Jombart et al. 2010) as implemented in the adegenet 2.0.1 package (Jombart 2008; Jombart and Ahmed 2011) for R 3.2 .2 (R Development Core Team 2016).
The multivariate methods PCA and DAPC differ from Bayesian clustering approaches in that they do not make assumptions about Hardy-Weinberg, linkage disequilibrium, or underlying population models (Jombart et al. 2010).
Results
- E XTRACTION AND AMPLIFICATION SUCCESS
- C ALIBRATION OF SSR DATA SETS
- T ESTING FOR H ARDY -W EINBERG , LINKAGE DISEQUILIBRIUM AND PROBABILITY OF
- G ENETIC DIVERSITY IN S TYRIA AND T YROL PER LOCUS
- G ENETIC DIVERSITY IN S TYRIA AND T YROL PER SUBPOPULATION
- P OPULATION STRUCTURE OF S TYRIA AND T YROL SEPARATELY
- P OPULATION STRUCTURE OF S TYRIA AND T YROL COMBINED
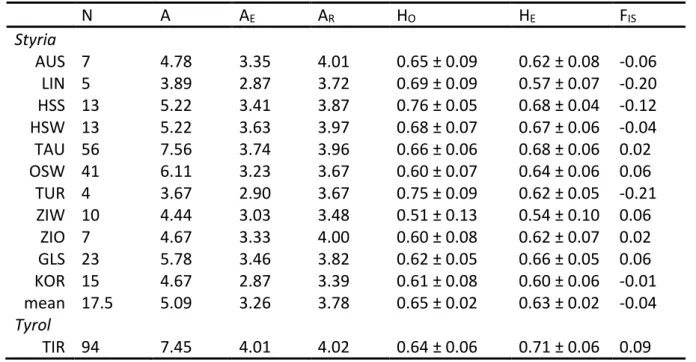
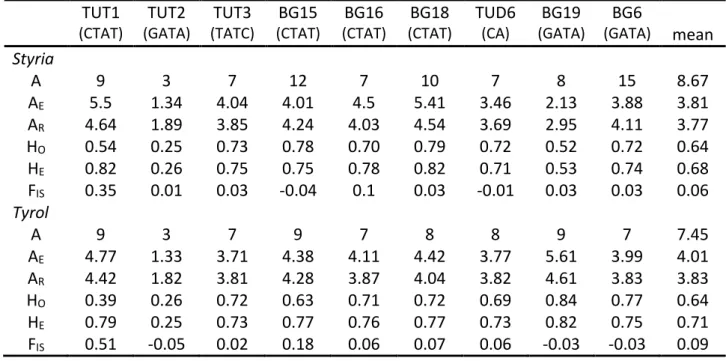
For Stiermark, the number of alleles (A) per locus (Table 3) varied from three (TUT2) to fifteen (BG6). BG19 appeared in Tyrol in much higher observed and expected heterozygosity while in BG6 only half the number of alleles was observed in Styria. BG6 showed the same effective number of alleles as in Styria, while only half the number of alleles was observed.
Number of alleles (A), effective number of alleles (AE), allele richness (AR), observed heterozygosity (HO), expected heterozygosity (HE), and coefficient of inbreeding (FIS). But differences were only due to certain alleles per locus that did not match the expectation of independence from the Fisher Exact test. The number of alleles corresponded best to the Tauern subpopulation (TAU), because both subpopulations had large sample sizes.
The effective number of alleles as well as allelic richness was a little higher than for Styrian subpopulations. Number of samples (N), number of alleles (A), effective number of alleles (AE), allelic richness (AR), observed heterozygosity (HO), expected heterozygosity (HE), inbreeding coefficient (FIS) and standard deviation. In Styria, with reference to the hierarchical analysis of molecular variance (AMOVA), 92.6 % (p < 0.0000) of the genetic variation was explained by differences within individuals and 4.1 % (p = 0.0011) among individuals of the same subpopulation.
The inbreeding coefficient FIS of 0.1068 matched the Styrian value and negated inbreeding in the Tyrolean subpopulation. For Tyrol, STRUCTURE resulted in K = 3 because the most probable number of clusters with K = 2 is also possible. Together with the inbreeding coefficient FIS = 0.0646 and the overall fixation index FIT = 0.1165, FSC showed similar results to the previously calculated FST values for Styria and Tyrol separately.
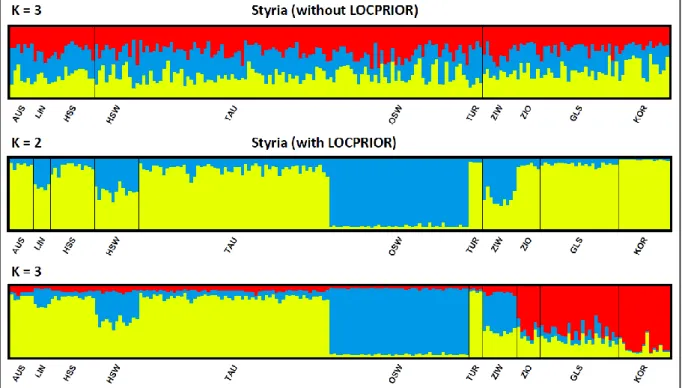
The STRUCTURE analysis without LOCPRIOR information showed that the most likely number of clusters was K = 2, the same as for the analysis including LOCPRIOR information. However, this pattern was due to the limited number of clusters, when a fourth cluster was introduced, the differentiation within Styria remained the same as in the separate analysis (data not shown). The most likely number of clusters, derived from the lowest Bayesian information criterion (BIC), was K = 7.
Discussion
- G ENETIC DIVERSITY OF THE REGIONS
- P OPULATION STRUCTURE OF THE REGIONS COMBINED
- G ENE FLOW ACROSS THE A USTRIAN A LPS
- I MPLICATIONS FOR CONSERVATION
- P OTENTIAL OF INCLUDING ADDITIONAL GENETIC INFORMATION
- M ETHODICAL CONSIDERATIONS OF CALIBRATION
PCA is a method for addressing differences in genetic diversity between groups (Reich et al. 2008) and thus inferring population structure. To account for this problem, a DAPC exhibits maximization of between-group variance variance while minimizing within-group variance (Jombart et al. 2010). Regarding genetic diversity and population structure, Austrian alpine black populations did not show any differences when compared to continuous Scandinavian populations (Höglund et al. 2007; Corrales and Höglund 2012).
In contrast, isolated populations show lower genetic diversity and greater differentiation between populations (Svobodová et al. As a result, populations of Austrian alpine shrike may not be best described as contiguous populations, as originally assumed from samples from the southern Alps (Caizergues et al. 2003b). . This confirms the findings of Larsson et al. 2008) who categorize the Austrian occurrences as permanent rather than contiguous together with the Norwegian populations.
34 However, a metapopulation system in the Austrian Alps is clearly visible (Sittenthaler et al. 2016, Sittenthaler et al. in prep.). Comparison with historical data, as carried out by Larsson et al. 2014) is necessary for a comprehensive understanding and prognosis (Höglund 2009). In a species such as the eagle, where males are philopatric, female dispersal is responsible for maintaining population connectivity (Lebigre et al. 2008; Corrales and Höglund 2012).
Conservation of genetic diversity due to source-sink systems in a metapopulation system has been observed for alpine bull (Tetrao urogallus) (Segelbacher et al. 2003b). The Austrian alpine bull populations were assumed to form a metapopulation system such as contiguous populations of eagles (Höglund et al. 2007), reflecting genetic effects of fragmentation and isolation (Segelbacher and Storch 2002). However, grouse appear to occur in a metapopulation system that is particularly vulnerable to genetic consequences of increasing fragmentation (Frankham et al. 2010).
Conservation measures as outlined by Frankham et al. 2010) would be: (1) primary increase in habitat area, (2) improvement of habitat quality, and (3) creation of corridors and steps.
Conclusion
38 (Corrales et al. 2014), gene flow between genetically distinct clasts and alpine populations is likely. Thus, a subsequent study combining northern and southern Alpine populations could lead to a comprehensive understanding of Alpine populations of the ruffed grouse and their functional role in the conservation of the ruffed grouse.
Grünschachner-Berger V (2013) Identifizierung wichtiger Weizenlebensräume als Entscheidungsgrundlage bei der Planung, dem Bau und dem Betrieb von Großprojekten im alpinen Raum. Höglund J, Baines D, Larsson JK, Segelbacher G (2003) Populationsfragmentierung und genetische Variabilität bei europäischen Auerhühnern – ein Fortschrittsbericht. Jombart T, Devillard S, Balloux F (2010) Diskriminanzanalyse der Hauptkomponenten: eine neue Methode zur Analyse genetisch strukturierter Populationen.
Kahn NW, St John J, Quinn TW (1998) Differences in chromosome-specific intron size in the avian CHD gene provide an efficient method for sex identification in birds. Krzywinski A, Keller M, Krzywinska K (2009) New methods for conserving the genetic diversity of black grouse, Tetrao tetrix: preliminary results. 42 Larsson JK, Jansman HAH, Segelbacher G, Höglund J, Koelewijn HP (2008) Genetic impoverishment of the last black grouse population (Tetrao tetrix) in the Netherlands: only demonstrable with a reference from the past.
Lebigre C, Alatalo R, Forss HE, Siitari H (2008) Low levels of relatedness on grouse leks despite male philology. Moran P, Teel DJ, LaHood ES, Drake J, Kalinowski S (2006) Standardization of multilaboratory microsatellite data in Pacific salmon: a historical view of the future. Final Report of the Research Institute for Wildlife Ecology, University of Veterinary Medicine, Vienna Rousset F (2008) GENEPOP'007: A complete re-implementation of GENEPOP.
Segelbacher G, Höglund J, Storch I (2003a) From connectivity to isolation: genetic consequences of population fragmentation in bulls across Europe. Segelbacher G, Storch I, Tomiuk J (2003b) Genetic evidence for the bullfrog Tetrao urogallus dispersal sources and sinks in the Alps. Segelbacher G, Strand TM, Quintela M, Axelsson T, Jansman HAH, Koelewijn HP, Höglund J (2014) Analyzes of historical and current populations of grouse in Central Europe reveal strong effects of genetic drift and loss of genetic diversity.
Sittenthaler M, Nopp-Mayr U, Szymusik A, Kunz F, Krumböck S, Stauffer C, Grünschachner-Berger V (2016) Genetisk differentiering af orrfuglene (Tetrao tetrix L.) i Steiermark.