Tree species diversity and updated information on their geographical distribution are some of the most important parameters for sustainable forest management. Satellite-borne sensors with very high spatial resolution offer great potential for tree species mapping. The random forest classification is performed on 32 variables, derived from 530 manually delimited reference trees of the 10 most common tree species at the study site.
In some of these studies very promising results were obtained and researchers were demonstrated the high potential of WV2 data for tree species mapping. Keywords: Tree species mapping, Remote sensing data, WorldView-2, Random Forest, Support vector machine, Vegetation indices, Rosalia.
Introduction
The publication of a large number of scientific papers on remote sensing and tree species classification is facilitated by the increased availability of multispectral and hyperspectral data (Fassnacht et al., 2016). To effectively solve the problems of the influence of neighboring crowns (for individual tree crown approaches), it should be at least 0.5 m (Wang et al., 2004; Immitzer et al., 2012). Some also offer more bands but have a lower spatial resolution, such as MODIS or ASTER (Immitzer et al., 2012).
For example, Immitzer et al. 2012), achieving an overall accuracy of 82% (ten tree species, eight bands, object-based, RF), the high potential of WV2 data for tree species mapping has been demonstrated. Also, the lower overall accuracy of 58% was obtained by Verlic et al. 2014) that analyzes five tree species (eight bands, object-based, SVM).
Material
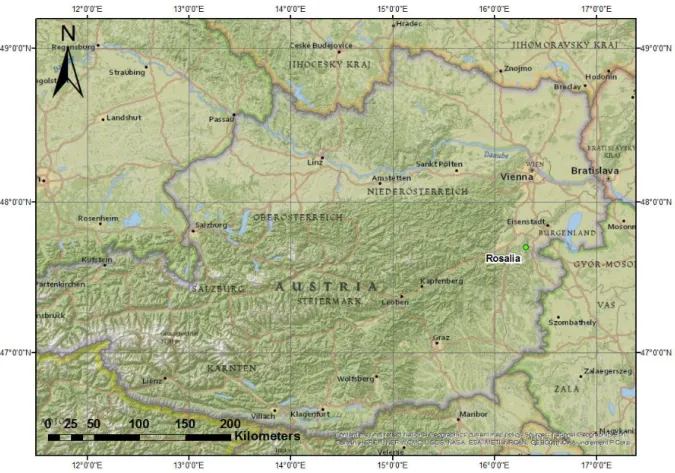
- Study area
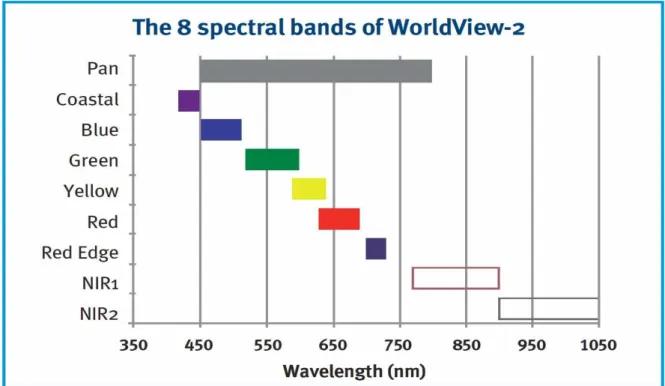
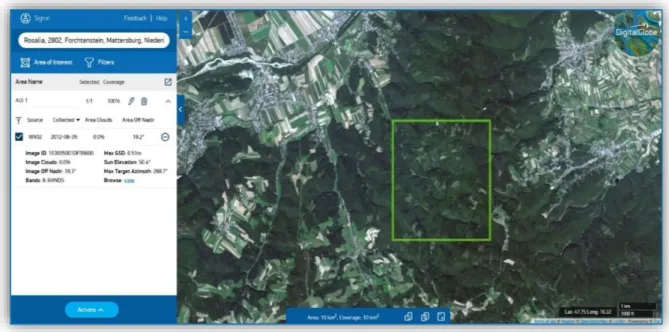
- WorldView-2 imagery
- Orthophoto imagery
- Reference data
- Software packages
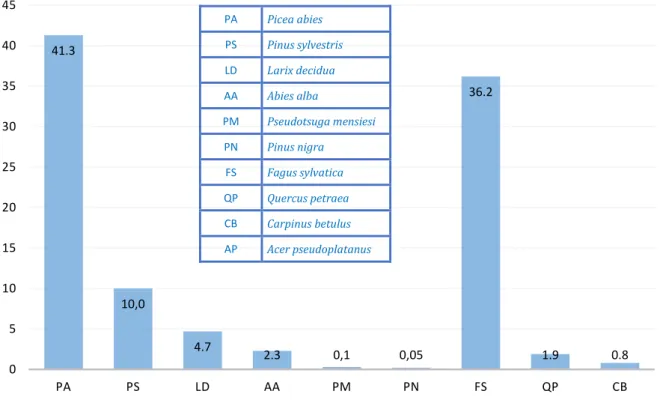
On the provider's website (http://worldview2.digitalglobe.com/) you can find additional information about the sensor. They were recorded under cloud-free conditions, near the end of the growing season, on 29 August 2012. The scientific and common name of the reference tree species and the polygon number per species are shown in Table 1.
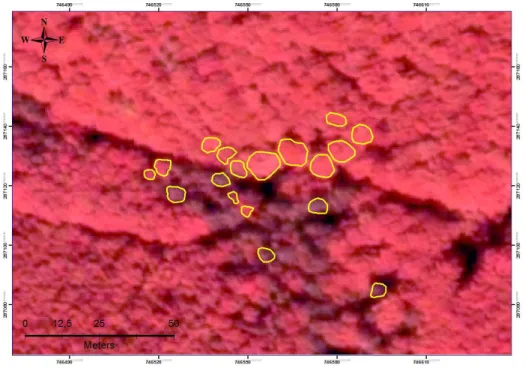
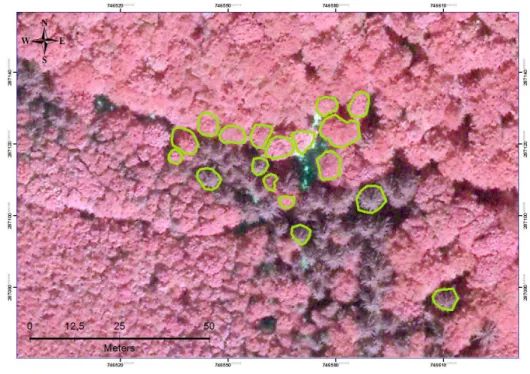
Scenes of manually drawn polygons representing the sunlit areas of the crowns of the reference trees on WV2 and the orthophoto image are shown in Figure 8. Reference trees - manually drawn polygons of the sunlit areas of the crowns of the reference trees on the orthophoto image.
Methodology
- Processing steps
- Spectral signature
- Vegetation indices
- Random Forest classification …
- Support Vector Machine
Under the same or similar site conditions, the same tree species may have different spectral characteristics (e.g., based on their different age or state of health), while the general shape of the reflection curve is largely preserved across species boundaries (Jones at all., 2010). One could say that the observed spectral radiation is a kind of mixture of different signals coming from the tree itself (useful signal) and the substrate. Spectral information from the orthoimages and the eight WV2 bands was used as input functions for object-based SVM and RF classification (using manually delineated sunlit regions of tree crowns).
In the visible part of the spectral signature, the biggest differences are in the yellow band, but this differentiation is not as clear as in the NIR bands. However, it should be taken into account that the mean values between the two species are different, but the variance can be large and lead to a large overlap of the two species (the mean values of the mean value of the tree crowns of one species were calculated and shown in Figure 11). They use transformations of spectral bands of the electromagnetic spectrum measured by satellites as reflectance from the Earth's surface. The spectral response of vegetated areas presents a complex mix of vegetation, soil brightness.
One of the most commonly used indices calculated from multispectral information is the Normal Difference Vegetation Index (NDVI). In the study published by Waser et al. 2014), the utility of calculated VIs is demonstrated by a slight improvement in the classification of seven tree species, but a significant improvement in the accuracies classifying four different levels of damaged ash. 2019) showed that using vegetation indices improved classification performance compared to using spectral signatures alone. It has great potential to quickly get an initial idea of the suitability of the particular classification model, and usually produces good results in models based on all available input data.
It operates by building a set of decision trees at training time and extracting the class that is the mode of the classes (classification) or the mean. Some studies have shown the best results by applying the recursive feature elimination procedure and including the stepwise elimination of less important features, preferring the MDA value (Guyon et al., 2002; Hastie et al., 2009; Immitzer , 2017). Object-based approach was applied for tree species classification using manually segmented sunlit regions of tree crowns.
Results
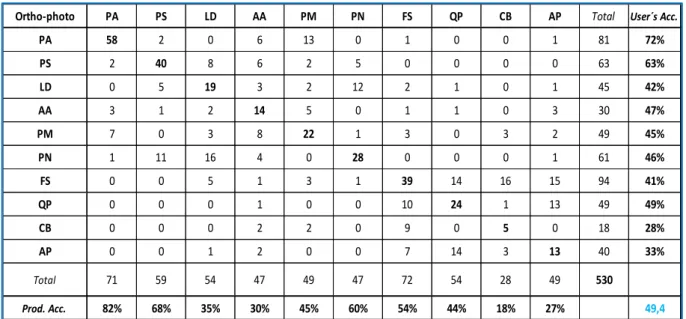
Object-Based RF classification results for orthophoto data ….…
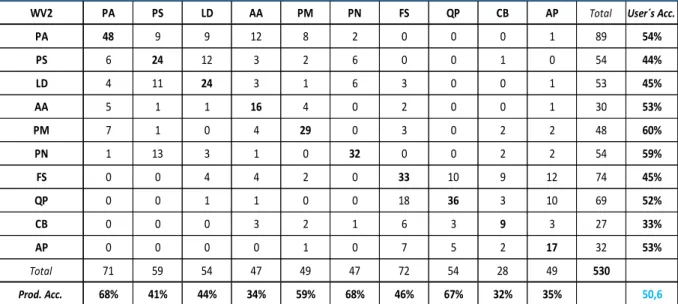
Object-Based RF classification results for WV2 data
SVM classification results for WV2 data
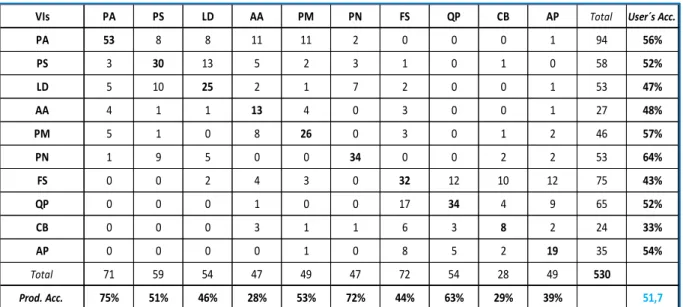
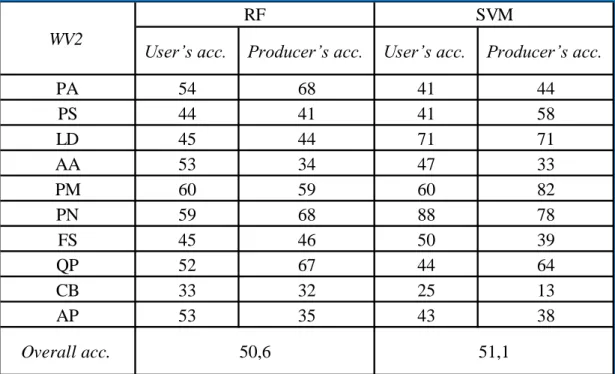
For the purposes of this work, the SVM classifier was performed on 32 variables extracted from the WV2 dataset. The achieved overall accuracy of 51.1% showed a similar result to that obtained using the RF classification algorithm. Douglas Fair (PM) showed the best producer accuracy of 82%, followed by black pine (PN) and European larch (LD).
On the other hand, the best user's accuracy of 88% was achieved by black pine (PN). Confusion matrix for the ten tree species using the eight bands of WV2 and SVM classifier. Finally, the application of the SVM classifier, using the WV2 dataset with integrated eight VIs, brought the result in an overall accuracy of 48.1%, lower as expected.
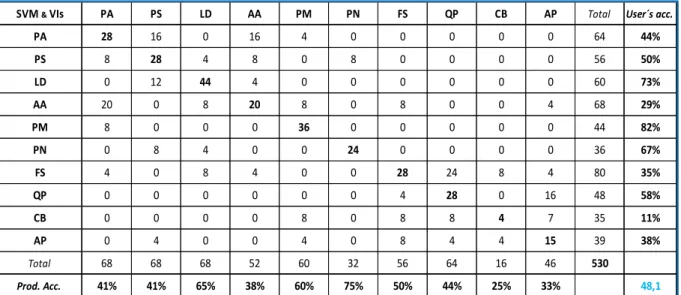
The best accuracy was achieved for Black Pine (PN) with 75% of the Producer's accuracy, and Larch (LD) with 73%. The wide range of accuracies obtained for ten tree species, calculated on the basis of 32 explanatory variables and integrated VIs, can be seen in the confusion matrix presented in Table 8. Confusion matrix for the ten tree species classifying the eight bands of WV2 with integrated VIs and SVM.
SVM & VIs PA PS LD AA PM PN FS QP CB AP Acc. Total user.
Discussion and conclusion
- Discussion …
- Comparison with other studies
- Possible reasons for lower accuracy
- Recommendations based on the main findings
31 It can be observed that some slight improvement has been achieved in the percentage of overall accuracy using WV2 data. At the same time, a decrease in the accuracy of dominant tree species, Norway spruce (PA) and Scots pine (PS), was obtained. 32 From this confusion matrix, a slight improvement can be observed in the percentage of overall accuracy achieved in the model created with the SVM classifier.
The use of additional calculated VIs increased the percent accuracy only for half of the tree species. 33 In the end, higher results were obtained by analyzing the spectral signature of five dominant tree species, as expected. In the last decade, many studies have been published demonstrating the high suitability of WV2 satellite data for classification and mapping of tree species.
Even in the same research, they achieved an overall accuracy of 96% by analyzing the 4 main tree species. In the research, published by Hartling et al., 2019, an overall accuracy of about 48% was enriched by analyzing eight dominant tree species using both RF and SVM classifiers. A similar low result of 58% of overall accuracy was obtained in the study by Verlic et al.
In some studies, a strong influence of acquisition date and acquisition parameters on the usability of WV2 data for tree species classification is demonstrated (Immitzer et al. 2017). As the number of classes increased, the performance of the models and the achieved accuracies decreased. 38 The importance of acquisition date and acquisition parameters in the usability of WV2 data is undisputed.
Conclusion
40 In addition, a comparison of recording conditions, metadata and characteristics of the WV2 sensor with comparable studies has been made. The potential of VHR satellite data is expected to continue to increase through future studies, development of the new generation of sensors with higher spatial, spectral, temporal and radiometric resolution.
List of abbreviations
Confusion matrix for five dominant tree species using eight WV2 bands with calculated vegetation indices and object-based RF classification. Comparison of the accuracies achieved by the RF classifier based on 32 variables extracted from orthophotos and the WV2 dataset for ten dominant tree species. Comparison of user and producer accuracies achieved by SVM and RF classifiers based on 32 extracted variables from ten dominant tree species, using the eight-band WV2 dataset Table 11 .
Comparison of user and producer accuracies obtained with SVM and RF classifiers, based on 32 extracted variables and calculated VIs from ten dominant tree species, using eight band WV2 data sets. Comparison of user and producer accuracies for five dominant tree species using RF classifier, based on WV2 dataset.
Classification of tree species in the Southern Alps using multispectral and hyperspectral data with very high geometric resolution. Classification of tree species in cities using a WorldView-2/3 and LiDAR approach to data fusion and deep learning, remote sensing. Investigate multiple data sources for tree species classification in temperate forests and use for single tree delineation.
Random Forest Tree Species Classification Using Very High Spatial Resolution WV2 Satellite Data. Optimal input features for tree species classification in Central Europe based on Multi-Temperal Sentinel-2 data. Assessing the potential of multi-seasonal worldview-2 imagery for mapping West African agroforestry tree species.
Classification of tree species using Hyperion and Sentinel-2 data with machine learning in South Korea and China. A comparative analysis of high spatial resolution Ikonos and Worldview-2 imagery for mapping urban tree species. Comparison of support vector machine, random forest and neural network classifiers for classification of tree species on airborne hyperspectral APEX imagery.
Tree species and age class mapping in a Central European woodland using optical remote sensing images and orthophoto-derived stem density–. Classification of tree species composition using a combination of multispectral imagery and airborne laser scanning data. Evaluating the potential of WV2 data to classify tree species and different levels of ash mortality.
Affirmation
Curriculum Vitae .…