Ces statistiques sont utilisées pour établir une matrice origine-destination cohérente pour les pays de l'Union européenne (UE). La matrice ainsi construite permet de calculer les taux de migration entre les pays de l'UE, qui sont ensuite introduits dans un modèle de projection démographique multirégional développé au niveau de l'UE. Les projections sont faites selon quatre scénarios alternatifs : deux d'entre eux diffèrent en termes de flux migratoires intra-UE, tandis que les deux autres diffèrent en termes de migration vers et depuis des pays hors UE (le reste du monde).
En ce qui concerne les flux migratoires vers et depuis les pays hors UE, le premier scénario alternatif repose sur l'hypothèse que le solde migratoire tend vers 0 à long terme. Il s'agit de la population des pays de l'UE par rapport à l'émigration vers le reste du monde et de la population du reste du monde par rapport à l'émigration vers les pays de l'UE. Premièrement, une distinction est faite entre les flux migratoires au sein de l'UE et les flux à destination et en provenance de pays extérieurs à l'UE.
Deuxièmement, l'approche adoptée pour modéliser les flux intra-européens satisfait à la condition de cohérence selon laquelle le solde migratoire total entre les pays de l'UE est égal à 0. Les résultats de deux scénarios alternatifs prenant en compte la croissance démographique hors de l'UE se situent dans la fourchette supérieure des projections. publiés par ces institutions.
Introduction
The fifth section presents the population projections obtained with the set of alternative international migration scenarios: two for migration within the EU and two for migration to and from the rest of the world (giving a total of four alternatives). The assumptions on future trends in mortality and fertility are the same in the four alternatives and match the assumptions used in the population projections published in 2017 by Eurostat (ESSPOP2015). The fifth section also compares the results obtained for the European Union with projections published by other institutions (United Nations, Eurostat and the Wittgenstein Center for Demography and Global Human Capital).
The methodology presented in the working document is being developed as part of the Population Forecast Working Group chaired by Eurostat 1. Note that the population projections published by Eurostat cover 28 EU Member States and Norway. The population projections presented in this working document, in particular intra-European migration flows, also include Norway.
General overview of the model
One of the aims of this paper is to show how data available on the Eurostat website have been used to obtain a fictitious but realistic matrix that works in a projection model for international migration between EU countries. Regarding international migration to and from the rest of the world, two different approaches are considered. The first considers that the net migration of each European country with all non-EU countries tends to 0 to 2150.
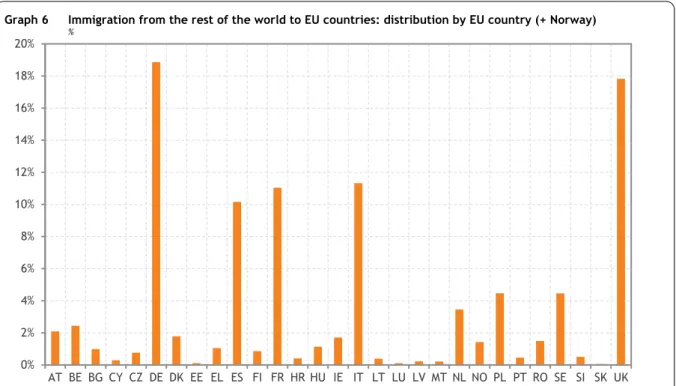
This assumption is included in the international migration assumption used in the population projections published by Eurostat (Eurostat, 2017). It is also based on the idea that, in the long term, economic inequalities between countries that tend to balance migration flows will completely disappear. In addition, immigration from the rest of the world accounts for future population trends in that region of the world.
The population that is at risk of emigrating to EU countries is thus taken into account (equation 5). Emigration from European countries to the rest of the world (equation 6) is based on average observed emigration rates. Immi , = EmiRate ∗ (P ) (5) Emi , = EmiRate ∗ (P ) (6) Several assumptions must be made about emigration rates from or to the rest of the world and expected trends in population growth outside the EU.
Intra-European migration
Available data 12
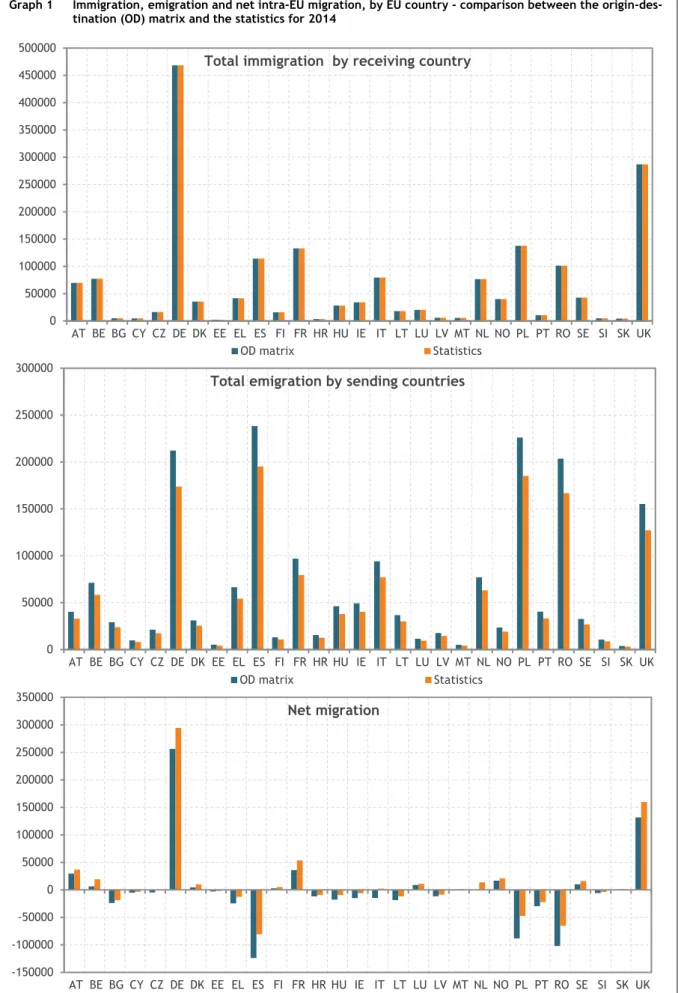
This section describes the sequential steps taken to complete the missing data (from 2008 to 2015) in the O-D table. Nevertheless, Destatis provided us with immigration statistics by country of previous residence and emigration statistics by country of next residence for 2014, which are included in the matrix. Total immigration to the EU from the EU ≠ Total emigration from the EU to the EU: the flows are not consistent.
The empty cells are replaced by a non-zero value6, which will be adjusted in the next step. At the end of step 6, the sum of the columns is equal to the sum of the rows, and the net migration of the EU (including Norway) is 0. By definition, there is no difference between the total immigration (from the other European countries) as published by Eurostat and total immigration filled in the O-D matrix.
The Eurostat statistics are considered the target value for total immigration within the EU, broken down by country. For emigration, the graph shows that emigration, as recorded in Eurostat statistics, is underestimated. Based on statistics, the sum of net migration by country is different from zero, which is not consistent.
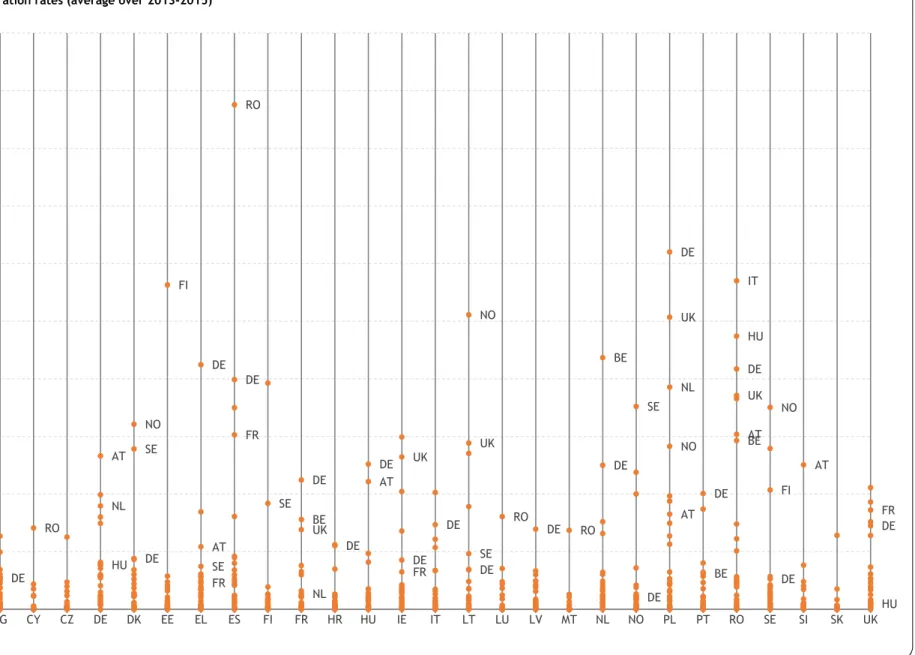
Migration growth by country, calculated in the O-D matrix, is quite close to statistical data. Total immigration to the EU from the EU = total emigration from the EU to the EU: consistency is achieved. For the projections presented in Section 5, age-specific migration rates are calculated based on all flows entered into the O-D matrix for the years 2012 to 2015 and the population in each country measured over the same period.
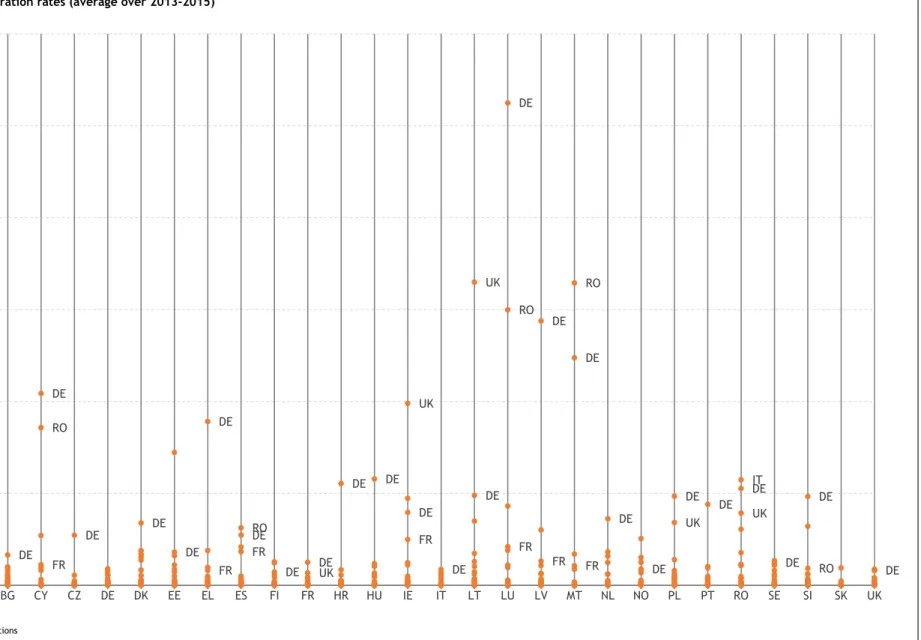
The graphs read as follows: the first vertical line represents the rate of emigration from Austria to each of the other member states. As mentioned in section 2, two different approaches are used in the design model for international migration between EU Member States and the rest of the world. In the second approach, which separately models immigration and emigration flows from or to the rest of the world, additional assumptions must be made to calculate the levels of immigration and emigration.

Immigration from the rest of the world 21
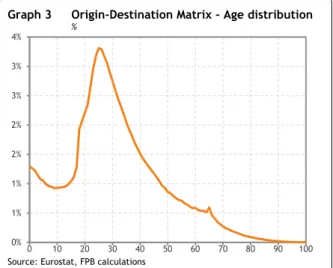
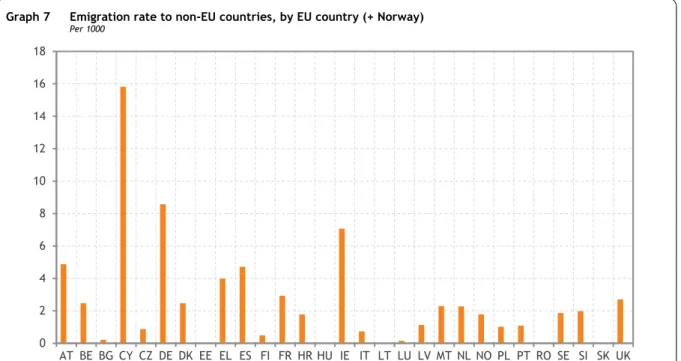
Based on the statistics available on the Eurostat website, three steps must again be taken to determine the emigration rate by age and by European country to the rest of the world. This information is published by Eurostat in the following statistics: emigration by country of next habitual residence (and select the total of non-EU countries). The classification by age is based on the standard age distribution as shown in the O-D matrix (see section 3.1).
At this stage, it is assumed that the age distribution of emigration to the rest of the world is identical to that used for emigration to EU countries. The average rates of emigration to the rest of the world during the period 2012-2014, regardless of age, are presented in graph 7. The multi-regional population projection model is tested using four alternative scenarios, which differ according to the method used or to calculate intra-European migration flows (single or double migration flows) or to determine international migration to and from the rest of the world (net migration tends to 0 or advances in line with world population growth).
Migration within Europe Migration to and from the rest of the world Alternative 1 (ALT1) Uniform migration rate (Mr1) Net migration tends to 0.
Assumptions 24
In alternative 2 and alternative 4, migration flows are projected by taking into account populations at risk of migration, namely the population of European countries in the case of emigration to the rest of the world and the population of the rest of the world in the case of emigration to European countries. Immigration to European countries is determined by multiplying the projections of the rest of the world's population by emigration rates from the rest of the world to EU countries as calculated in section 4.1. The projections of the rest of the world's population are drawn from the baseline published by the United Nations.
The projection of emigration from European countries abroad is based on emigration rates, which are determined on the average of the period (graph 7) and remain unchanged throughout the entire projection period. The analysis shows the impact of methodological decisions for each alternative scenario on population growth. Comparing alternatives 1 and 2 or 3 and 4 highlights the differences between these alternative scenarios in terms of migration flows to and from the rest of the world.
It should be noted that the choice of the rate of single or double migration as presented in the four alternative scenarios in section 5.2 has no impact on the population growth of the European Union. Consequently, the evolution of the general population of the European Union is identical in ALT1 and ALT3, as well as in ALT2 and ALT411. The projection of the Wittgenstein Center for Demography follows a relatively similar trend until 2050, then starts to decrease, contrary to ALT2 and ALT3.
The migration scenario of the Wittgenstein Center for Demography is based on average immigration and emigration rates calculated on the basis of the last observed years. Furthermore, the assumptions on net migration are quite similar (see Figure 10). The United Nations estimates that net migration per country remains stable until 2050 (at the average level recorded in the last observed years) in the medium scenario and then gradually halves until 2100. (for more details on the methodology, see United Nations, 2017). This number could therefore be considered too high and limit the value of the model.
This would at least allow an analysis of the stability of the model depending on the statistics used and the periods chosen to calculate the average rates. It has also been suggested that rates of emigration from the rest of the world to Europe should be taken into account, distinguishing between age. Given the specific age profile of migrants and expected changes in the age structure of the world population, this distinction is indeed important and should be included.

Bibliography
Annex - population projection and demographic components by country