This working paper presents a general overview of the structural trade patterns of Belgium and its main trading partners over the period 1991-1997. This method makes it possible to separate and quantify the individual roles of competitiveness and structural effects in determining export performance. In the period under review, the decrease in Belgium's global export market share (data for the area of the Belgium-Luxembourg Economic Union) was primarily the result of the negative contribution of Belgian market specialization.
However, some of these European countries registered a larger positive contribution from the competitiveness effect (the Netherlands, the United Kingdom) than Belgium, or a positive contribution from the product effect (Germany and the United Kingdom). The main impact of the crises on Belgium's trade performance was via indirect effects via its main trading partner Germany. In 1997, world trade volume grew by 10%, one of the fastest growth rates in the last decade, according to the World Trade Organisation2.
Belgian exports are rather weak in the electronics sector, one of the fastest growing sectors of world trade during the period 1991-1997.
II The Constant Market Shares Analysis
Background and Contents of the CMSA
The CMSA is an accounting method to decompose the variations over time of a country's aggregate export share ex-post. CMSA is a descriptive method which in itself does not provide any insight into the explanatory factors underlying the changes in the market shares. It does not examine the causal relationships between trading performance and other economic variables such as the exchange rate.
The utility of CMSA is to separate and quantify the contribution of a country's trade pattern (market and product mix) to trade performance and to quantify the contribution of other factors. For an explanation of the magnitude of the components, CMSA can be combined with complementary analyzes (time series or cross-sectional analyses).
Shortcomings of the traditional formulation of the CMSA and solutions proposed by Milana (1988)
In the traditional CMSA formulation, the "competition effect" is a residual effect calculated as the difference between the change in total export weight and the "structural effect". The remaining term interpreted as the "interaction" effect is excluded, being distributed to the other components of the CMSA. Variability of results depending on the order of decomposition of the structural effect.
This results from the fact that the decomposition method is valid only if the market expressions and the product effects are calculated asymmetrically, that is, in the new CMSA formulation (used in this paper), the third effect is calculated explicitly.
New formulation of the CMSA by Milana (1988)
The sum of the other three effects (market effect, product effect, residual effect) represents the structural effect, which largely reflects changes in the market and in the product specialization of the country under consideration. It is calculated by adding together the changes in the export shares of a country for each market and for each product (second term in brackets), weighted by the relative import shares of the partner countries in world trade. X term in brackets), weighted by the export shares of the country concerned in these geographic markets.
It is calculated by summing the changes in the shares of individual products (total by market) of total world trade (the second term in brackets), weighted by the respective country's export shares in those sectoral markets. These relative changes are weighted by the respective country's export shares, weighted by the relative importance of those products and those markets to total world trade.
III Results of the CMSA (1991-1997)
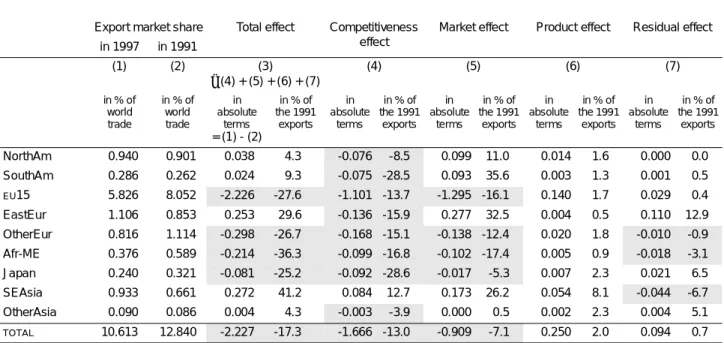
CMSA (1991-1997) - Global results
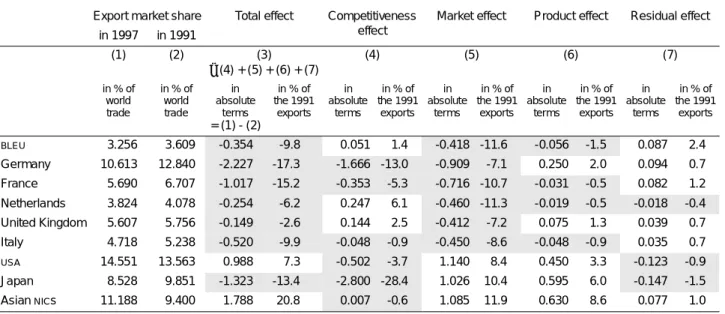
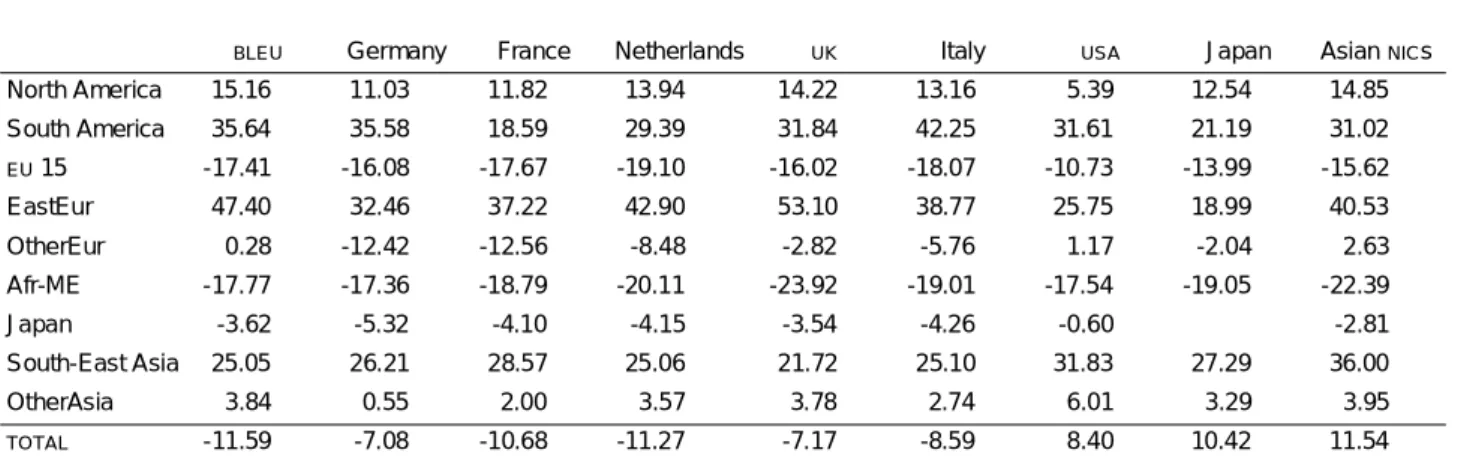
On the other hand, in the case of Germany, the effect of negative competitiveness (-13%) was the main driver of the drop in the export market share. Moreover, this effect was accompanied by a negative market effect (-7.1%), while the positive effect of German commodity specialization was not sufficient to offset these negative effects. In the case of France, the large negative contribution of market specialization was reinforced by the impact of a negative competitiveness effect and a small negative product effect, which explains the decrease in its export market share from 6.7% in 1991 to 5.7% in 1991. 1997.
In the case of the Netherlands, the negative contribution of market specialization was accompanied by a small negative contribution of the product effect. Between 1991 and 1997, the United Kingdom registered the smallest decline in export market share among the European countries considered. This was the result of opposing forces: the negative influence of the market specialization effect was partially offset by the combined positive influence of the competitiveness effect and the product effect.
This is mainly due to the negative contribution of the market effect (-9.9% of the share of exports in 1991), while the negative contributions of the effect of competitiveness and the effect of product specialization were less important. In the United States, the combination of positive market effects and product specialization more than offset the negative effect of the competitiveness effect. In contrast, in Japan these positive effects were not sufficient to compensate for the significant loss of competitiveness.
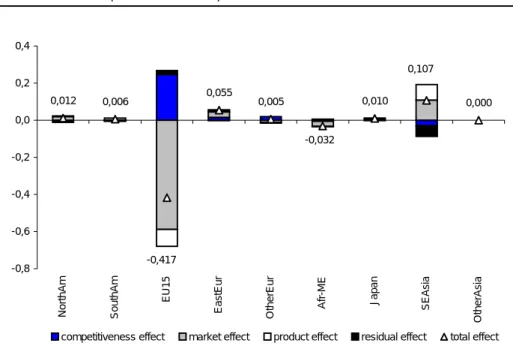
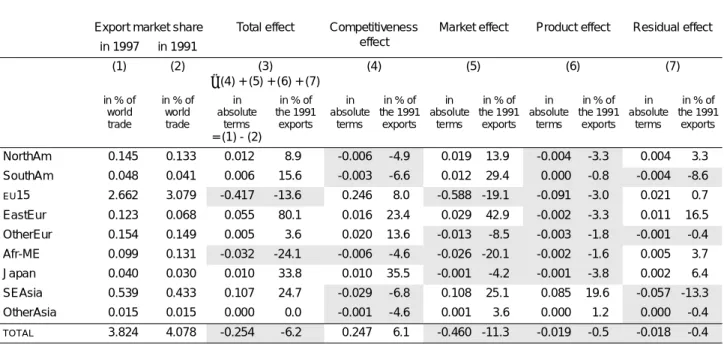
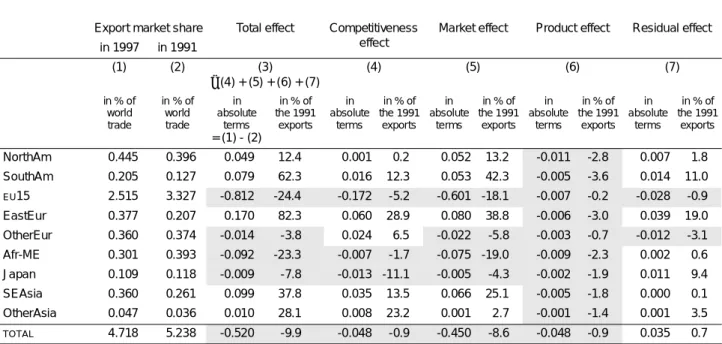
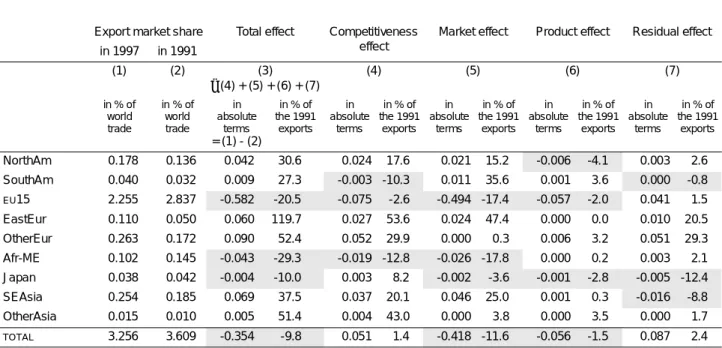
The positive market and product effects contributed the most to this global result, while the positive effects of the competitiveness effect and the residual effect were very small. Structural effects are the sum of market effect, product effect and residual effect. The total effect, expressed in % of export shares in 1991 and denoted by ∆ in the figure, corresponds to the global change (+ or -) of the country's export market share.
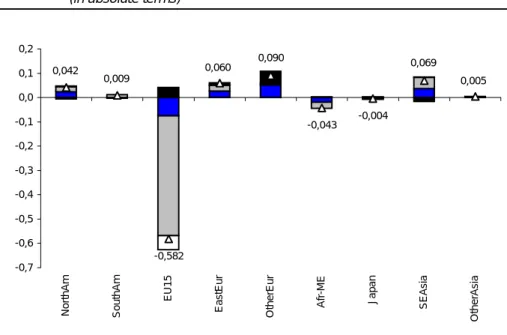
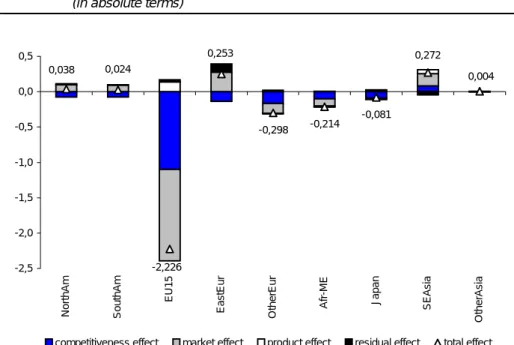
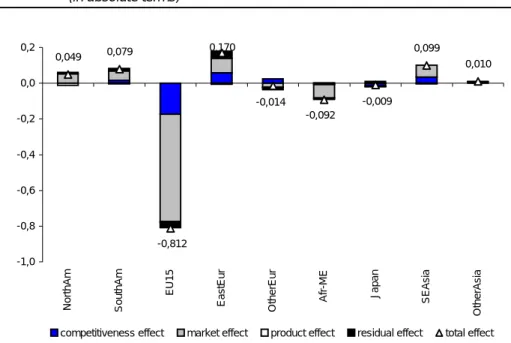
CMSA (1991-1997) - Contributions of the different geographical areas
Belgium's export share also increased with the countries of "other" Europe due to the positive contributions of the competitiveness effect and the residual effect. This result, in the case of Germany, was due to the combined negative contributions of the market effect and the competitiveness effect, while the positive product and residual effects were less significant. In contrast, between 1991 and 1997, all European countries surveyed recorded a rapid increase in their export market share with the countries of Eastern Europe, due to the positive contributions of competitiveness (except in the case of Germany), market effect and product effect.
The positive contributions of the countries of Eastern Europe, Southeast Asia, South America (except France) and North America (except France) were insufficient to offset the adverse effect of the EU15. The global product effect was also positive in the case of the United Kingdom, but the contributions of North America and Africa and the Middle East were negative. In the case of the Netherlands, the global product effect was negative, but the contributions from Southeast Asia and "other" Asia were positive.
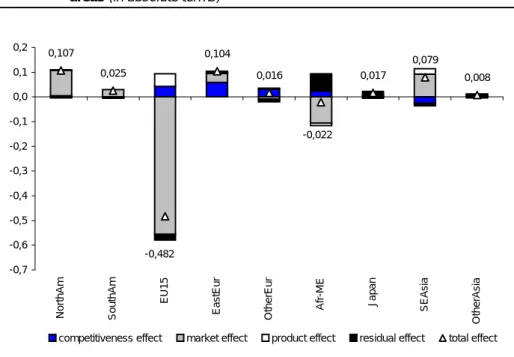
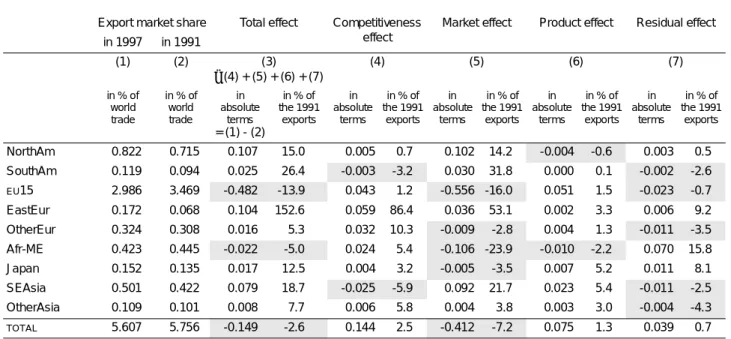
The positive contributions from South America and North America were due to the combined positive impact of the competitiveness effect, the market effect and the product effect. In the case of South East Asia, the positive impact of market and product effects was sufficient to offset the negative competitiveness effect. In terms of the product effect, the overall effect was positive in the case of the United States and was the result of the positive contributions from each geographic area (excluding Eastern Europe, Africa and the Middle East).
In terms of the product effect, the global effect was positive in the case of Japan, and this was the result of the positive contributions from each geographic area (with the exception of Eastern Europe, Africa and the Middle East). Finally, it should be noted that the residual effect was positive and resulted from the positive contributions of each geographic area (with the exception of South America, Eastern Europe and "other" Asia). In terms of the overall effect, the rapid increase in export market share recorded by the countries of Southeast Asia between 1991 and 1997 was related to the positive contributions of each region, with the exception of the EU15, Africa and the Middle East. and Japan.
The negative contribution from Japan was due to the negative impact of market competition and product effects. Finally, it should be noted that the residual effect was positive and mainly resulted from positive contributions from Eastern Europe, South America and Japan.
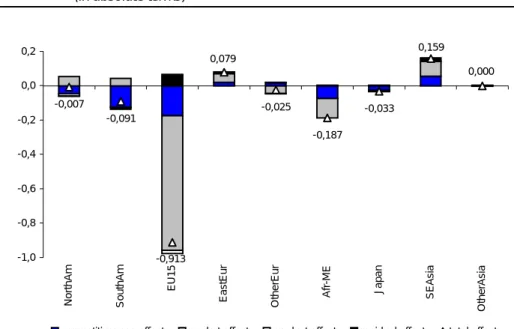
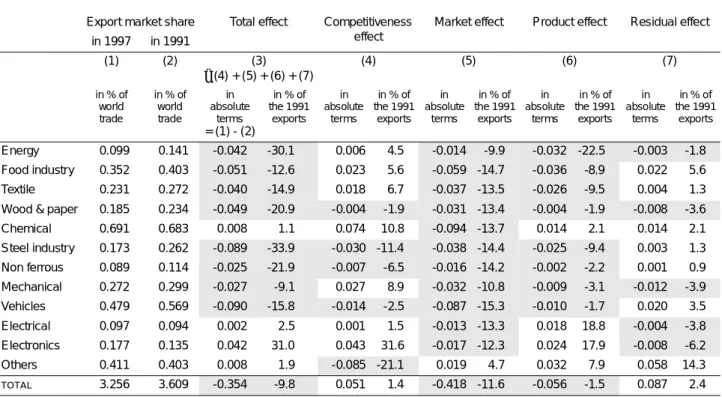
CMSA (1991-1997) - Contributions of the different sectors
This negative impact resulted from the combined negative contributions of the market effect and the product effect. It was the result of negative contributions from each sector, with the exception of the “other” sector. In Italy, the positive contributions from the mechanical, chemical, wood and paper, steel, non-ferrous and "other" sectors were not enough to offset the negative contributions from the other sectors.
In the Netherlands, this result was due to the positive contributions of all sectors, with the exception of the mechanical and "other" sectors. In the United Kingdom, the positive global effect is explained by the positive contributions of the following sectors: food industry, chemical, steel industry, and "other". This result was due to the significant positive effects of the following sectors: chemical, electrical and electronics and "other".
The positive contributions of the electrical, electronics, vehicles, chemical sectors and, to a lesser extent, mechanical, wood and paper and textile sectors were sufficient to offset the negative contributions of energy, food industry, steel industry, non-ferrous, and "other " sectors. This result was due to the significant positive effects of the following sectors: chemicals, electrical, electronics, vehicles and "other". This result was due to the negative contributions of each sector, with the exception of the chemical, non-ferrous and "other" sectors.
Regarding the competitiveness effect, Japan recorded a strong negative effect due to the negative contributions of each sector, with the exception of the "other" sector. This result was due to the positive contributions of each sector, with the exception of energy, food industry, textile and wood and paper. The competitiveness effect was almost zero, the net result of opposing contributions from different sectors: the negative contributions from the energy, food industry, textile and wood and paper sectors versus the positive contributions from the remaining sectors.
The other significant positive contributions came from the following sectors: chemicals, electricity, wood and paper and "others". The negative contributions from the chemical industry, steel industry, non-ferrous, electronics and "other" sectors were offset by the positive contributions from the remaining sectors.
IV Conclusion
V Bibliography
VI Annexes
Annex I
Annex II
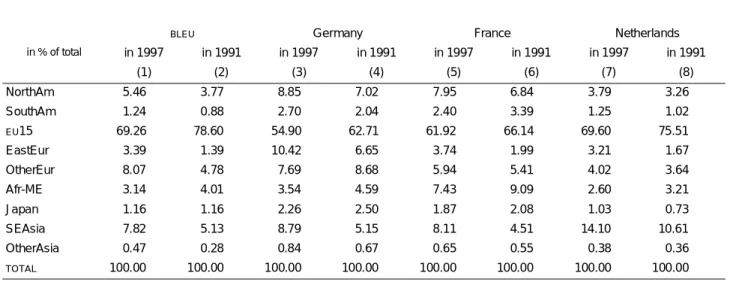
Notes: BLEU = Belgium-Luxembourg Economic Union, Asian NICs = Hong-Kong, Singapore, South Korea, Taiwan, Malaysia, Thailand, Philippines, Indonesia.
Annex III