1
Crystal Structure, vibrational, electrical, optical and DFT study of C
2H
10N
2(IO
3)
2.HIO
3Mohamed Amine Ben Abdallah*a, Alessia Bacchib,c, Antonella Parisinid, Stefano Canossab, Laura Bergamontib, Davide Balestrib and Slaheddine Kamouna.
aLaboratory of Materials Engineering and Environment (L.R.11ES46), BP 1173, ENIS, Sfax University, Tunisia.
b Dipartimento di Scienze Chimiche, della Vita e della Sostenibilità Ambientale Università di Parma Parco Area delle Scienze 17/A – Plesso Chimico, 43124, Parma, Italy.
c Centro Interdipartimentale BioPharmanet-TEC, Università di Parma Parco Area delle Scienze 27/A – Plesso Chimico, 43124, Parma, Italy.
d Dipartimento di Scienze Matematiche, Fisiche e Informatiche Università di Parma Parco Area delle Scienze 7/A – Plesso di Fisica, 43124, Parma, Italy.
*Correspondence author : [email protected]
Abstract
The reinvestigation of the EDA-HIO3-H2O system using a different stoichiometric ratio gives rise to a new iodate salt C2H10N2(IO3)2.HIO3 denoted as EBIMIA. In this study, we reported the structural properties of ethylenediammonium bis iodate mono iodic acid using X-ray powder and single crystal diffraction at room temperature. The Hirshfeld and the potential energy surface analysis reveal that I…O and N-H…O are the most noticeable interactions that took place inside the crystal and contribute to the cohesion and stability of the synthesized compound. The DSC measurement shows that this iodate salt undergoes two phase transitions, the first at T = 290 K and the second at T = 363 K. The dielectric analysis confirms the second transition that occurs at the studied temperature domain 338-413K. The impedance data obey a circuit model consisting of a parallel combination of a bulk resistance and CPE. The frequency dispersion of the conductivity follows Jonscher’s law and the charge carrier transport may be interpreted using the correlation barrier hopping mechanism (CBH). Moreover, the electronic properties and the vibrational
2
analysis of this novel iodate salt are studied using DFT and compared to the experimental data given by the FT-IR, Raman and UV-visible spectroscopies.
Key words: iodate salt, electrical properties, electronic structure, vibrational analysis, DFT, optical study.
1. Introduction
The isolation, identification and characterization of different crystal forms staring from the same molecular entities represent an interesting issue of modern solid-state chemistry. It’s important to mention that the variability of physical and chemical properties as a function of different crystal forms may be exploited for different scopes and lead to different applications and utilization of the solid materials [1]. Moreover, the iodate salts may be employed for many industrial applications, such as solid electrolyte used for fuel cells and supercapacitors [2] due to their high proton conductivity [3]. The present work aims via the synthesis of new hybrid materials to combine the advantages of the iodate anions, which are used as building blocks to generate non- centrosymmetric structure exhibiting ferroelectric and nonlinear optical properties [4], and the EDA molecule that displays high flexibility and reactivity. In keeping more closely with the spirit of our previous study in which, the interaction of iodic acid with ethylenediammonium in aqueous solution yielded to the EBITIA [5] and the two polymorphs α-EBI and β-EBI [6], this study is set out to reinvestigate the EDA+HIO3+H2O system using a different stoichiometric ratio. This attempt gives rise to the new iodate salt, which is the ethylènediammonium bis iodate mono iodic acid crystal C2H10N2(IO3)2.HIO3 denoted as EBIMIA. At the first sight, this work looks conceptually similar to our previous mentioned studies, because of the use of the same investigation procedure, i.e., the utilization of standard techniques (XRD, DSC, CIS UV-Vis, FT- IR and Raman spectroscopies) and computational DFT approach. However, this work presents many original findings concerning especially the novel crystal structure of EBIMIA. Besides, additional analyses are undertaken to characterize the iodate salts such as the potential energy surface scanning (PES) and the molecular electrostatic potential (MESP) which are carried to find out the energetically most stable molecular arrangement and to determine the most reactive molecular sites within the studied compound. We also extend the structural investigation by using Hirschfeld surface analysis to study the nature of interactions and their quantitative contributions towards the crystal packing. Moreover, a detailed analysis of electronic structure is carried out
3
based on DFT using of the generalized gradient approximation (GGA) in order to determine the band gap energy and the partial contribution of each molecular component to the valence and conduction bands of the studied material.
1. Experimental details
1. 1. Synthesis of C2H10N2(IO3)2.HIO3
The ethylenediammonium bis iodate mono-iodic acid [C2H10N2(IO3)2·HIO3]2 was obtained by neutralizing 20 ml of a diluted amine solution (1mmolL-1) with a stoichiometric volume of iodic acid solution (1mmolL-1).The chemical reaction of syntheses can be described by the following chemical equation:
C2H8N2 + 3 HIO3 C2H10N2 (IO3)2 .HIO3
1.2. Thermal analysis
Cyclic differential scanning calorimetry (DSC) analysis was applied to a mass sample of 5.12 mg of EBIMIA in the temperature domain 243-500K using PerkinElmer\Pyris DSC 4000 apparatus at a rate of cooling and heating of 5°C/min.
1. 3. XRD analyses
The X-ray powder diffraction (XRPD) measurement was performed at room temperature on a Bruker D8 X-ray diffractometer in the 2ϴ range from 5 to 60° with a scanning step width of 0.02°
at a rate time of 0.1 s/step.
The single-crystal X-ray data of EBIMIA were measured on a Bruker APEX II diffractometer with Mo-Kα radiation (λ = 0.71073 Å) equipped with an APEX2 CCD area detector [7]. Suitable crystal of the EBIMIA was scanned by w/2θ method in the θ range from 1.24 to 32.02°. The collected X- ray data were interpreted using SHELXT [8] software included in the WinGX package [9]. The crystallographic characterization on single crystal at room temperature shows that C2H10N2(IO3)2·HIO3 crystallizes in the monoclinic system with the cell parameters: a = 16.692(2) Å, b = 6.3922(9) Å, c = 21.927(3) Å, β = 101.178 (2)° and the unit cell of EBIMIA contains 8 formula units (Z = 8). The inspection of reflection intensity statistics and of systematic absences using the SHELXT software led to a centrosymmetric the P21/c space group (No. 14). Additional
4
analysis of these data using PLATON/ADDSYM software [10] shows a new pseudo symmetry P21/n. However, our choice settled on ‘P21/c’ as revealed by the statistical analysis. Moreover, the interpretation of the X-ray data using the ‘P21/c’ symmetry seems accurately enough, especially that the structure resolution displayed a satisfactory values of the reliabilities factors (Rint =0.059, R1 = 0.034, wR2 = 0.091 and S=1.04) which, clearly justify the choice of the proposed space group and prove the stability of the least-squares refinement. All atoms except the hydrogen atoms have been refined anisotropically. The positions of the hydrogen atoms of the (C2H10N2)2+ cation were generated geometrically from the ideal models and attached to the carbon and nitrogen atoms at distances of C-H: 0.97Å and N-H: 0.89Å. The experimental details of the XRD analysis are depicted in Table 1. The CIF file, including all crystal data of the EBIMIA crystal has been deposited at the Cambridge Crystallographic Data Centre with deposition number: (CCDC 1911972).
1.4. Spectroscopic Measurements
The IR and Raman vibrational spectra were measured using an ATR- Perkin-Elmer spectrometer and (LABRAM, HR800) spectrometer with He+ ion excitation radiation (λ=633 nm), respectively.
The UV-Visible absorption spectrum of the spin-coated films was deduced from direct transmission measurements undertaken on the UV–Vis spectrophotometer (HITACHI, U-3300).
The thin film is prepared by spin-coating technique using a solution of EBIMIA diluted in ethanol.
1.5. Computational details
After an initial overview of related works treating hybrid compounds [11], the DFT calculations were performed at B3PW91 [12] level, with the split valence 6-31G and 6-311G basis sets for hydrogen, carbon, oxygen and nitrogen atoms and LanlD2Z (ECP) for the iodine atoms using GAUSSIAN 09 program [13]. The [Kr] core electrons of iodine were replaced by an effective core potential and DZ quality Hay and Wadt Los Alamos ECP basis set (LANL2DZ) was used for the valence electrons [14]. These basis sets are expanded by diffuse and polarization functions [i.e. 6- 31+G*, 6-311+G* and LanLD2Z (d, p)] which are useful to describe properly the chemical bonds and long-range interactions (dispersion, hydrogen bonds, etc...). The initial structural parameters used for geometry optimization are taken from the XRD analysis. Optimized structural parameters are used in the vibrational frequency calculations at the DFT level to confirm the structure as
5
minima. The careful attribution of the FT-IR and Raman spectra are performed with the aid of the molecular visualization Gauss View 5.0 [15] and the potential energy distributions (PEDs) analysis (VEDA) [16] programs and then compared to the predicted wavenumbers computed by the DFT/B3PW91 method. None of the predicted vibrational motion has any imaginary frequency, implying that the optimized geometry is located at the local minimum point on the potential energy surface. To compare the computed geometrical parameters and frequencies with experimental results, Root mean square RMS were calculated using the following expression [17].
𝑅𝑀𝑆 = ∑ ( ) : Eq (1)
Where Xcal, Xexp and ‘n’ are the calculated, the experimental and the total number of data set, respectively.
Moreover, in numerous current quantum mechanical calculations vibrational spectra performed at different levels of approximation, calculated frequencies are, as a rule, higher than their experimental counter parts. This outcome is due to the more or less systematic overestimation of the force constants. This overestimation of the force constants commonly depends on the used basis set [18], consequently, these calculations will require an empirical corrections. To improve agreement with experiment, quantum mechanical force fields are corrected in one way or another, e.g. using empirical corrections called scale factors, which are estimated from the experimental vibrational spectra of small molecules with reliable frequency assignments. The calculated vibrational frequencies at the B3PW91 level of theory were scaled by a factor (K) equal to 0.965.
To determine the scale factor (K), we follow the method used by P.Merrik et al, [19] that minimize the residual separating experimental and calculated frequencies. The optimum scale factors for vibrational frequencies were determined by a least- squares procedure, minimizing the residual.
∆= ∑ 𝑘𝜗 − 𝜗 : Eq (2)
Where 𝜗 and 𝜗 are the ith theoretical harmonic frequency and the ith experimental fundamental frequency (in cm-1), respectively, which leads to:
𝑘 =∑
∑ : Eq (3)
6
Moreover, the calculations of excited state properties reported in this paper were performed using the DMOL3 program. The exchange correlation energy was calculated by Perdew Burke Ernzerhof (PBE) [20] variant of the generalized gradient approximation (GGA) [21] and all the electrons are included in the orbital basis set of double numerical plus polarization (DNP) [22]. We have used 1×2×1 k-point sampling of the Brillouin zone. The total energy of the system was converged in 5.04×10⁻⁶ Ha (Hartree) in the simulation experiments.
1.6. Electrical characterization
The powdered samples of EBIMIA were pressed at a pressure of 5MPa to prepare a pellet of 7 mm of diameter and 1 mm of thickness. A silver paste was applied into the two pellet surfaces and heated at 50 °C to reduce the surface roughness and ensure the better electrical contact with the electrodes. The electrical properties of the sample were studied by measuring the AC conductivity in the temperature and frequency range from 338 K to 413 K and from 100HZ to 1 MHZ respectively using a HP 4284A precision LCR meter.
The measured admittance of the studied compound is defined as follows:
𝑌 = 𝐺 + 𝑗𝜔𝐶 Eq (4)
where G, C and ω are respectively the conductance, the susceptance (Siemens) and the angular frequency respectively. The other electrical characteristics are deduced using the following expressions:
𝜎 (𝜔, 𝑇) = . 𝐺 Eq (5) 𝜎 (𝜔, 𝑇) = . 𝜔𝐶 Eq (6)
𝑍 = Eq(7)
−𝑍" = Eq(8)
where σ’(ω,T), σ” (ω,T), Z’ and Z” represent the real and the imaginary parts of the total conductance and impedance, respectively, and the ‘t/s’ represents the geometrical ratio of the thickness and the cross area of the pellet sample, respectively.
2. Result and discussion 2.1 XRPD analysis
7
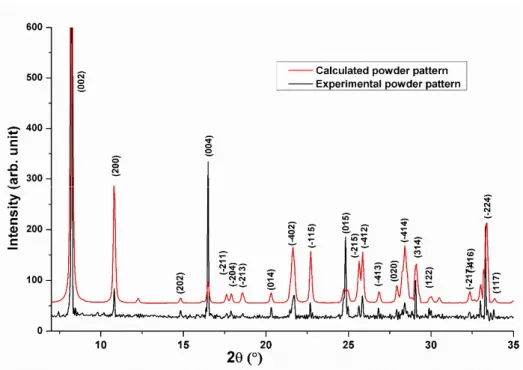
The synthesized sample was crushed into a fine powder and analyzed using XRD diffraction to ensure about the novelty and the good crystallinity of the present iodate salt. The diffraction pattern was indexed using DICVOL04 [23] program and the precise lattice parameters were determined using the CELREF software [24], which employs a least-squares refinement of the unit cell dimensions. Later, the experimental spectra shown in Fig.1 was compared to the calculated one using the data obtained from the single-crystal X-ray diffraction analysis. The two DRX patterns are in good agreement, which indicates the purity of the obtained material. The refinement of the cell parameters and the regeneration of the inter-reticular distances dhkl are depicted in Tables S1- 2.
2.2. Structure description
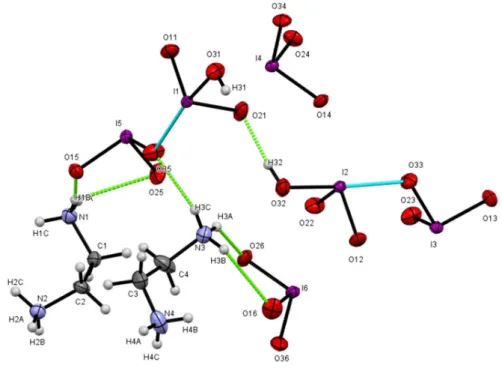
The asymmetric unit of EBIMIA shown in Fig.2 contains four iodate groups, two doubly protonated ethylènediammonium cations having an eclipsed configuration and two neutral iodic acid molecules, therefore, this compound has the following stoichiometric formula [C2H10N2(IO3)2.HIO3]2. However, the two short bonds I(1)-O(35) [2.477(3) Å] and I(2)-O(33) [2.346(3)] can be considered as intermediate between the first [1.779(3)-1.925(3)Å] and the second coordination sphere [2.564(3) -2.890(3) Å] of iodine atoms [25]. In such conditions, each of the three iodine atoms completes its coordination sphere on the lone electron pair ‘LEP’ side by secondary I ··· O interactions whose lengths are less than the sum of Van der Waals radius (3.55Å).
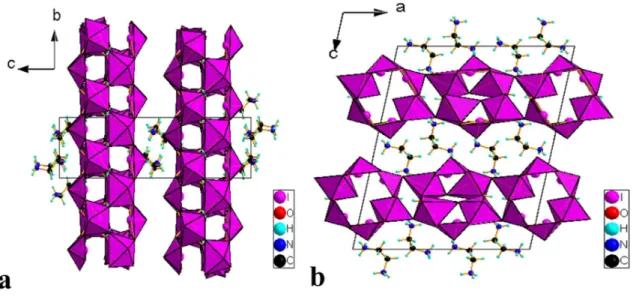
Under these conditions, the two combinations HI(1)O3.I(5)O3 and HI(2)O3.I(3)O3 can be considered as two complex anions (I2O5OH)-. Thus, the EBIMIA crystal can also be described by the following chemical formula (C2H10N2)2(IO3)2 (HI2O5)2. By taking into account all the vicinal oxygens to the iodine atoms; I(1), I(2) and I(6) and I(3), I(4) and I(5) acquire octahedral and pyramidal distorted geometry, respectively. The O-I-O angles of these polyhedra range from 92.5(2)° to 100.6 (1)°. The main geometric characteristics of iodine polyhedra are given in Table S3. The IO5 and IO6 polyhedra are associated with each other, sharing vertices to build up layers parallel to the (ab) plane as shown in Fig. 3. The (C2H8N2)2+ cations are housed between the anionic layers and establish weak N-H ... O hydrogen bridges with the oxygen atoms of (IO3)- and HIO3
entities which contribute to the cohesion and the strengthening of the three dimension crystal network. The geometrical parameters including distances and angles of the EDA2+ cationic and
8
hydrogen bands depicted in Tables S4-5, respectively are comparable to those reported in similar iodate salts [5, 6, 23, 24].
2.3.Hirschfeld analysis
The Hirschfeld surfaces and the two-dimensional fingerprint plots shown in Fig. S1 are used to analyze the intermolecular interactions [28] in the new iodate salt structure. These analyses reveal that hydrogen bands O…H and I…O halogen interactions in EBIMIA outnumber the other contacts in this structure with a contribution of 57.7% and 21.0% respectively. Besides, it is clear from these data that the N—H…O hydrogen bonds and the I—O…I halogen bonds appearing as large red spots on the Hirschfeld surface maps, are the most prominent interactions. Also, the O…O contacts in structure (I) are about 13.8%, whereas I…H give a negligible contribution to the total interactions in the molecular system.
2.4. Analysis of frontier molecular orbitals (FMOs) and molecular electrostatic potential (MESP)
The molecular electrostatic potential surface (MESP) shown in Fig. S2 provides a visual method to understand the relative polarity of the molecule [29]. Electrostatic potential maps illustrate the charge distributions of molecules three dimensionally. One of the purposes of finding the electrostatic potential is to find the reactive site of a molecule. The color-coded values are then projected onto the 0.002 a.u isodensity surface to produce a three-dimensional electrostatic potential model. Local negative electrostatic potentials (red) signals appear on oxygen atoms of iodate and iodic acid groups with lone pairs whereas, green areas cover the rest of the molecular entities (.i.e., I, C, N and H atoms) where electrostatic potentials are close to zero. Moreover, the surfaces for the frontier orbital HOMOs and the LUMOs named as FMOs were drawn and shown in Fig. S3. From this Figure, it is clear that the HOMO and LUMO are both localized on oxygen and iodine atoms of (IO3)- anions and HIO3 molecules, whereas, the only little delocalization of HOMO is shown on the nitrogen atom of EDA2+. The MESP and FMO analysis indicate without doubt that iodine, oxygen and nitrogen atoms are the most reactive sites in the EBIMIA crystal.
These results are in good agreements with the structural analysis, which indicates that, I…O and O…H-N interactions have the major contribution to the stability and the cohesion of the crystal structure of EBIMIA.
9 2.5. Geometry optimization
The DFT calculations results normally complement the information obtained by chemical experiments. These approaches are not only providing deeper understanding of molecular and crystal structures, but also are widely used to study many several properties such as vibrational frequencies, reactivity and other spectroscopic quantities. We tried in this section to discuss in details the geometric and the vibrational characteristics of the EBIMIA crystal.
In this section, we choose to compute only the moiety of the asymmetric unit of EBIMIA (.
i.e. one (C2H10N2)2+ cation, two (IO3)- anions, one HIO3 molecule) due to the computational cost, assuming that these molecules are sufficient to represent the entire molecular system. We tried to take into account the hydrogen bonds and the crystal packing effects during these calculations by fixing the position of the vicinal molecules to the asymmetric unit. The adopted DFT approach seems adequate for these calculations because the standard density-functionals DFT/B3PW91 developed for covalent systems are largely successful in treating hydrogen bonding and other electrostatically dominated noncovalent interactions that act over similarly short length scales (<2 Å) [30, 31]. By increasing basis set size like the triple-ζ 6-311G the systematic error in these calculations should be small enough, so, we do not need to apply the Counterpoise corrections neither dispersion or basis set superposition error (BSSE). The Table S6 reported the calculated bond lengths and internal angle with the RMS errors using DFT/B3PW91 associated to the double- ζ 6-31G and triple-ζ 6-311G basis sets. As one can see, the computed geometrical parameters of EBIMIA are satisfactory reproduced. In fact, the initial eclipsed configuration of [C2H10N2]2+
cation and the pyramidal geometry of iodate and acidic molecules have been preserved. The RMS errors of the bond lengths and internal angles are about 0.03Å and 5.61° respectively. From these data, one can see that there is a good agreement between calculated and experimental band length, however, the computed angles show small discrepancies compared to the real structure. It is clear from these data that both computed geometries show big similarities to the experimental structure, especially, that computed using triple ζ 6-311G basis set as revealed by the closest torsion angle for the EDA2+ cation. The best optimized geometry of EBIMIA shown in Fig. S4 is used to predict the vibrational frequencies. The mean square error R2 of linear correlation plotted in Fig. S5, between experimental and theoretical bond lengths and internal angles are 0.978 and 0.746 respectively.
10
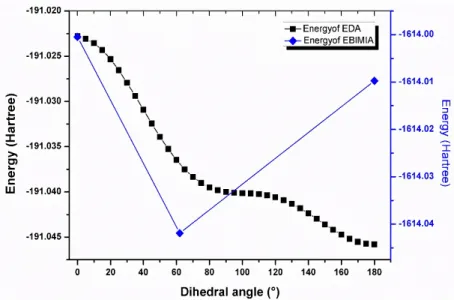
In order to gain more information about the interaction between the EDA2+ cations and the inorganic entities, the conformational analysis of the ethylenediammine cation were carried out in order to find out the energetically and thermodynamically most stable configuration. The potential energy barrier of EDA2+ of the three different conformers, (the trans, the eclipsed and the cis configuration) obtained by the rotation of the ammonium group with the dihedral angle N(13)- C(1)-C(4)-N(14), is depicted in Fig. 4. As we can see, the trans-configuration of EDA2+, which has the lower energy, is the most stable conformer. This result is in good agreement with previous studies of ethylenediammonium iodate salts [5, 6]. However, the minima of energy in the current compound as shown in Fig. S4 corresponds to the eclipsed conformer of EDA2+. This result reveals that the hydrogen bands N-H….O-I overcome the other interactions and have a decisive contribution to the stability and the cohesion of the EBIMIA's crystal.
2.6. Vibrational study
The vibrational frequencies of EBIMIA are performed based on the optimized geometry. Each component of C2H10N2(IO3)2·HIO3 exhibits (3N-6) motions contributing to a total number of 57 frequencies. A scale factor of 0.965 is applied to the computed wavenumber in order to compensate the systematic errors caused by the approximate nature of the basis set describing the electronic structure. The RMS errors of the experimental IR and Raman bands are 4.2 and 3.8 cm-1 respectively, which reveal a good agreement between the experimental and calculated vibrational modes. For more accuracy in the RMS calculations, we have accounted only the frequencies characteristic to the studied compound appeared in the fingerprint region ≤ 1600 cm-1. Detailed assignment of observed and calculated wavenumbers is reported in Table 2. The experimental and computed vibrational spectra are shown in Fig. 5.
2.6.1. Vibrations Assignment
2.6.1.1.The iodate (IO3)-internal modes vibrations
The iodate anion (IO3)− has C3v symmetry, so it has six vibrational modes; three I–O stretching vibrations (one symmetric ν1 and the two asymmetric ν3 modes) and three bending O–I–O deformations (the symmetric ν2 and the two asymmetric ν4 binding modes). The asymmetric and symmetrical stretching vibrations ν3 and ν1 of the iodate (IO3)- for the EBIMIA compound appear in the IR and in Raman at 779-734 cm-1 and at 673-593 cm-1 respectively as intense bands with
11
PED≥52%. The symmetric and asymmetric deformations ν2 and ν4 of the angles (O-I-O) appear as weak and medium IR bands and Raman peaks at 414-388 cm-1 and at 330-286 cm-1 with PED≥
32%. This assignment is in good agreement with previous studies of homologous compounds [5, 6, 26] as well as predicted wavenumbers.
2.6.1.2. The HIO3 internal modes vibrations
The HIO3 molecule defined as IO2-O’H has a Cs symmetry, which contribute to nine vibrational modes. Assuming the OH group as a single point mass (X), it can be described by a simple nonlinear triatomic (N = 3) molecule of Cs point group symmetry. Three O-H group vibrations, [i.e. O-H stretching (υ), O-H angle bending (δ), and O-H deformation (γ)] are part of the nine fundamental vibrations in HIO3 molecule. The three (I-O) stretching vibrations [two symmetric (υ’1, υ’2) and one asymmetric υ5 modes] and the three (O-I-O) bending modes (two symmetric (υ’3, υ’4) and one asymmetric υ6 mode) define its other six vibrational modes. The weak and broad IR band observed at 3225 cm-1 is attributed to O-H stretching vibrations with PED = 99%. The IR band and the Raman peak observed around 1111 cm-1 correspond to the in-plane symmetrical deformation δOH with PED = 43%. The broad IR band and the weak Raman line appearing at 816 cm-1 are attributed to the out-of-plane asymmetric deformation γ OH with PED = 39%. The intense IR and Raman bands observed at 711 cm-1 were attributed to asymmetric stretching vibrations ν5
with PED = 75%. The symmetric stretching vibrations ν'2 appear in IR and Raman at 696 cm-1 and at 702 cm-1 respectively with PED = 71%. The strong IR band and the medium intensity Raman peak observed at 580 cm-1 and 585 cm-1, respectively, were attributed to ν'1 stretching vibrations with PED = 69%. The above assignments agree well with the literature [5, 31] and show that these frequencies appear as pure stretching vibrations as revealed by the high PED value. Finally, the two symmetrical deformation vibrations ν'3 and ν'4 appear in Raman at 385 cm-1 and at 358 cm-1 with PED = 38% and PED = 42% respectively, while, the asymmetric deformation vibration υ6 is observed in Raman at 264 cm-1 with PED=27%.
2.6.1.3. (C2H10N2)2+ vibrations
The isolated ethylenediammonium cation (EDA)2+ has 36 fundamental vibrations, which are distributed as follows: {6 vibration modes related to each methylene group [vas (CH2), vs (CH2), δsci (CH2), ρ (CH2), δw (CH2), δt (CH2)]; 9 vibration modes related to each NH3 group [2 vas (NH3)+,
12
vs (NH3)+, 2 δas (NH3)+, δs (NH3)+, 2 ρ (NH3)+ 1τ (NH3) ] and 6 vibration modes of the NCCN skeleton [2 ν (NC), 1ν (CC), 2 δ (NCC), 1τ (CC)]}, [6]
Skeletal Vibration (NCCN)
The C-C and C-N stretching vibrations usually appear in the region from 1300 to 1000 cm−1. These modes are usually overlapped because carbon and nitrogen atoms have similar weights and bonds force constant. However, we try to carry out the following attributions based on computed vibrational spectra and previous studies of similar aliphatic organic cations [33]: the FT-IR and Raman signals appeared around 1051 cm-1 are assigned to the ν (C-C) stretching vibrations. The DFT calculation predicts this mode at 1047 cm-1with PED= 76%. The asymmetric νas (N-C) and the symmetric νs (N-C) stretching vibration modes appear in FT-IR and in Raman around 1038 cm-1 and 1003 cm-1 respectively. The DFT calculation predicts these two modes at 1031 cm-1 and at 995 cm-1 with PED= 63% and 68% respectively. The symmetric δs (NCC) and asymmetric δas
(NCC) bending modes appear in FT-IR and Raman around 431 cm-1 and 419 cm-1 respectively.
The DFT calculations compute the δs (NCC) and δas (NCC) modes respectively at 436 cm-1 with PED =32% and at 423 cm-1 with PED=27%. Finally, the torsion mode τ (CC) appears in Raman at 264 cm-1 with PED= 27%.
Vibrations of (NH3)+ group
The N-H stretching vibrations generally occur around 3400 cm-1. However, the extensive association due to hydrogen bridges established between amino groups and neighboring iodate anions generally gives rise to very broad infrared bands and decrease the wave number to lower frequencies; a shift up to ≈2,500 cm-1 is observed for similar hybrid compounds [26, 34]. The complex and very broad band observed in the IR spectrum at 2400-3300 cm-1 due probably to the overlap of the CH2, OH and NH3 stretching vibrations is deconvoluted into Gaussian curves. Based on the presumed and calculated wavenumbers, iterative calculations give the band positions that correspond to the best fit between the IR spectrum and the sum of calculated bands. Therefore, curves obtained from the decomposed broad IR band at 3134, 2818, 2775 and 2753 cm-1 and those appeared at 2624 and 2577 cm-1 are attributed to the asymmetric νas(NH3)+ and symmetric νs(NH3)+ stretching vibrations, respectively. The corresponding theoretical νas(NH3)+ and νs(NH3)+ scaled frequencies are calculated at 3216, 2861, 2847 and 2809 cm-1 with 92≤ PED ≤ 98% and at 2792
13
and 2786 cm-1 with 89 ≤ PED ≤ 95 cm-1, respectively. The comparison between the observed and calculated wavenumbers show a small discrepancy, which comes most likely from the approximation nature of the of the quantum mechanical methods. The asymmetric δas (NH3) and symmetrical δs (NH3) deformation vibrations for the EDA2+ cation are observed at 1602–1514 cm−1 and at 1496–1488 cm−1, respectively. These wavenumbers are in agreement with the theoretical frequencies calculated at 1609, 1572, 1560, 1518, 1494 and 1490 cm-1, with PED ≥51%.
The rocking-type deformation vibrations, ρ (NH3), often interfere with methylene deformation vibrations and the skeletal stretching modes of the EDA2+ cation as revealed by the low values of PED ≤ 41%. These bands appear in FT-IR spectrum at 1232 cm-1, 1178 cm-1, 1063 cm-1 and at 848 cm-1. Finally, the two frequencies observed in IR and Raman around 483 and 477 cm-1and those calculated at 490 and at 475 cm-1 with 11≤PED ≤ 27% correspond to the torsion τ (NH3) modes.
These attributions are in good agreement with previous studies [5, 6] as well as calculated frequencies.
Vibration of -CH2- group
By comparison with similar compounds containing vicinal CH2 groups [35] , the asymmetric stretching υas CH2 vibrations are generally observed in the region 3100-3000 cm-1, while the symmetric stretching υs CH2 will appear between 3060 and 2855 cm-1. In addition, it is expected that the scissoring vibration δsci CH2 of the methylene group of aliphatic hydrocarbons occurs between 1500 and 1350 cm-1 while wagging δwCH2 occurs generally between 1400 and 1100 cm-
1, the twisting δtCH2 vibration are expected to appear at 1260-1030 cm-1 and the rocking deformation δrCH2 occurs at 1180-750 cm-1. In accordance with the above statements, the asymmetric υasCH2 stretching mode are observed in IR at 3058 and at 3010 cm-1, while the symmetric υsCH2 stretching mode are observed at 2961 and at 2880 cm-1. These attributions are in line with calculated frequencies at 3041, 2921, 2907 and at 2883 cm-1 with PED ≥ 79%. IR and Raman intensities appeared at 1470 and around 1454 cm-1 are assigned to the CH2 scissoring vibrations with 57 ≤ PED≤61%, while those occurred around 1411 and 1342 cm-1 with 41 ≤ PED≤43% are assigned to CH2 wagging vibrations. The CH2 twisting modes are shifted to a higher frequency range and they appear in the IR spectrum at 1333 and 1314 cm-1 with 39≤ PED≤42%.
Finally, the rocking vibrations of the CH2 appear in IR and Raman around 837 and 783 cm-1 with 31≤ PED≤36 seemed to mix with γOH vibrations.
14
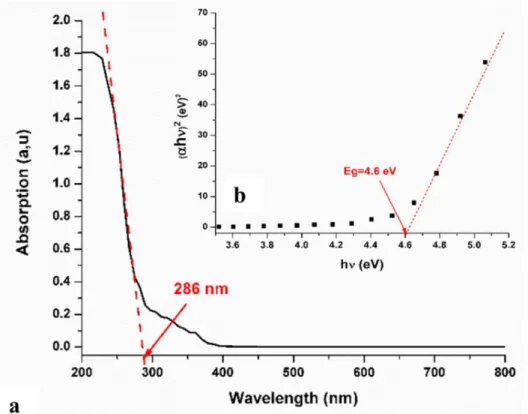
2.7. UV-visible, density of state and Frontier molecular orbitals study 2.7.1. UV-Visible spectroscopy
In this study, the optical spectrum of EBIMIA shown in Fig. 6 was recorded on deposit thin film using a well dispersed solution of the EBIMIA in ethanol, in the range 200–800 nm. The cutoff of the absorption band illustrated by the UV-Visible spectrum is 286 nm. The optical band gap of the film was estimated using the Tauc relation which has the following equation [36]:
𝛼ℎ𝜗 = 𝐴 ℎ𝜗 − 𝐸 Eq(9)
where h, ν and Eg are the Plank’s constant, photon frequency and energy band gap, respectively,
“A” is an energy-independent constant and the exponent ‘n’ characterizes the optical absorption process. Considering n = 0.5 in the above equation, the value of the optical band gap of a direct transition was evaluated to be 4.6 eV. Similar band gap energies are observed for analogous iodate salts [5, 6, 26, 27]. The frontier orbital energy gaps (ELUMO-EHOMO) between the HOMO and LUMO orbitals shown in Fig.S3 was 4.52 eV. As one can see, there is a good agreement between the fundamental and optical band gap energies, contrary to the expected discrepancy of ≈1eV that was observed for previous studied iodate salts [5, 26].
2.7.2. Band structure and density of state (DOS) spectrum
In this section, the DFT study was undertaken overall the crystal lattice using the generalized gradient common approximation (GGA), this approximation is a computationally less demanding scheme, less expansive in calculation time and allow us to perform calculation on big periodic system [37]. The electronic analysis of the crystal structure was carried out using standard band theory and total/partial density of state calculation. Fig. S7 (a) shows the band structure of EBIMIA calculated using the primitive cell and Brillouin zone [38] described in Fig.S6. The labeled k- points corresponding to high symmetry points of the first Brillouin zone are Z(0,0,1/2); G(0,0,0);
Y(0,1/2,0), A(-1/2,1/2,0); B(-1/2,0,0); D(-1/2,0,1/2); E(-1/2,1/2,1/2) and C(0,1/2,1/2). The conduction-band minimum and the valence band maximum are both located on the Z-G and B-D lines. Consequently, the fundamental band gap, which is direct, has a magnitude of 3.587 eV. The deviation of the current value from both experimental and calculated band gaps using B3PW91/DFT method, which is about 1 eV may be due to the well-known band gap
15
underestimation of PBE-GGA/DFT compared to hybrid DFT [39]. The electronic state distribution in both valence and conduction bands can be characterized with the PDOS shown in Fig. S7 (b).
The p-state of I, O and N atoms have the major contribution to the conduction band, while only the p-state of the N atom have the greatest contribution to the valence band.
2.8. Thermal and dielectric study 2.8.1. DSC analysis
Thermal Analysis, particularly differential scanning calorimetry (DSC), is widely used because of the unique set of qualities that offers. It is highly relevant in order to examine the originality and stability of the compound, as transitions or melting point. The cyclic DSC analysis of EBIMIA given in Fig.7 shows two peaks: the first endothermic peak appears in both the heating and the cooling curves around 287 K corresponds to a first-order reversible phase transition. The second peak observed only during the cooling at 365K, corresponds to an irreversible phase transition.
The enthalpies of these two transitions are ΔH = 1.2474 (J / g) and ΔH = 1.7429 (J / g), respectively.
The degradation of this compound gives rise to an exothermic peak at 438 K with ΔH = -506.3801 (J / g) to release I2, O2 molecules and a black residue of carbon. Previous studied iodate salts show similar thermal behavior above room temperature [6, 27] (.i.e., structural phase transitions, decomposition,) however, the EBIMIA is the unique compound which exhibits a reversible phase transition nearby the ambient temperature.
2.8.2. Dielectric study
The dielectric characterization of iodate salts has received considerable scientific interest due to the enormous applications of these materials as proton conductors [40] and as electrolytes for fuel cells and supercapacitors [41]. In this section detailed studies of dielectric properties of the proposed compound as a function of frequency and temperature have been discussed, which may provide information regarding the charge transfer properties, the electric conduction and the structural phase transitions.
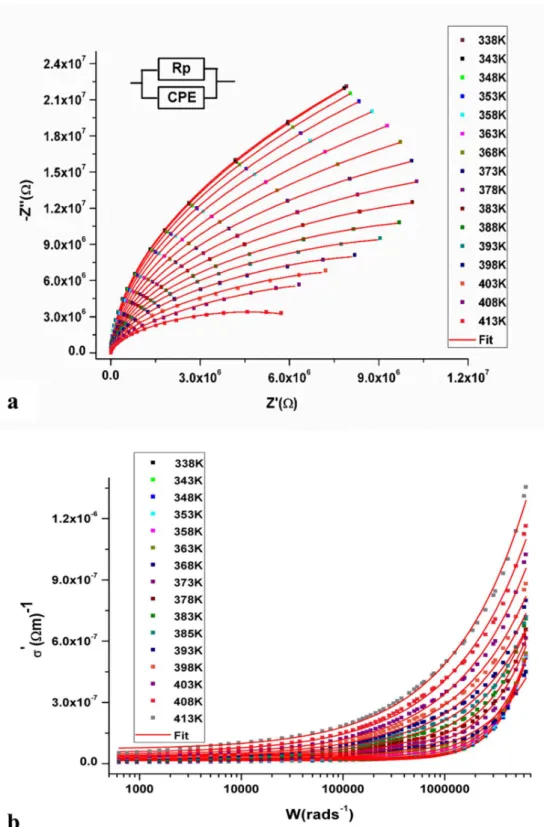
2.8.2.1. Impedance analysis
The Nyquist diagram representing the variation of the imaginary component -Z" as a function of the real part Z' of the impedance at different temperatures is shown in Fig. 8 (a). These curves have
16
the shape of a semicircle whose center is located below the real axis; such behavior is consistent with the Cole-Cole model. Moreover, the rays of the semicircles decrease when temperature increasing which corresponds to a decrease of the intergranular resistance Rp and consequently the increase of the electrical conductance in this compound. In order to better describe the electrical behavior of the material, the experimental curves -Z "= f (Z ') are fitted to an equivalent electrical circuit model which consists of a parallel combination of a resistance Rp and a fractal capacitance CPE. The CPE element is introduced in order to compensate for certain imperfections such as the roughness of the electrode surfaces and the non-uniformity of the charge carrier distribution.
The real and imaginary components of the whole impedance of this circuit were calculated according the following expressions [42]:
𝑍 = ( ( ⁄ ))
( ( ⁄ )) ( ( ⁄ )) Eq(10)
−𝑍 = ⁄ )
( ( ⁄ )) ( ( ⁄ )) Eq(11)
The iterative nonlinear least-squares fits of -Z’’=f (Z’) by means of Eqs (10-11) are both represented in Fig.8(a) (red line) and they are in better agreement with the experiments. This result proves the adequacy of the chosen equivalent circuit Model. The thermal variation of fitted parameters (RP, Q, α) for EBIMIA summarized in Table 3 are comparable to those observed in similar iodate salts [5, 27]. Based on these results, we can observe that the resistance Rp decreases when the temperature increases, which illustrates the high temperature conductivity of this materials. Moreover, the σDC is around Picofarad (1pF = 10-12F) which confirms the intra-granular behavior of the electrical conduction mechanism. Finally, the variation of α parameter from 0.814 to 0.983 confirms the capacitive nature of the ZCPE impedances and therefore the dipole interactions within this material cannot be ignored.
2.8.2.2. Conductivity study
The dependence of electrical conductivity as a function of frequency for solid electrolytes can generally be described by a frequency-independent component σDC that represents the DC conductivity and a frequency-dependent component. Indeed, in the low-frequency domain, the conductivity (σDC) remains constant, whereas in the high-frequency domain the conductivity
17
increases with frequency according to the Jonscher power law which has the following expression [43]:
𝜎 (𝜔, 𝑇) = 𝜎 (𝑇) + 𝐴(𝑇)𝜔 ( ) Eq (12)
where σDC is the DC conductivity, A (T) is the pre-exponential factor, ω is the angular frequency, and S (T) is a dimensionless exponent with value lies between 0 to 1 [44].
The frequency dependence of the real part of the conductivity σ'T (ω, T) at different temperatures shown in Fig. 8 (b) are fitted using Eq (12). The values of the fitted parameters σDC, A (T) and S (T) deduced from the universal law of Jonscher are reported in Table 4. These data reveal that the conductivity of the EBIMIA is particularly lower than that of similar iodate salts, which is about 10-5 S cm-1 especially in the high temperature phases [5, 27]. The temperature dependence the exponent S(T) displayed in Fig.9 (b), shows that S(T) decreases progressively from 0.978 to 0.582 as the temperature increases and changes the slope around 378K which corresponds to the structural phase transition. Such behavior which corresponds to a proton hopping mechanism [40]
is similar to those reported in previous studied iodate salts [5, 6]. Indeed, the conduction of charge carriers in this material can be interpreted using the CBH model (correlated barrier hopping). This model suggests that the charge carriers jump over a potential barrier separating two sites of a distance ‘R’ to move from one well to another, the height of the potential barrier is reduced by the Coulomb attraction. According to this model the temperature variation of S (T) is described by the following equation [45]:
𝑆(𝑇) = 1 − . Eq(13)
where ωM represents the height of the potential barrier that should be overcome by the charges located in the localized sites.
The bulk conduction σp of the synthesized materials was calculated using the following expression:
𝜎 = . Eq (14)
where e and s represent the thickness and the surface of the electrode respectively, and Rp is the bulk resistance of the material.
18
The logarithmic variations of the bulk conduction σp and of direct current σDC as a function of the inverse of the absolute temperature (1000 / T) for the EBIMIA compound are shown in Fig. 9 (a).
The variation of Ln σp and Ln σDC in the studied temperature range follows the Arrhenius Law which has the following expression [45]:
𝜎 × 𝑇 = 𝜎 exp (−
. ) Eq(15)
where σo: pre-exponential factor, Ea: charge carrier activation energy, kB: the Boltzmann constant, T: absolute temperature in K.
The activation energies Ea and pre-exponential factors σo determined from these curves are reported in Table 5. As one can see, both σDC and σp increase with temperature increasing, indicating a decrease of the resistance of EBIMIA at high temperature. A slope break is observed around 378K, which confirms the phase transition already detected by the DSC analysis. The near values of activation energies obtained from the conductivity and impedance measurements affirmed that the electrical conductivity in the EBITIA might be due to the ion hopping mechanism [46].
Conclusion
The interaction of the ethylénediammine with iodic acid in aqueous medium gives rise to a novel iodate salt C2H10N2(IO3)2.HIO3 denoted as EBIMIA, which is the fourth compound obtained during the investigation of the EDA-HIO3-H2O system. Despite a number of apparent similarities with previous studies, the present research confirms previous findings and contributes additional exploration in order to better understand the structure and further study the physicochemical properties of this kind of materials. For such purpose, a rapid X-ray powder diffraction (XRD) analysis is undertaken for the phase identification. The comparison of the recorded powder pattern to that of recently studied iodate salts proves the novelty of the present compound and the purity of the synthesized material. Moreover, the Single crystal XRD analysis shows that EBIMIA crystallizes in the monoclinic system having P21/c symmetry. This crystal has a layered anionic network of iodate anions and iodic acid molecules linked together via I-O…I halogens bonds. It found that the iodine atoms kept their ordinary octahedral IO6 and pentahedral IO5 coordination, however, the shortest I…O weak interaction was 2.346(3)Å which is clearly smaller than those observed for similar iodate salts [5]. Moreover, the EDA2+ cation in the present compound exhibits an eclipsed configuration and was linked to the anionic network via weak and strong N-H…O
19
hydrogen bonds. In contrast to the previous studies, the eclipsed conformer, which does not theoretically correspond to the most stable configuration of the organic cation EDA 2+, contributes to the lowest energy of the molecular set in the EBIMIA crystal. This directly implies that N-H…O hydrogen bridges and I…O interactions play a decisive role in the stability and the cohesion of this compound as revealed by the Hirschfeld and Molecular electrostatic potential (MESP) analysis. Besides, the computed molecular geometry, vibrational spectra and the optical band gap of EBIMIA using DFT/B3PW91 method show a good agreement with the experiments.
Furthermore, the band structure and the density of state spectrum (DOS) are calculated using the GGA/PBE DFT functional. The obtained results reinforce the facts evince by the frontier orbital results which confirm that the HOMO and LUMO of this material have significant contribution of electron density on the oxygen and iodine atoms of (IO3)- and HIO3 molecules, but the HOMO orbital arises on EDA2+ cation and resides over the nitrogen atoms with small contributions. Thus, the excitation within the range of energy of about 4.5 eV causes the transfer of electrons. Finally, DSC measurement showed that EBIMIA undergoes two structural phase transitions. However, only the second transition occurred at 378K was confirmed by the complex impedance spectroscopy (CIS) since the first transition lies out of the studied temperature domain.
Acknowledgement
The authors are grateful to Pr. Giovani Predieri, Pr. Pier Paolo Lottici, and Pr. Danilo Bersani, for their help with the vibrational measurement. Moreover, authors wish to thank, Pr. Salvatore Vantaggio and Dr. Silvio Scaravonati for their contribution in carrying out the impedance spectroscopy measurements. The authors acknowledge also the Analytical Chemistry, Cultural Heritage, Inorganic Chemistry and Crystallography Unit (SCVSA department, university of Parma, Italy) and the Tunisian Ministry of Higher Education and Scientific Research (LR11ES46) for their support.
20 Figures
Fig. 1. Experimental and calculated RDX powder pattern of EBIMIA.
Fig. 2. The asymmetric unit of EBIMIA.
21
Fig. 3. Projection along a axis (a) and b axis (b) of the atomic arrangement in EBIMIA crystal, respectively.
Fig. 4. Variation of the potential energy surface of EDA2+ and EBIMIA as function of the dihedral angle.
22
Fig. 5. Experimental and calculated IR (a) and Raman (b) spectra of EBIMIA.
23
Fig. 6. The absorbance spectra (a) and the Tauc plots (b) of EBIMIA.
Fig.7. Cyclic DSC analysis of EBIMIA
24
Fig. 8. Nyquist diagrams (a) and the frequency dependence of σ’(ω, T) (b) of EBIMIA at different temperatures.
25
Fig. 9. Temperature dependence of Ln (σp.T) and Ln (σDC.T) (a) and S(T) (b) of EBIMIA.
References
[1] D. Braga, F. Grepioni, L. Maini, The growing world of crystal forms, Chem. Commun. 46
26 (2010) 6232–6242. doi:10.1039/c0cc01195a.
[2] E. Kovalska, C. Kocabas, Organic electrolytes for graphene-based supercapacitor: Liquid, gel or solid, Mater. Today Commun. 7 (2016) 155–160.
doi:10.1016/j.mtcomm.2016.04.013.
[3] G.A. Puchkovskaya, Y.A. Tarnavski, Phase transitions in the proton conductor NH4IO3 center dot 2HIO(3), J. Mol. Struct. 403 (1997) 137–142. doi:10.1016/S0022-
2860(96)09391-X.
[4] E.T. Keve, S.C. Abrahams, J.L. Bernstein, Pyroelectric ammonium iodate, a potential ferroelastic: Crystal structure, J. Chem. Phys. 54 (1971) 2556–2563.
doi:10.1063/1.1675212.
[5] M.A. Ben Abdallah, A. Bacchi, A. Parisini, P.P. Mazzeo, F. Terenziani, L. Marchiò, S.
Kamoun, Structure, vibrational, electrical and optical study of [C2H10N2] (IO3)2·4HIO3, J. Mol. Struct. 1179 (2019) 18–32. doi:10.1016/J.MOLSTRUC.2018.10.098.
[6] M.A. Ben Abdallah, A. Bacchi, A. Parisini, S. Canossa, P.P. Mazzeo, L. Bergamonti, S.
Kamoun, X-ray, optical, vibrational, electrical, and DFT study of the polymorphic structure of ethylenediammonium bis iodate α-C2H10N2(IO3)2 and β-C2H10N2(IO3)2, Struct. Chem. 30 (2019) 1911–1928. doi:10.1007/s11224-019-01317-w.
[7] Bruker AXS Inc. (2014) APEX2 suite for crystallographic software—single crystal X-ray diffraction
[8] G.M. Sheldrick, SHELXT - Integrated space-group and crystal-structure determination, Acta Crystallogr. Sect. A Found. Crystallogr. 71 (2015) 3–8.
doi:10.1107/S2053273314026370.
[9] L.J. Farrugia, WinGX and ORTEP for Windows: An update, J. Appl. Crystallogr. 45 (2012) 849–854. doi:10.1107/S0021889812029111.
[10] A.L. Spek, Structure validation in chemical crystallography, Acta Crystallogr. Sect. D Biol. Crystallogr. 65 (2009) 148–155. doi:10.1107/S090744490804362X.
27
[11] F.B. Dergisi, K. Sayin, D. Karakaş, Cumhuriyet Üniversitesi Fen Fakültesi Method and basis set investigation for trans-platinum(II) oxime complex, Cumhur. Univ. Fac. Sci. Sci.
J. 36 (2015). http://dergi.cumhuriyet.edu.tr/ojs/index.php/fenbilimleri (accessed March 8, 2020).
[12] P.C. Redfern, J.P. Blaudeau, L.A. Curtiss, Assessment of modified gaussian-2 (G2) and density functional theories for molecules containing third-row atoms Ga-Kr, J. Phys.
Chem. A. 101 (1997) 8701–8705. doi:10.1021/jp971491l.
[13] M.J.. Frisch, G.W.. Trucks, H.B.. Schlegel, G.E.. Scuseria, M.A.. Robb, J.R.. Cheeseman, G.. Scalmani, V.. Barone, B.. Mennucci, G.A.. Petersson, H.. Nakatsuji, M.. Caricato, X..
Li, H.P.. Hratchian, A.F.. Izmaylov, J.. Bloino, G.. Zheng, J.L.. Sonnenberg, M.. Hada, M.. Ehara, K.. Toyota, R.. Fukuda, J.. Hasegawa, M.. Ishida, T.. Nakajima, Y.. Honda, O..
Kitao, H.. Nakai, T.. Vreven, J.. Montgomery, J. A., J.E.. Peralta, F.. Ogliaro, M..
Bearpark, J.J.. Heyd, E.. Brothers, K.N.. Kudin, V.N.. Staroverov, R.. Kobayashi, J..
Normand, K.. Raghavachari, A.. Rendell, J.C.. Burant, S.S.. Iyengar, J.. Tomasi, M..
Cossi, N.. Rega, J.M.. Millam, M.. Klene, J.E.. Knox, J.B.. Cross, V.. Bakken, C.. Adamo, J.. Jaramillo, R.. Gomperts, R.E.. Stratmann, O.. Yazyev, A.J.. Austin, R.. Cammi, C..
Pomelli, J.W.. Ochterski, R.L.. Martin, K.. Morokuma, V.G.. Zakrzewski, G.A.. Voth, P..
Salvador, J.J.. Dannenberg, S.. Dapprich, A.D.. Daniels, Ö.. Farkas, J.B.. Foresman, J.V..
Ortiz, J.. Cioslowski, D.J. Fox, Gaussian 09 Citation | Gaussian.com, Gaussian, Inc., Wallingford CT,. (2009). https://gaussian.com/g09citation/ (accessed December 18, 2019).
[14] P.J. Hay, W.R. Wadt, Ab initio effective core potentials for molecular calculations.
Potentials for K to Au including the outermost core orbitale, J. Chem. Phys. 82 (1985) 299–310. doi:10.1063/1.448975.
[15] and F.W. E. D. Glendening, A. E. Reed, J. E. Carpenter, Citation | Gaussian.com, (n.d.).
https://gaussian.com/citation/ (accessed December 18, 2019).
[16] M.H. Jamróz, Vibrational energy distribution analysis (VEDA): Scopes and limitations, Spectrochim. Acta - Part A Mol. Biomol. Spectrosc. 114 (2013) 220–230.
doi:10.1016/j.saa.2013.05.096.
28
[17] V. Arjunan, P.S. Balamourougane, S. Thillai Govindaraja, S. Mohan, A comparative study on vibrational, conformational and electronic structure of 2-(hydroxymethyl)pyridine and 3-(hydroxymethyl)pyridine, in: J. Mol. Struct., Elsevier, 2012: pp. 156–170.
doi:10.1016/j.molstruc.2012.03.017.
[18] Y.N. Panchenko, Scaling of quantum-mechanical molecular force fields, Russ. Chem.
Bull. 45 (1996) 753–760. doi:10.1007/BF01431292.
[19] J.P. Merrick, D. Moran, L. Radom, An evaluation of harmonic vibrational frequency scale factors, J. Phys. Chem. A. 111 (2007) 11683–11700. doi:10.1021/jp073974n.
[20] J.P. Perdew, K. Burke, M. Ernzerhof, Generalized gradient approximation made simple, Phys. Rev. Lett. 77 (1996) 3865–3868. doi:10.1103/PhysRevLett.77.3865.
[21] Z. Wu, R.E. Cohen, More accurate generalized gradient approximation for solids, Phys.
Rev. B - Condens. Matter Mater. Phys. 73 (2006) 235116.
doi:10.1103/PhysRevB.73.235116.
[22] K.B. Wiberg, Ab Initio Molecular Orbital Theory by W. J. Hehre, L. Radom, P. v. R.
Schleyer, and J. A. Pople, John Wiley, New York, 548pp. Price: $79.95 (1986), J.
Comput. Chem. 7 (1986) 379–379. doi:10.1002/jcc.540070314.
[23] A. Boultif, D. Louër, Powder pattern indexing with the dichotomy method, J. Appl.
Crystallogr. 37 (2004) 724–731. doi:10.1107/S0021889804014876.
[24] R. Nakkalil, N.L. Richards, M.C. Chaturvedi, A study of precipitates and insolubles in an NiFe-based superalloy by analytical electron microscopy, Mater. Sci. Eng. A. 157 (1992) 89–100. doi:10.1016/0921-5093(92)90102-7.
[25] A.M. Petrosyan, V.A. Shishkin, Correlation between structural, infrared and nuclear quadrupole resonance data of iodates, Zeitschrift Fur Naturforsch. - Sect. A J. Phys. Sci.
51 (1996) 667–671. http://zfn.mpdl.mpg.de/data/Reihe_A/51/ZNA-1996-51a-0667.pdf (accessed October 11, 2018).
[26] M.A. Ben Abdallah, Synthesis, crystal structure, vibrational spectra, optical and DFT study of N-(3-ammonium propyl)-1, 3 diaminopropane tris iodate dehydrate [(C6H20N3)
29
(IO3)3·2H2O], J. Mol. Struct. 1171 (2018) 76–86. doi:10.1016/j.molstruc.2018.05.104.
[27] M.A. Ben Abdallah, S. Kamoun, Crystal structure, phase transition, electrical and optical properties of p-hydroxypyridinium iodate [C5H6NO (IO3)]2, J. Mol. Struct. 1178 (2019) 52–61. doi:10.1016/j.molstruc.2018.10.008.
[28] A. Bacchi, E. Bosetti, M. Carcelli, P. Pelagatti, G. Pelizzi, D. Rogolino, Triarylcarbinol derivatives barter intermolecular interactions to accommodate substituents and create polymorphs, CrystEngComm. 8 (2006) 233–244. doi:10.1039/b513876k.
[29] B. Dede, D. Avci, D. Varkal, S. Bahçeli, Molecular, Spectroscopic, NBO and NLO Properties of 4-Methyl-5-thiazoleethanol: A comparative theoretical study, Acta Phys.
Pol. A. 134 (2018) 1083–1091. doi:10.12693/APhysPolA.134.1083.
[30] L.A. Burns, Á. Vázquez-Mayagoitia, B.G. Sumpter, C.D. Sherrill, Density-functional approaches to noncovalent interactions: A comparison of dispersion corrections (DFT-D), exchange-hole dipole moment (XDM) theory, and specialized functionals, J. Chem. Phys.
134 (2011) 084107. doi:10.1063/1.3545971.
[31] K. Dong, Y. Song, X. Liu, W. Cheng, X. Yao, S. Zhang, Understanding structures and hydrogen bonds of ionic liquids at the electronic level, J. Phys. Chem. B. 116 (2012) 1007–1017. doi:10.1021/jp205435u.
[32] J.R. Durig, O.D. Bonner, W.H. Breazeale, Raman studies of iodic acid and sodium iodate, J. Phys. Chem. 69 (1965) 3886–3892. doi:10.1021/j100895a041.
[33] A. Rhandour, A. Ouasri, P. Roussel, A. Mazzah, Crystal structure and vibrational studies of butylenediammonium pentachlorobismuthate (III) hydrate [NH3(CH2)
4NH3]BiCl5H2O, J. Mol. Struct. 990 (2011) 95–101. doi:10.1016/j.molstruc.2011.01.022.
[34] H.E. Ahmed, S. Kamoun, Crystal structure, vibrational spectra, optical and DFT studies of bis (3-azaniumylpropyl) azanium pentachloroantimonate (III) chloride monohydrate (C6H20N3)SbCl5·Cl·H2O, Spectrochim. Acta - Part A Mol. Biomol. Spectrosc. 184 (2017) 38–46. doi:10.1016/j.saa.2017.04.059.
[35] K. Nakamoto, Infrared and Raman Spectra of Inorganic and Coordination Compounds, in:
30
P.R. Griffiths (Ed.), Handb. Vib. Spectrosc., John Wiley & Sons, Ltd, Chichester, UK, 2006. doi:10.1002/0470027320.s4104.
[36] J. Tauc, R. Grigorovici, A. Vancu, Optical Properties and Electronic Structure of Amorphous Germanium, Phys. Status Solidi. 15 (1966) 627–637.
doi:10.1002/pssb.19660150224.
[37] D.C. Patton, M.R. Pederson, D. V. Porezag, The Generalized-Gradient Approximation to Density Functional Theory and Bonding, in: Front. Mater. Model. Des., Springer Berlin Heidelberg, 1998: pp. 37–50. doi:10.1007/978-3-642-80478-6_3.
[38] H. Peelaers, C.G. Van de Walle, Brillouin zone and band structure of β-Ga2O3, Phys.
Status Solidi Basic Res. 252 (2015) 828–832. doi:10.1002/pssb.201451551.
[39] M. Shishkin, G. Kresse, Self-consistent GW calculations for semiconductors and insulators, Phys. Rev. B - Condens. Matter Mater. Phys. 75 (2007).
doi:10.1103/PhysRevB.75.235102.
[40] P. Bordet, J.X. Boucherle, A. Santoro, M. Marezio, Crystal structure and proton conductivity of NH4H2(IO3)3 and KH2(IO3)3, Solid State Ionics. 21 (1986) 243–254.
doi:10.1016/0167-2738(86)90079-2.
[41] G.A. Puchkovskaya, Y.A. Tarnavski, Phase transitions in the proton conductor
NH4IO3·2HIO3, J. Mol. Struct. 403 (1997) 137–142. doi:10.1016/S0022-2860(96)09391- X.
[42] L. J.K., P. H.W., C. H.W., K. J.E., K. S.J., Y. Y.S., Dielectric Properties of BaTi2O5 Glass, J. Korean Phys. Soc. 47 (2005) 267. doi:10.3938/jkps.47.267.
[43] A.K. Jonscher, Analysis of the alternating current properties of ionic conductors, J. Mater.
Sci. 13 (1978) 553–562. doi:10.1007/BF00541805.
[44] G.G. Cameron, M.D. Ingram, G.A. Sorrie, The mechanism of conductivity of liquid polymer electrolytes, J. Chem. Soc. Faraday Trans. 1 Phys. Chem. Condens. Phases. 83 (1987) 3345–3353. doi:10.1039/F19878303345.
31
[45] E.M. El-Menyawy, I.T. Zedan, A.M. Mansour, Electrical Conductivity and Dielectrical Properties of Bulk Methylene Green, J. Electron. Mater. 46 (2017) 4353–4358.
doi:10.1007/s11664-017-5414-z.
[46] A. Ben Rhaiem, F. Hlel, K. Guidara, M. Gargouri, Electrical conductivity and dielectric analysis of AgNaZnP2O7 compound, J. Alloys Compd. 485 (2009) 718–723.
doi:10.1016/j.jallcom.2009.06.062.