The Belgian Federal Planning Bureau (FPB) is a public body under the Prime Minister and the Minister of Economy. The purpose of this working paper is to carry out a descriptive analysis of the geographical concentration of the manufacturing sector in Belgium. This work is part of the study on the impact of information and communication technologies (ICT) on the geographical concentration of economic activities in cities, which is funded by SSTC1.
This article is focused on the manufacturing sector, from which the geographical agglomeration of activity sectors is analyzed at a fine industrial level, i.e. part of the explanation for this lies in the 'history' of the two regions and their different paths to industrialisation. This is reflected in the divergent composition of industries between the two regions, as well as the different degrees of concentration in the same industries.
All in all, this document provides some descriptive features related to agglomeration in the manufacturing industry. For example, the question of the source of agglomeration, natural advantages versus dynamic externalities, is not examined here.
Introduction
This study will therefore not provide any guidelines in relation to determinants of agglomeration or its consequences, but only a description of the actual situation with regard to the geographical concentration of manufacturing activity in Belgium. The remainder of the paper is structured as follows: Section 1 provides some measures of geographic concentration, followed by a brief description of the data in Section 2.
I Measures of geographical concentration
Ellison-Glaeser index
Ellison and Glaeser (1997) present a plant assemblage index, based on a test of comparison between the observed geographic distribution of plants and a random distribution. This index has the attractive property of being on average equal to industrial concentration when plants are located independently of each other. The value of Hk is a function of the number and size distribution of plants in industry k.
For an industry with F facilities, the index has a minimum value of 1/Fk when facilities are of the same size. Indices are generally high for industries with a small number of plants and with an uneven size distribution. The inverse of the Herfindhal index has an interesting meaning: it corresponds to the number of plants we would get if they were all the same size.
It is important to note that the Herfindahl index used in the economic geography literature is derived from the field of industrial economics, but is not the same. If there were no agglomeration economies and if the geographical units were equally attractive (no natural advantages), the gross geographical concentration GEGk of an industry k should be exactly equal to its industrial concentration Hk.
Maurel-Sédillot index
Both authors show that the expected average GEGk is Hk + (1-Hk), from which they derive an estimate of excess concentration called the agglomeration index. The index is a measure of excess concentration relative to industrial concentration, but does not indicate where this excess concentration comes from: natural advantages, agglomeration economies, or other factors. While this reference is important for large geographical units, as in many empirical studies, it can become a problem in small countries (such as Belgium) if smaller geographical units such as counties or districts are used.
Decrop (2002) showed that the Ellison-Glaeser index in this case is more an index of regional specificity of industries than one of geographical agglomeration. If plants choose to track randomly and independently of each other, the value of average should be zero; neither externalities nor natural advantages affect location and the non-zero gross geographic concentration observed is only due to industrial concentration (measured by the Herfindahl index); In principle, both indices take into account the Herfindahl index to neutralize the effect of industrial concentration on geographical concentration.
However, Holmes and Stevens (2000) note that the EC index varies significantly with plant size. In most manufacturing industries, the Ellison-Glaeser index increases when small size plants are eliminated from the sample of observations.
II Description of the data and geographical units
- Data description
- Some descriptive features
- Geographical units
- Population density (2000)
- Employment density (2000)
- Manufacturing employment density (2000)
It is striking that about a third of the factories with fewer than 50 employees actually accommodate 2 people. More generally, taking into account the entire database, two thirds of the observations fall into a class of 1 to 5 employees. Although most factories are very small, they do not account for the majority of employment by far.
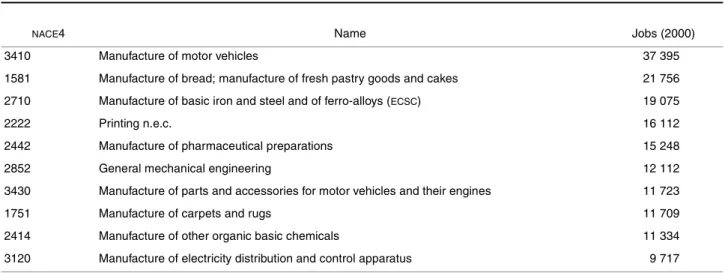
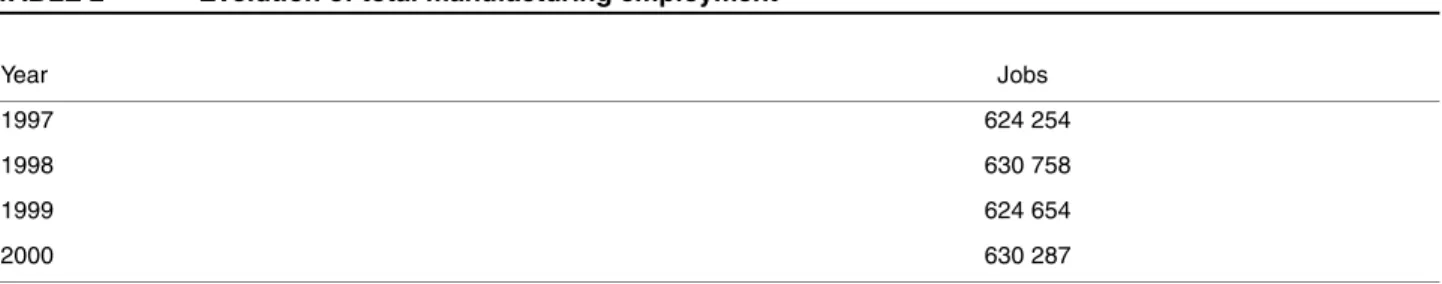
About 80% of employees are concentrated in establishments with more than 20 workers, which represents barely more than 10% of the total number of establishments. Employment in manufacturing increased by 0.97% from 1997 to 2000 (compared to 5.1% for total employment growth in Belgium) and accounted for more than 600,000 jobs during the period under review (see Table 2). Among the 237 NACE4 manufacturing industries, the 10 largest industries are presented in Table 3 and represent 26.37% of total manufacturing employment.1 The largest NACE4 industry is construction and assembly of motor vehicles (industry 3410), which represents 5.93%. of all employees in manufacturing activities in the year 2000, and the smallest share (close to 0%) is held by industry 2721 (Manufacturing of cast iron pipes).
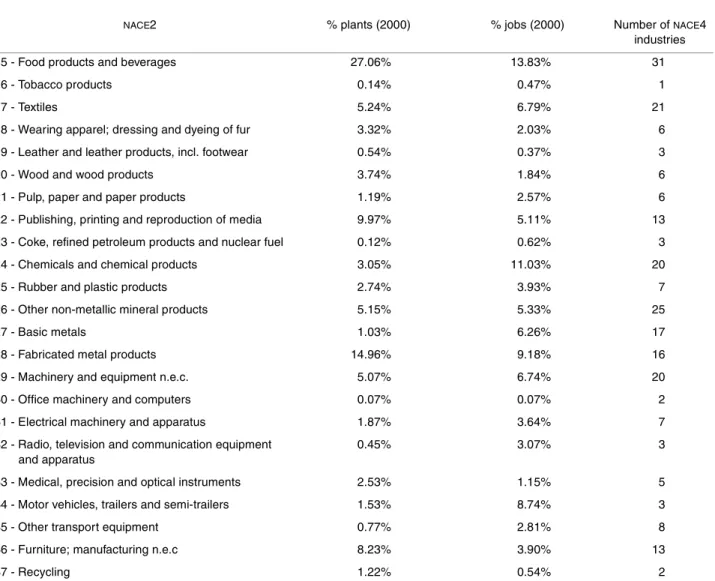
Note, however, that the more aggregated NACE2 sectors may include a more or less large number of NACE4 sectors, which in turn explains part of the results in Table 3. A striking feature of this table is the relative discrepancy between the proportion of ment and parts of plants. However, the purpose of this study is not to analyze the industrial concentration of manufacturing activity.
Nevertheless, studying the spatial concentration of activity, as will be described in detail below, requires "some" prior knowledge about industrial concentration. So far we have provided some hints about the distribution of employment across industries and firm size classes. Since the aim of this study is to present a map of the spatial distribution of manufacturing activity across Belgium, we must first assess some general features.
However, unlike metropolitan areas, districts as well as townships cover the entire Belgian territory, which is an essential requirement when studying the spatial distribution of activities. Average densities are 198 inhabitants/km2 in Wallonia versus 439 inhabitants/km2 in Flanders and 5,922 inhabitants/km2 for Brussels, indicating that the northern part of the country (Flanders) and Brussels are more densely populated than the Walloon region. Two comments are worth noting: i) Total employment is much more concentrated than population, and manufacturing jobs are even more concentrated than total employment. ii) Wallonia has a more clustered pattern than Flanders.

III Geographical concentration of manufacturing in Belgium
- Main results
- Scope of spillovers across industries
- Agglomeration and plant scale
- Regional outcomes
- Agglomeration and spatial autocorrelation
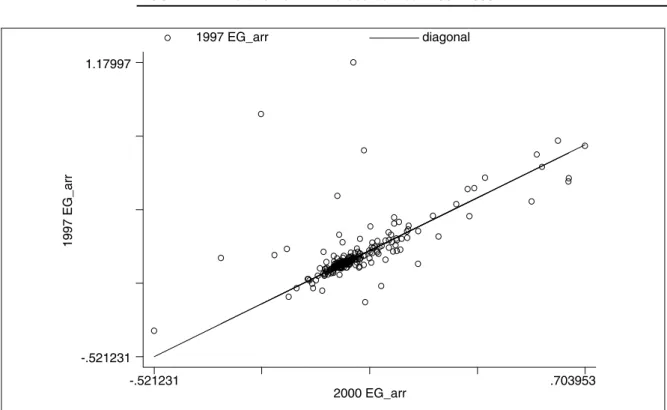
The values of the indices increased during these four years, but mostly remained within the intervals of the critical threshold values. An interesting issue that deserves closer attention relates to the sources of variation of the indices by industry. In other words, at least for some of these industries, entry or exit of one single plant can have a dramatic impact on the absolute value of the E-G index.
Except for very small industries, there is relative inertia of EC indices over this 4-year period. In about half of the 2-digit industries, 50% or more of the 4-digit industries are concentrated in a single interval. The interpretation is therefore simple: values of the co-agglomeration index equal to 0 indicate that any spillover effects/.
In two recent contributions, Holmes and Stevens (2000) have raised the issue of plant size when measuring the geographic concentration of industries. If we consider that productivity is related to the concentration of "firm" manufacturing plants in an industry, rather than total industry employment, then standard measures of geographic concentration may tend to underestimate this concentration (Holmes and Stevens, 2000). . Finally, note that of the top 20 industries (in terms of geographic concentration), only 2 coincide.
In the past, Wallonia was the richest part of the country, partly because of its iron and steel industry. Belgium is one of the leading car manufacturers in Europe (although it does not have a national brand). Apart from this last industry, three more common industries are in the top 10 of the most important regional activities: n.e.c. printing, bakery, confectionery and confectionery industry and general mechanical engineering.
A second feature is related to the increase in the E-G index during the observation period. But one can see that except for two industries, no other industries are in the top 20 of the top ten of the other regions. Note, however, that in both regions we find sub-industries of the same NACE2 industry, in particular the textile industry (NACE2 17).
This statistic compares the value of a continuous variable at each location with the value of the same variable at surrounding locations. First and foremost, 95% of the indices show positive spatial autocorrelation for the four years under consideration.

Further steps
Bibliography
Hoover, Edgar (1937), Location Theory and the Shoe and Leather Industry, Cambridge, Mass.: Harvard University Press. Saksenian, AnnaLee (1996), Regional Advantage: Culture and Competition in Silicon Valley and 128th Street, Harvard University Press. Tabuchi, Takatoshi (1986), Urban Agglomeration, Capital Growth Technology and Labor Market Equilibrium, Journal of Urban Economics, 20, pp.
Appendix
Percent of plants and jobs by NACEBEL 2-digit in 2000
4-digit classification among 2-digit industries
Belgium and its three regions (the thin strokes indicate the limits of the districts)