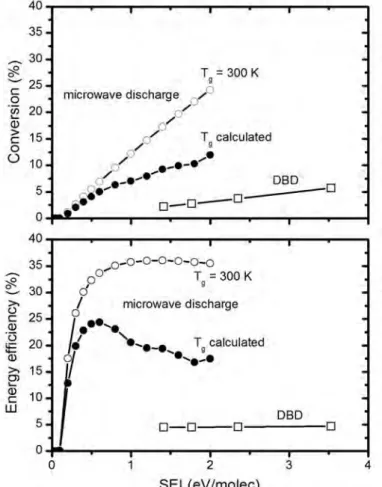
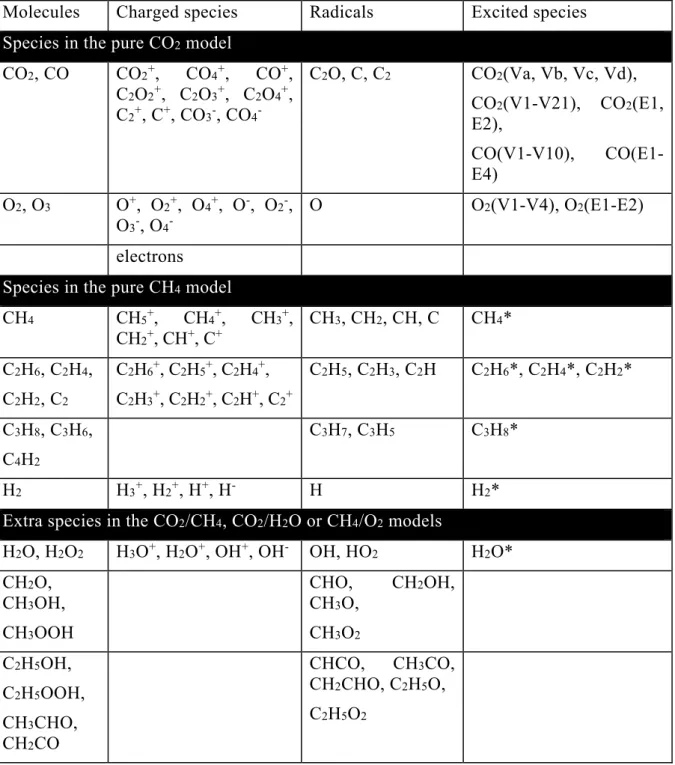
Description of the included plasma chemistry for the different gas mixtures Depending on the gas mixture considered, different species must be taken into account in the model. Both the CO2 conversion and energy efficiency are clearly much higher in the MW plasma than in the DBD, as clearly shown in Figure 3. The higher CO2 conversion at lower temperature in the MW plasma is attributed to the lower importance of vibration-translation (VT). ) relaxation collisions of the CO2 vibrational levels at lower temperatures, which is the main loss process for the vibrational levels.[43,44].
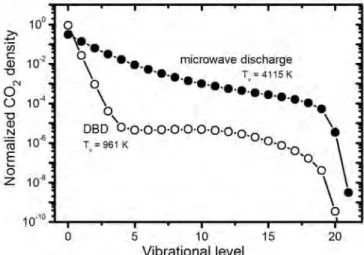
In the MW plasma with a self-consistently calculated gas temperature, the energy efficiency reaches its maximum at an SEI around 0.6 eV/molec. The reason for the higher CO2 conversion and energy efficiency in the MW plasma than in the DBD is the higher population of the CO2 vibrational levels, as illustrated in Figure 4 for the CO2 asymmetric mode levels (i.e. the mode that is most important for CO2 vibration levels). cleavage[38,43,44]). This stepwise vibrational excitation or so-called 'ladder-climbing process' explains the higher CO2 conversion and energy efficiency in the MW plasma.
The corresponding calculated peak gas temperature in the plasma is also shown (right axis). b) Time evolution of vibration temperature and plasma gas temperature, for each initial gas temperature. The maximum gas temperature in the plasma, as calculated for different cases of initial gas temperature, is also shown in Fig. 5(b), the time evolution of the vibration temperature and the plasma gas temperature is plotted, for each initial gas temperature.
5(b) the peak in the vibrational temperature is reached earlier at higher initial gas temperature.
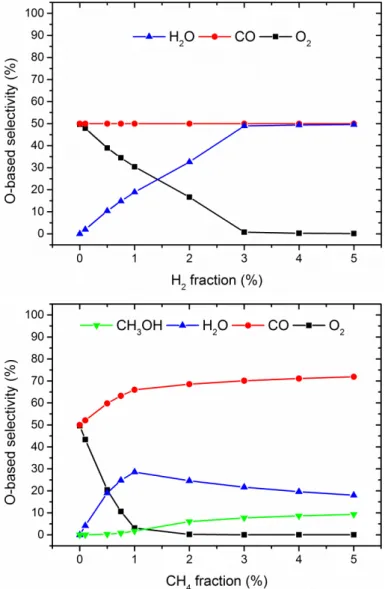
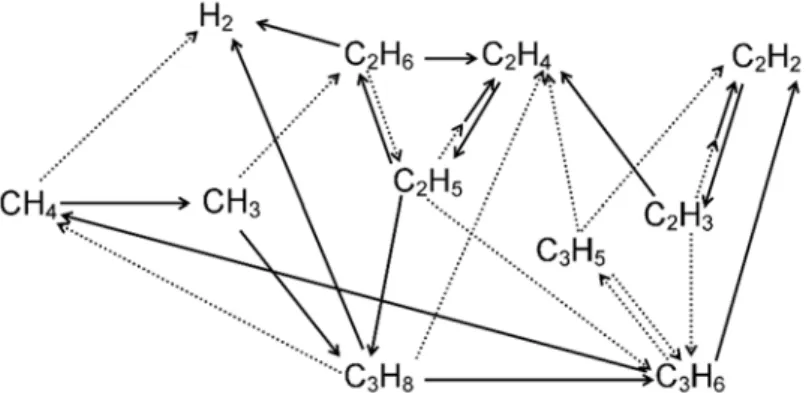
Calculated O-based selectivities of the reaction products of CO2 splitting, after adding a few % H2 (top) or CH4 (bottom), illustrating that O2 is completely removed (or captured in H2O), after 3% H2 addition or 2% CH4 addition. From these densities, the CH4 conversion and the yield of the various products can be calculated. Schematic overview of the dominant reaction pathways for the conversion of CH4 to higher hydrocarbons and H2.
The densities of CO2, CH4 and the various molecules formed from this mixture are shown in Figure 9 as a function of the initial CO2 fraction in the mixture for a gas residence time of 5 s (corresponding to a gas flow rate of 200 mL/min for the reactor setup studied; see details in [49,62]). Calculated densities of CH4 and CO2 and the various molecules produced by the conversion of CH4 and CO2, after a residence time of 5 s, as a function of the initial fraction of CO2 in the CO2/CH4 mixture for a DBD reactor operating at 5 kV and 10 kHz. This is attributed to the increasing importance of the CH4 loss reaction with CO2+ ions, as discussed in detail in [62].
However, the CO2 conversion increases to about 20% at a CH4 fraction of 95%, due to the additional loss processes of CO2 upon collision with (mainly) CH2 radicals. From the calculated densities of the different molecules (as drawn in Figure 9), their yields can also be derived. The thickness of the arrow lines is correlated with the importance of the reaction pathway.
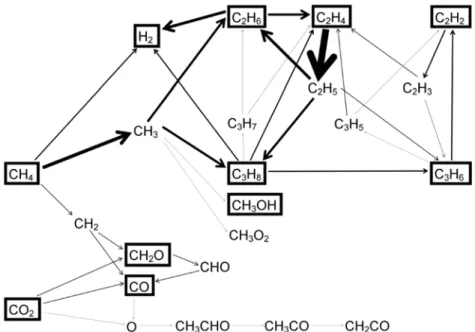
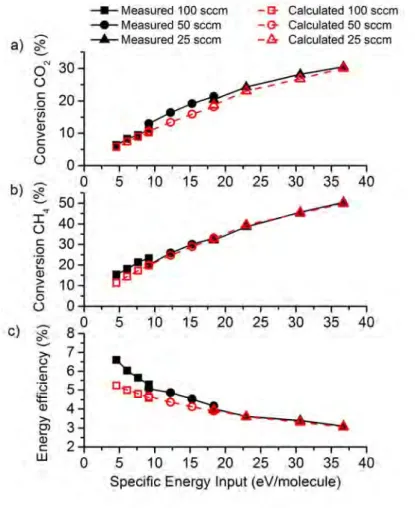
It is also clear from Figure 10 that electron impact dissociation of CH4 and of the higher hydrocarbons also produces the formation of H2, as in the case of the pure CH4 plasma (see above). During the pulses, the CH4 dissociation is much more pronounced than the CO2 dissociation, but in the afterglow almost 74% of the dissociated CH4 is formed again, by recombination of CH3 radicals with H atoms. Measured (solid, black lines) and calculated (dashed, red lines) CO2 conversion (a), CH4 conversion (b) and overall energy efficiency (c) in a DBD plasma used for DRM, as a function of the SEI, at a 50/50 CO2/CH4 mixt.
In addition to the conversion of CO2 and CH4, the selectivities of the reaction products can also be calculated. Note that the sum of the selectivities is above 100%, which is a consequence of the definitions used (see details in [59]). This allows us to determine whether such operating conditions can produce better results than the current state of the art.
The total conversion (ie, the average conversion value of CO2 and CH4) is 84% in this case and corresponds to an energy efficiency of 8.5%. Moreover, as illustrated above, a higher SEI leads to a higher conversion, but at the expense of energy efficiency.
O 2 mixture
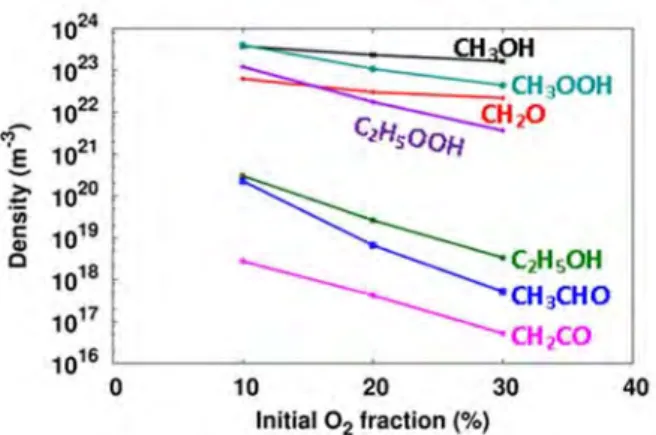
Calculated density of CH4 and O2, as well as the different molecules formed in the CH4/O2 mixture, after a residence time of 5 s, as a function of the fraction of O2 in the mixture, for a DBD reactor operating at 5 kV and 10 kHz. The conversion of CH4, after this residence time of 5 s, is again calculated to be about 10%, as in the CO2/CH4 mixture (for the same CO2 fraction up to 30%; see previous section). This conversion is much higher than the corresponding conversion of CO2 in the CO2/CH4 mixture (see previous section), illustrating the reactivity of O2 to the formation of many (partially or fully) oxygenated products.
At higher proportions of O2 in the mixture, the conversion of O2 decreases to about 35% at an O2 proportion of 30% due to the lower importance of the above process (see details in [62]). When comparing with the maximum yields of these products in the CO2/CH4 mixture (see the previous section), it is clear that H2 is formed in clearly smaller amounts (as also mentioned above), formaldehyde is also somewhat less important, but the yield of methanol is by one an order of magnitude higher than the maximum yield in CO2/CH4. This indicates that the underlying chemistry in CO2/CH4 and CH4/O2 mixtures is clearly different.
In the 90/10 CH4/O2 mixture, the situation is slightly different, as methanol and methyl hydroperoxide are produced in almost the same amounts as CO and H2O (see Figure 13 above). No methanol was detected in the experiments and the calculated methanol concentrations are also not higher than the ppm level. These ratios are quite low, but expected given the low proportion of H2O in the mixture.
Calculated (dashed lines, open symbols) and measured (solid lines, filled symbols) CO2 conversion (a), H2O conversion (b) and formed H2/CO ratio (c), in a DBD plasma, as a function of H2O content of the gas mixture at a total gas flow rate of 600 ml/min and three different SEI values. Of course, this does not mean that there will be no net conversion of CO2 and H2O in the plasma, as there are also other pathways for the conversion of these molecules. Furthermore, the above mechanism also explains why no formation of methanol (or other oxygenated hydrocarbon) is observed in the CO2/H2O mixture.
Note that this fast reaction between H and O atoms has been shown to be useful for trapping O in the case of pure CO2 conversion, providing a solution for the separation of CO2 fission products (see above), but in this case, is clearly the limiting factor for formation of oxygenated hydrocarbons. Furthermore, we believe that there is still room for improvement in the conversion and energy efficiency of DBD plasmas by inserting dielectric beads, i.e. in DBD packed bed reactor [10,14]. Both observations are also made experimentally and can be explained from the model by analyzing the chemical reaction pathways in the plasma.
Another example where detailed insight into the underlying chemical reactions can provide possible solutions to improve conversion efficiency was shown for the problem of CO/O2 product separation in pure CO2 splitting. Nevertheless, we plan to extend these models to CO2 (and its mixtures) in the future to model CO2 conversion in a realistic plasma reactor geometry.