Ik wil Carmeliet graag bedanken voor de interessante inzichten en observaties die mijn onderzoek hebben geleid. Plages voor de leerzame discussies en de mogelijkheid om een uitgebreid testprogramma te doorlopen.
Introduction
B ACKGROUND
Experiments are essential to measure the properties of materials and structures and to validate simulation models. These transport problems are studied in detail by a simulation model developed to describe the infiltration of a salt solution into a porous structure.
A IM AND METHODOLOGY
- Aim
- Methodology
Due to the complexity of reality and the multitude of possible situations, simplifications are made in the developed engineering models. Tracer experiments were performed with the aim of investigating the influence of velocity on the combination of diffusion and convection.
![Fig. 1.1 Cyclic degradation process [following MEH-94]](https://thumb-eu.123doks.com/thumbv2/pubdocnet/374400.45397/27.681.143.539.348.663/fig-cyclic-degradation-process-following-meh.webp)
O UTLINE OF THE WORK
State of the art
E XEMPLARY SITUATION DESCRIPTION
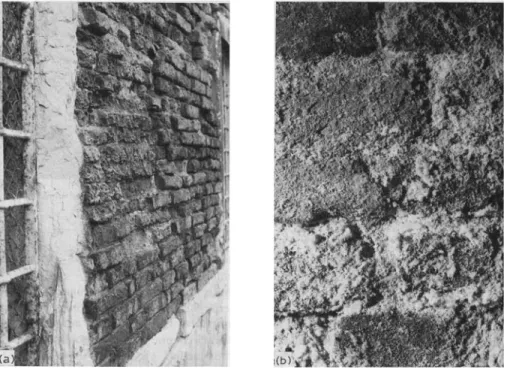
First, cracks appear due to the expansion of the corroded steel bars (a) and finally the concrete cover is pushed (b) (photos from the laboratory . Reyntjens). The transport process, which is the basis of the problem caused by chloride, may be a combined process of diffusion and convective flow of a salt solution due to capillary forces or hydrostatic pressure.
D ISCUSSION ON EXPERIMENTAL METHODS FOR THE DETERMINATION OF THE SALT
- Historical overview of underlying transport laws
- Review of experimental methods for measuring Cl - transport in concrete .12
- Migration test
For the non-steady state migration test, a penetration depth is determined during the transient phase of chloride penetration (Fig. 2.4a). Also Zhang and Gjørv [ZHA-95] investigated acceleration methods for determining the chloride diffusion coefficient in concrete.

F UNDAMENTALS OF CHLORIDE DIFFUSION COEFFICIENT BASED ON
- Ionic interactions
- Salt as an electrolyte
- Derivation of a formula for diffusion coefficients
- Binary diluted salt diffusion in water
- Molecular salt diffusion coefficient in concentrated free solutions
The mobility and thus the diffusion constant can be related to the viscosity of the solvent medium. The increase in the diffusion coefficient with temperature is due to the increased mobility of ions at higher temperature.

S ALT DIFFUSION COEFFICIENT IN POROUS MATERIALS
As a result of the tortuousness of the pores, the length of the effective path of the ions becomes longer (Fig. 2.11). We define the tortuosity τ as the ratio of the effective path length to the direct path length (τ =le/l).
![Fig. 2.11 Concept of effective length in transport through porous materials [SHA-91]](https://thumb-eu.123doks.com/thumbv2/pubdocnet/374400.45397/57.681.151.491.190.392/fig-concept-effective-length-transport-porous-materials-sha.webp)
S ALT SORPTION VERSUS DISSOLUTION IN POROUS MATERIALS
M ETHODOLOGIES FOR DESCRIBING DIFFUSION IN POROUS MATERIALS
- Diffusion in saturated conditions
- Moisture transport studies with the presence of salts
Pivonka [PIV-04] collected experimental data from various investigations to seek an explanation for the variation in the magnitude of the chloride diffusion coefficient in cement pastes. The change of the moisture retention curve based on the salt-dependent contact angle and surface tension is mentioned.
![Fig. 2.12 Simplified hygroscopic curves used for the WUFI calculations [RUC-00]](https://thumb-eu.123doks.com/thumbv2/pubdocnet/374400.45397/61.681.208.470.639.879/fig-simplified-hygroscopic-curves-used-wufi-calculations-ruc.webp)
T RANSPORT IN CRACKS
This is possible due to the microcracks along the crack surface, resulting in a local increased permeability. For crack widths of 60 µm and more, the profiles perpendicular to cracks are very similar to the surface profiles.

K NOWLEDGE ABOUT SALTS , SALT BEHAVIOUR AND SALT DAMAGE
- Crystallization
- Supersaturation
- Crystallization theories
- Other hypotheses of salt damage mechanisms
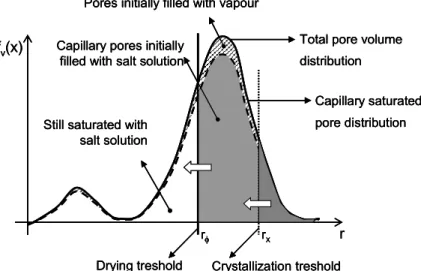
Due to the high solubility of the salt, a considerable amount of sulphates are available in solution. Together with the mechanical equilibrium of the solution-crystal interface, the current radius of the crystallization pore can be determined. By scaling up to the macroscopic level and taking into account the salt mass present, the role of the pore size distribution on crystal growth can be introduced.
Finally, deformation and fracture of the porous solid due to drying-induced crystallization are considered in the context of brittle poroelasticity.
N EEDS FOR FURTHER RESEARCH
The evolution of the moisture content and the elongation change due to crystallization during drying are measured until cracking occurs. Finally, a poromechanical approach is used to predict hygric shrinkage and expansion due to salt crystallization. Simulation of three-dimensional salt transport in homogeneous non-adsorbent materials and solving mathematical problems due to fast convective transport in cracks.
Development of a one-dimensional coupled model of moisture and salt transport + prediction of hygroscopic contraction and expansion due to salt crystallization.
Development of the governing equations
C ONTINUUM APPROACH
- The representative elementary volume (REV)
REVs are introduced to relate the microscopic geometric properties and physical properties of the real porous media to the macroscopic (or average) properties of the continuum model. The sizes of the REV are therefore chosen so that the size of the material components seems negligible for the size of the REV. The characteristic length of the REV in turn must be sufficiently smaller than the length over which significant macroscopic variations occur.
The position of the center of the REVs in a global coordinate system is described by the coordinates xi, yi and zi.

M OISTURE IN SALT ABSENCE
- Porous structure and moisture retention curve
- Independent state variables
- Moisture transfer (at constant temperature)
- Transport equations
- Simplified equations for isothermal moisture transfer
- Combined heat and moisture transfer
- Extended mass transfer
- Energy conservation
- Resulting equations for the combined heat moisture transfer
The degree of saturation of the liquid-water solution S1 is defined as the ratio of the volume of the liquid to the total volume of the open pores. The relative diffusion of both components can be described relative to the reference speed of the mixture vg [COU-95]. Here δa is the vapor permeability of still air and δv is the vapor permeability of the porous medium.
This dependence is due to the fact that the surface tension σgl is a function of temperature.
![Fig. 3.3 Hygroscopic curve showing molecular adsorption and capillary condensation depending on the RH range [HEN-00]](https://thumb-eu.123doks.com/thumbv2/pubdocnet/374400.45397/79.681.183.484.704.865/hygroscopic-curve-showing-molecular-adsorption-capillary-condensation-depending.webp)
S ALT PRESENCE
- Needed adaptations to the moisture and heat transport
- Salt solution and crystals
- Independent state variables
- Moisture and heat transfer
- Salt transfer in saturated condition ( S l = 1 , no crystallization)
- Salt crystallization (S l =1)
- Poromechanics: deformations
As a function of the salt concentration, the density of the liquid phase ρl (kg/m³) will change (Eq. (3.112)). Therefore Cx, porosity φ0 and molar volume υC(m³crystal/molcrystal) of the salt are needed. Besides the enthalpy of the different phases mentioned (material matrix, water vapor and dry air), also the enthalpy of the salt phases (dissolved and precipitated) must be taken into account in the global energy balance (equation (3.45)).
Due to the change in porosity from crystallization, the space available for the liquid phase is reduced, resulting in a change in the moisture retention curve w p C( c( )s ,Cx).
![Fig. 3.6 Schematical view of the interfaces crystal/liquid and liquid/ air present in a salt loaded pore (based on [RIJ-04])](https://thumb-eu.123doks.com/thumbv2/pubdocnet/374400.45397/97.681.121.554.380.710/schematical-interfaces-crystal-liquid-liquid-present-loaded-based.webp)
Experimental determination of material parameters and transfer properties91
Bricks
The brick is a red-fired clay brick made using the extrusion technique. Bricks are assumed to be homogeneous, but due to the extrusion manufacturing technique, the material is not isotropic. Since crystallization first occurs only in the coarse pores of the brick, the crystallization pressure remains limited.
Second, due to the high stiffness of the brick, the crystallization pressure will not lead to measurable deformation of the material.
Calcium silicate board (calsilb)
B RICK PROPERTIES
- Open porosity and bulk density
- Sorption coefficient and capillary moisture content
- Tortuosity
- CUP test
- Method of Champoux
- Saturated permeability
- Saturated permeability of uncracked brick material
The porosity of the brick material is formed by the pore spaces, which are mostly oriented in the direction of extrusion, resulting in twist depending on the direction. The vapor resistance factor was measured in the direction of extrusion of the brick and perpendicular to the direction of extrusion. A twist value of 3.3 in the extrusion direction was obtained, which confirms the value obtained by the dry cup test.
Based on the liquid flow, an indirect determination of the permeability resulted in a value of 0.7x10⁻⁷ s.
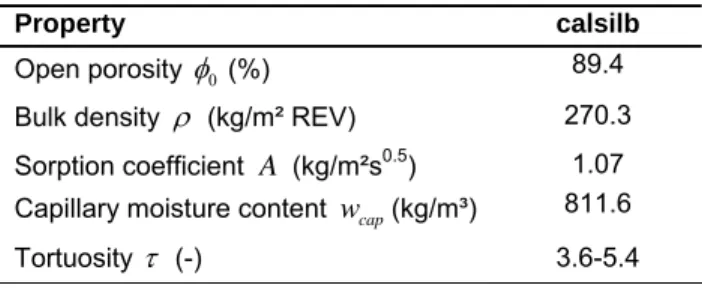
C ALSILB PROPERTIES
- Open porosity, bulk density and tortuosity
- Sorption coefficient and capillary moisture content
- Water retention curve
- Isothermal ad- and desorption
- Pressure membrane apparatus measurements
- Mercury intrusion porosimetry
- Pore volume distribution
- Unsaturated permeability
- E-modulus
- Hygric extension properties and determination of the Biot-coefficient
- Hygric extension during a capillary uptake experiment
- Hygric extension during increasing RH conditions
- Total deformation curve
- Other material properties of calsilb
For the determination of the isothermal adsorption curve (Fig. 4.14), oven-dried samples are initially conditioned at different RH. To avoid bending, two extensometers are mounted on opposite parallel sides of the sample (Fig. 4.21). These tests measure the extension of calsilb samples as a function of RH.
These calculated values are shown in fig. 3.10) and Table 4.6. For the values of the parameters of the moisture retention curve, the RH can be recalculated to a moisture content.
P ORE SIZE VERSUS SALT ION FOR BRICKS AND CALSILB
Consequently, we can conclude that no extra reduction of the diffusion coefficient in equation (3.108) is necessary. Therefore, the diffusion coefficient of the porous material remains constant during the salt transport process. PIV-04] mentioned that for concrete the chloride diffusion coefficient appears to be one order of magnitude smaller than the diffusion coefficient determined on the basis of the diffusion coefficient in a free salt solution taking into account the porosity and the tortuosity of the concrete (equation (3.108 ) ).
Consequently, the viscosity of the multilayer water network would be significantly higher, resulting in a lower diffusion coefficient.
Diffusion-convection transport in cell experiments with rotational flow
I NTRODUCTION
T EST SET - UP
- Calibration of the conductivity meters
- Analysis of salt concentration in the matrix
- Determination of the useful mass range
- Sample preparation
- Uncracked bricks
- Cracks
- Cracked bricks
To determine the salt concentration of the solution in the pores, the brick is cut into slices by sawing under dry conditions. Then the accuracy of the equipment is so low that any difference can be observed. The knowledge of the expected salt concentration, which determines the mass of crushed material, is therefore essential for a correct chemical analysis.
The geometry (Fig. 5.9) and properties of the tested cracked bricks are given in Table 5.3.

C ELL EXPERIMENT RESULTS OF UNCRACKED BRICKS
- Measured data
- Simulations
- Governing equations
- Parameters
- Numerical solution
- Initial and boundary conditions
- Results for purely diffusion
- Convective transport in the cells
- Results for the combined diffusive-convective transport
- Detailed investigation of the flow for the reference sample
- Comparing effects of different transport modes
The pressure difference is lower at the top than at the bottom of the sample, resulting in a convective flow that decreases with height. In the case of pure convection, we observe that breakthrough of the concentration front already takes place within the first hour. At the bottom of the sample, the pressure difference across the sample is high at the start of the test and decreases as a function of time (Fig. 5.20, bottom left).
The direction of the convective flow remains forward and the slope of the pressure lines remains positive.

C ELL EXPERIMENT RESULTS OF CRACKS
- Measured data
- Simulations
- Governing equations
- Parameters
- Mesh
- Initial and boundary conditions
- Dynamic-time-step algorithm
- Theoretical simulation for horizontal and vertical cracks
- Comparison between measured and simulated data
Due to the variable speed of the process over time, the transport model for cracks or cracked bricks includes a dynamic time-step algorithm. In the first period, the initial time step is small and slowly increases along with the decrease of the convective fluxes. The previous study provides information on the influence of orientation and crack width.
The experimental data of three different tested cracks (Table 5.2) are compared with the simulation results (Figures 5.22 and 5.23).

C ELL EXPERIMENT RESULTS OF CRACKED BRICKS
- Measured data
- Simulation
- Specimen
- Reservoirs A and B
- Numerical method
- Comparison between measured and simulated data
On the first surface (1), traces of the rotational flow in the crack are visible, mainly due to diffusion into the material. The mass balance for the liquid phase taking into account the hydrostatic pressure in the reservoirs is given by. Simulations of the concentration in the reservoirs for both tested cracked samples (Fig. 5.27) show good agreement with the measured data.
One may wonder why the dependence of the viscosity on the salt concentration is not taken into account in the simulations.

S IMULATIONS OF DEAD ENDING CRACKS IN A WALL
- Loading of dead ending cracks
- Influence on the material surrounding a dead ending crack
This means that in reality the crack is almost immediately loaded with the salt solution. Previous simulations regarding the salt loading of a crack teach that a concentration equal to the concentration of the surrounding solution can be assumed as a limit. The crack is so thin that at the edges of the crack the salt can spread in all other directions, resulting in lower concentrations.
Although convective currents are present in all cases, the effect depends on the relationship between the diffusion coefficient and the permeability.

C ONCLUSION
Results of chemical analysis of the salt content of the brick are compared with the salt concentration obtained from the 3D model to check the correctness of the diffusion and convection fluxes that control the transport process in the material matrix. The convection mechanism depends on the height of the sample, on the relationship between the liquid water permeability and the diffusion coefficient and on the dependence of the density on the salt concentration. Consequently, dead-end cracks adjacent to a reservoir of brine can be assumed to be filled from the start with the same concentration of the reservoir.
Different simulations show that the ratio of the permeability to the diffusion coefficient determines whether convective or diffusive flow is dominant.
Dispersion investigation in tracer experiments
- H ISTORY AND MOTIVATION
- T EST SET - UP AND SPECIMENS
- Apparatus description
- Measurement principle
- Specimen data
- A NALYSIS OF THE SALT CONCENTRATION
- T EST PROGRAM
- N UMERICAL SIMULATION MODEL FOR THE TRACER EXPERIMENT
- Basic equations
- Discretization
- Convergence criteria
- Initial and boundary conditions
- Input data
- Calculation scheme
- P ARAMETER ANALYSIS
- Convection only
- Convection and diffusion
- Analysis of dispersion
- D ISCUSSION OF TRACER TEST
- I MPORTANCE OF DISPERSION IN THE CELL EXPERIMENT
- C ONCLUSIONS
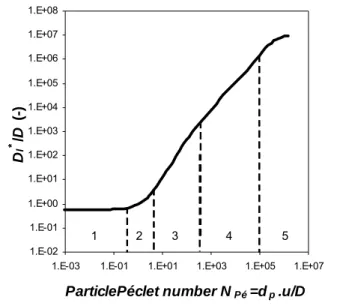
This figure shows the relationship of the longitudinal dispersion to the free molecular diffusion coefficient. In the first zone (NPe < 0.3) the velocity is so small that diffusion completely overshadows the dispersion. One of the prerequisites for such experiments is a high aspect ratio, the ratio between sample length and particle size.
However, the dimensions of the building materials are much smaller, so the height of the sample, which is the transport distance in the experiment, is limited.
Salt crystallization : Drying and extension experiment
I NTRODUCTION
S ITUATION DESCRIPTION
P ERIODS OF THE DRYING PROCESS
S AMPLE PREPARATION
U SE OF HYDROPHOBIC TREATMENT
A DDITIONAL MEASURED CALSILB PROPERTIES
T EST SET - UP
- Extension and drying
- X-ray images
M EASUREMENT DATA
- Strain measurement
- Strain in function of the moisture content
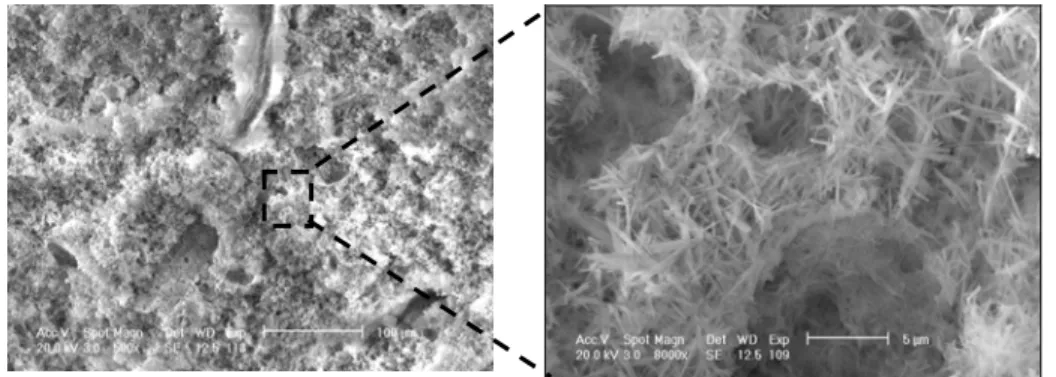
- Location of the precipitated salt by SEM analysis
M ODELLING HEAT , MOISTURE AND SALT TRANSPORT
- Basic set of equations
- Implementation
- General part
- Special remarks
M ODELLING EXTENSION
- In the case of water saturation
- In the case of salt solution and crystallization: ε l i , + ε salt crystal i ,
- The length variations
R ESULTS
- Global results
- Drying
- Extension
- Detailed profiles
D ISCUSSION
- Porous system
- Modifications concerning the transport model
- Modification concerning the extension model
- Limited applicability
C ONCLUSIONS
Conclusions and perspectives
G ENERAL CONCLUSIONS
R ECOMMENDATIONS FOR FURTHER RESEARCH
P RACTICAL PROOF
T HEORETICAL DEDUCTION
M OISTURE
T EMPERATURE
C ONCENTRATION IN SOLUTION
P RECIPITATED CONCENTRATION
S TOP CRITERION

![Fig. 2.19 Salt retention curve following Grunewald [GRU-98]. Additional a limit has to be taken into account regarding the available space](https://thumb-eu.123doks.com/thumbv2/pubdocnet/374400.45397/70.681.85.609.190.607/salt-retention-following-grunewald-additional-account-regarding-available.webp)
![Fig. 3.7 Molar fraction x * and pore access radius r related to the crystallizing pores plotted against the RH Φ [COU-06]](https://thumb-eu.123doks.com/thumbv2/pubdocnet/374400.45397/100.681.119.560.218.521/molar-fraction-access-radius-related-crystallizing-pores-plotted.webp)
![Fig. 3.11 Dispersion due to mechanical spreading [BEA-91] based on microscopic velocity variations in](https://thumb-eu.123doks.com/thumbv2/pubdocnet/374400.45397/107.681.80.582.495.782/fig-dispersion-mechanical-spreading-based-microscopic-velocity-variations.webp)