Political Representation and Protectionism:
Assessing How Electoral Institutions Affect Tariff Levels 1
Flavio Pinheiro
[email protected]
Department of International Relations University of São Paulo
1The present research is part of a larger dissertation project, funded by State of São Paulo Research Foundation (Fapesp), grant number 2009/12376-0, and has the support of the Center of International Negotiations Studies (Caeni) of the University of Sao Paulo.
Abstract
Do electoral rules affect the level of trade protection in democratic countries?
Recent studies indicate that when it comes to trade protection, electoral systems do matter; however, a thorough analysis of the literature unveils the fact that com- peting theories and mixed findings still prevail. In this work, I intend to solve the empirical and theoretical puzzle involving political representation and trade policy by offering and testing an alternative explanation. My answer lies in the Stigler- Pultzman (S-P) analysis of regulation, formalized by Chang et al. in Electoral Systems and the Balance of Consumer-Producer Power. Adapting their model, I evaluate the effect of electoral institutions on the level of trade protection. More specifically, I analyze 59 democracies from 1996 to 2008 and estimate the effect of electoral systems’ level of responsiveness (electoral disproportionality) on trade protection (simple mean of applied tariff and the number tariff peaks). The pre- liminary findings indicate that the higher the rate of proportionality created by electoral institutions, the greater the level of protection that politicians will provide for special interest groups, especially in non-presidential democracies.
1 Introduction
No doubt remains that institutions are a key factor to explain political outcomes. For that rea- son, many scholars take them into account when attempting to answer a myriad of puzzles involving political phenomena, varying from social inequality, wealth distribution, violence, coup d’état, regime survival, and corruption, to subjects such as compliance to international agreements and regional integration. Political scientists follow the same token when dealing with trade policy, greatly relying on institutions. For example, some argue that insulated Exec- utives are more prone to adopt free trade policies (Destler,2005;Schattschneider,1935); others examine the dynamic of the party system and the government structure to answer similar ques- tions (Epstein and O’Halloran,1996;Lohmann and O’Halloran,1994). Finally, a growing body of literature seeks to explain free trade based on regime type, reporting that the emergence of democratic institutions is a key factor to determine the rush towards an open market in the past decades (Haggard and Kaufman,1995;Kono,2006;Mansfield, Milner and Rosendorff,2000;
Milner and Kubota,2005;Wintrobe,2000).
Thus, it should not come as a surprise that those who study the determinants of protectionist policies carefully examine the role played by the electoral system, institutions responsible for translating citizen preferences into choices of political leaders. A wide and well-established literature informs that differences in electoral rules among countries may affect a variety of public policies-related issues, such as government spending, shaping wealth redistribution and fiscal responsibility (Persson and Tabellini,2005), economic growth (Knutsen, 2011), foreign direct investment (Garland and Biglaiser,2009), anti-corruption measures (Kunicová and Rose- Ackerman,2005;Persson, Tabellini and Trebbi,2003), or human rights protection (Cingranelli and Filippov,2010).
Regarding trade policy, there is a quasi-consensus indicating that electoral rules matter;
yet the literature lacks convincing statements on how each set of electoral rule impacts on protectionism and detailed accounts of their causal mechanisms.The current research on the topic amounts to not only competing theories, but also empirical findings that are far from confirming any prevailing explanation. Their results, actually, provide mixed signals, which indicate the need for a more robust account. Rogowski (1987), Nielson(2003), McGillivray (2004), and Hankla(2006) found evidence that countries with small districts are more likely to adopt protectionist measures. The argument is also applied to differentiate the incentives created by majoritarian (MAJ) and proportional (PR) electoral systems. Since districts are smaller under the majority rule, politicians may be more prone to support selective policies.
On a multi-country study evaluating tariff rates, Evans (2009) informs a protectionist bias on majoritarian democracies. Rickard(2010,2012) confirms the findings, showing that countries that share proportional representation have a higher degree of compliance to trade agreements and spend more on subsidies as a form of trade protection. The idea supported by the literature is plain and quite intuitive. They argue that in large districts, where politicians are elected to represent a more diverse group, they would be more capable of implementing broad programs, attentive to general public goods, as free-trade measures. On the other hand, those elected in small district would be accountable to a narrow group of citizens and more vulnerable to special interests; thus, more prone to implement policies that would benefit few, such as protectionist measures. One of the main derivations of the argument is to automatically associate the MAJ system with aprotectionist bias.
Some studies, however, indicate different outcomes. On analyzing levels of non-tariff bar- riers (NTB), Mansfield and Busch (1995) actually found significant, but unexpected results
regarding the electoral system. Contrary to theoretical predictions, their results inform that a higher level of protection may be more easily found in PR countries. When testing hisaccess point theoryon trade policy,Ehrlich(2011) found consistent evidence to support his view: the moreaccess points– more parties and districts, combined with a low level of party discipline and presidential system –, the higher the tariffs. More importantly, however, he detected no indication of an independent effect of neither PR nor MAJ systems when controlled by other factors. More specifically, a few works begin to raise questions on theconstituency size theory validity and predictions. Karol(2007) andEhrlich(2009), for instance, assert that pork-barrel models misrepresent trade politics. Both focused on the American case to empirically test the influence of constituency size on the trade vote. No significant result was found.
Attempting to solve this theoretical and empirical puzzle, I present a preliminary empiri- cal analysis on the effect of electoral institutions on trade policy and point out an interesting and unexpected relation between features of electoral systems and the level of trade protection.
First, I inform that democracies with high level of electoral disproportionality present lower level of tariff protection. The effects, however, are not detected on theSimple Mean of Applied Tariffs, but on theNumber of Tariff Peaks, which makes the results even more interesting, be- cause the number of peaks informs the level of protection on sensitive products. In addition, the results reinforce the thesis that presidential democracies are more prone to adopt lower levels of trade protection. Finally, the findings indicate that there is no embedded protectionist bias in MAJ systems, refuting the constituency sizeas a central mechanism to explain politicians’
preference in trade policy.
Contrary to most of the works on International Political Economy (IPE) that seek to explain the relation between representation and trade policy focusing on formal institutions, I rely on
the effect produced by them. For that reason, I use the level of proportionality between votes and seats as the primary independent variable. The main argument builds off of Chang et al.
(2010)’s formalization of the Stigler-Pultzman (S-P) framework, which provides theoretical ba- sis to interpret trade policy as a result of the dispute between producers and consumers(voters).
In this framework, the central hypothesis informs that the higher the level of vote-seats elas- ticity (or electoral disproportionality) found in a political system, the more prone politicians will be to meet consumer’s (voters’) interests, and the lower the trade tariffs will be. To test this hypothesis, I estimate the model using the Ordinary Least Squares (OLS) method and year fixed-effects, focusing on the effects of electoral disproportionality on tariffs –Simple Mean of Applied Tariff and the Number of Tariff Peaks – for 59 countries from 1996 to 2008.
The paper proceeds as follows. In the second section, I introduce in detail the theoretical approach. Next, I present the operationalization and justification for the dependent and inde- pendent variables. In the fourth section, I state the hypotheses and inform the model specifica- tion. In addition, I describe the data, presenting its descriptive statistics and sources. Finally, in the fifth section, I inform and comment the results and present the concluding remarks.
2 Theory
In a recent work,Chang et al.(2010)2attempt to explain one of the most intriguing economic distinctions among countries: price variation. According to them, the reasons for this oc- currence may lie in a series of factors, ranging from levels of regulation to social economic inequalities. Part of this variation is due to particular characteristics of the countries. How-
2The study, actually, is a result of a series of articles published by the authors in the pre- vious years: Rogowski and Kayser(2002);Rogowski, Chang and Kayser (2008); Linzer and Rogowski(2008)
ever, a complementary explanation might be found in a systematic component. The authors sustain that differences in political institutions, more specifically in the electoral rules adopted by democracies, represent a key element in this equation. To put it succinctly: the rules of the game can present bias favoring producers or consumers. When the former wins, prices soar;
when the latter prevails, prices decrease.
Based on the S-P analysis of regulation, they inform that there is a political dispute between producers, who seek a monopolistic price setting, and consumers, who demand competitive prices. Politicians, the ones responsible for establishing the very regulation that will determine price levels, will simply desire to maximize their political support, considering the marginal rate of substitution between both groups. In this case, price would indicate the balance of consumer-producer political power in a given industry (2010, 19).
The formalization of the S-P framework byChang et al.(2010) can be summarized as fol- lows: in democratic regimes, government and opposition care for two things: legislative sup- port and campaign funding resources. Consumers and producers are mutually exclusive groups, and while the latter contribute with money and votes, the former can offer only votes. In this scenario, when consumer votes become more responsive (or sensitive), politicians weight votes more heavily, which is translated into consumer power. On the other hand, when producers’
votes or campaign contributions become more responsive, politicians will weigh money more heavily, which empowers the producers.
The mechanism behind the explanation is the seats-votes ratio, a property of the electoral system. Thus, when the authors inform that the higher the responsiveness of votes, the more pro-consumer the policies will be, they mean that "the greater the percentage increase in seats produced by a 1% increase in votes, the more the policy will favor consumers and the more
closely prices will approximate to zero" (2010, 24).
Electoral systems may be regarded as a method for translating parties’ or candidate’s share of the popular vote into offices, typically of seats in parliament. There are two prototypi- cal electoral systems that represent opposites in terms of seats-votes elasticity: the MAJ and the PR system. This difference has already been exhaustedly examined by political scien- tists (Borisyuk, Rallings and Thrasher, 2004;Lijphart, 1990;Taagepera, 1986;Taagepera and Grofman, 2003). While the PR system exponent approximates 1 by design; MAJ system has something like a cube rule. As an example, if four parties are disputing an election and each receives the following number of votes: 10, 20, 30, and 40, their seat (%) in Congress would be, respectively, 1%, 8%, 27%, and 64% under the MAJ rule; but 10%, 20%, 30%, and 40%
under the PR rule.
The logical conclusion reached by the authors is that, since MAJ systems exhibit higher seat-votes than PR systems, politicians elected under the former will adopt pro-consumer poli- cies; in PR systems, which by design do not greatly distort vote shares when converting them into seat shares, policies will have a pro-producer bias. Or, holding everything else constant, MAJ countries would present lower prices; on the other hand, PR systems would share a pro- ducer bias, which may result in countries with high price levels.
The argument provides a robust explanation for price variation3. Its rationale, however, can also be used to explain tariff levels. It is widely known that tariff levels are more easily manipulated by politicians than price because tariffs can be determined by ordinary laws, or, in
3 The theory has been tested by the authors in a panel and cross-sectional analysis with democratic countries between the 1970 and 2000 and they have found compelling evidence of a negative and significant effect of the majoritarian rule on price levels. In a recent re- search, Weinberg (2012) also tests the S-P framework and find similar results, but his work was restricted to prices in one economic sector – agriculture –, measured by the Consumer Tax Equivalent (CTE).
many cases, by Executive decrees. Besides, tariffs do represent the dispute between consumers and producers. That being said, there are no impediments on the use of the S-P framework to explain the impact of political representation (electoral rules) on the level of trade protection (tariff barriers), providing a more rigorous account than the usual and fragileconstituency size assumption.
3 Electoral Disproportionality and Trade Protection
The theoretical mechanism that I intend to evaluate is based on theseats-votes elasticityproper- ties of electoral systems. As a proxy for seats-votes elasticity,Chang et al.(2010) use the broad classification of MAJ and PR. They justify their choice by informing that in "the real-world electoral systems we observe cluster around these two poles – MAJ and PR; and (...) "with a few exceptions, MAJ systems have considerably higher seats-votes slopes than do proportional methods of election" (2010, 19). Although at first glance it seems a parsimonious and efficient solution, one must bear in mind that there are subtle institutional differences from one electoral system to another that affect seats-vote elasticity that goes beyond the dichotomy between MAJ and PR rules.
An alternative and more effective method to capture the seats-vote elasticity in a political system is the Index of Electoral Disproportionality (IED), also known as the Gallagher Index or Least Squares Index (Gallagher,1991). The IED measures the disproportionality between the distributions of votes and seats, being the sum of the squared difference between the received votes and the percentage of seats, varying from 0 to 1004. For example, if in a country with 3
4The IED is determined by the following formula:
IED= s
1 2
n i=1
∑
(Vi−Si)2
parties involved in an electoral dispute, party A receives 43% of the votes, but 55% of the seats;
party B, 36% of the votes and 36% of the seats; and party C, 21% of the votes, but 9% of the seats, the disproportionality of the specific election in the hypothetical country would be 12.
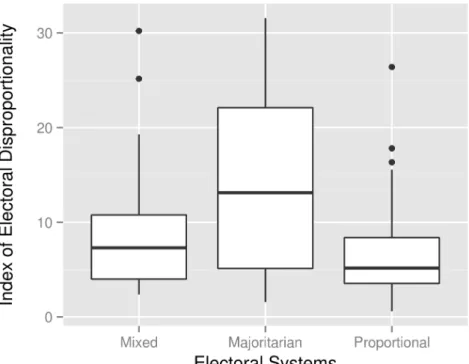
Graph 1: IED by Electoral Systems
Examining the data provided by Gallagher on disproportionality together with the nature of the electoral rules (MAJ, PR, and mixed electoral systems5), it is possible to confront Chang et al.(2010)’s argument and reinforce the decision to use the IED instead of thegross difference between MAJ and PR. Among observations of countries adopting mixed (184), MAJ (111) and PR (190) rules, there is a higher IED mean for MAJ countries (12.5) compared to mixed elec- toral system (8.3) and PR (6.1) countries. However, a greater variation (standard deviation)
5I coded the electoral system into mixed, MAJ, PR system based on the Dataset of Political Institutions (2010): when members of both houses are elected by the majoritarian rules, it is coded 1; when both members of the houses are elected by the proportional rules, 2; otherwise, 0.
within the former: 8.5 against 4.5 and 5.7 for PR and mixed countries, respectively, as can be seen in Graph 1. What may explain these variations, especially in MAJ countries, are factors that, according to the literature of electoral engineering, can also determine the responsiveness of the electoral systems, such as the district magnitude and thresholds. Yet, a more convincing case in favor of the IED lies in the fact that it deals more efficiently with information provided by mixed systems. In many cases, observations of countries with mixed electoral systems are simply ignored or misused. Thus, instead of focusing on formal institutions and used than as a proxy for seats-vote elasticity, I propose to use their specific effect: the level of dispropor- tionality generated by the electoral systems because the results will be more reliable using IED than depending on the gross difference between PR and MAJ.
Graph 2: IED in 59 Countries from 1996 to 2008
Regarding the dependent variable, more clarification is needed. The main interest of this research is to detect the domestic sources of protectionism, guided by a theory that states that the level of protection will rely, among other factors, on how the political system is organized.
In this study, I deal with two measures, the simple mean of applied tariff and the number of tariff
peaks (domestic and international) because my goal is not only to explain the general level of protection, represented by the simple mean of applied tariff, but to understand and explain the phenomena of residual protection, which can be captured by the number of tariff peaks. Tariff peaks, according to the World Trade Organization (WTO), are relatively high tariffs, usually on sensitive products, amidst generally low tariff levels; and are measured in two forms: as international peaks, when duties over 15 percent; and national (or domestic) peaks, when duties over 3 times the average of the tariff structure (WTO, 2012). In this sense, tariff peaks are just a type of residual protection; those tariffs that remain high after a general trade liberalization, targeting specific items and representing an exception compared to the general level of trade protection applied to other items of the same sector, or to the general level of openness applied to the whole domestic market.
Although the aim of this research is to focus on both the general level and the residual protection, I do have a special interest in the latter because since the adoption of the Uruguay Round in the WTO, there has been a general reduction of the average tariff; yet, as the average tariff levels have been decreasing, the use of alternative protective measures – residual protec- tion –, such as quotas, non-tariff barriers, tariff escalation, and phytosanitary standards, have been increasing or stable. Graphs 3 and Graph 4 attempt to picture this dynamic contrasting recent trends in the simple mean of applied tariff and the number of domestic tariff peaks.
That being said, it can be concluded that the simple mean of applied tariff is not the most ac- curate measure to capture the level of protection; relying only on that variable may mislead the research results. In addition, studies have already shown that countries with low average tariffs have high residual protection, confirming theLaw of Constant Protection’s prediction, which informs that there is "evidence of increased non-tariff barriers and administered protection just
Graph 3: Simple Mean of Applied Tariff
Graph 4: Number of Domestic Tariff Peaks
as tariffs had been reduced to new lows" (Mansfield and Busch,1995). More interestingly, this fact may also imply that the average tariff is a result not only of domestic factors, but also rep- resent a systemic trend, obeying the logic of international negotiation on multilateral forums, which, in the long-term, impaired the ability of national governments to independently choose
their tariff rates, while residual protection, such as tariff peaks, viewed as exceptions, may be a more accurate proxy of the pressure – or activity – of interest groups; in other words, a more precise measure of domestic factors. Due to these conceptual and empirical distinctions, I ex- pect to find more reliable results when testing the models with tariff peaks than simple mean of applied tariff as dependent variables.
4 Hypotheses, Model Specification, and Data
The fundamental hypothesis that I propose to test in this preliminary study informs that the IED will influence the general level of trade protection in democratic countries. More specifically, I expect that the higher the IED, the lower the tariff level. Additionally, I intend to evaluate another statement that arises from the central argument. Since presidential democracies have a higher level of IED than non-presidential democracies, it is reasonable to suppose that coun- tries under the former political system will present lower levels of trade protection. The two statements are summarized below:
Hypothesis 1: Democracies with a high level of electoral disproportionality will present lower tariff barriers.
Hypothesis 2: Presidential democracies with high a level of electoral disproportionality will present lower tariff barriers than parliamentary democracies under the same conditions.
The relation between the degree of trade protection in a democracy and the level of elec- toral disproportionality will be analyzed using the full model presented bellow, which will be estimated with the OLS method combined with fixed effects for years, which allow the exam- ination of cross-national variation of protection holding time-variant effects constant. For the
dependent variableProtection, I recur, firstly, to the most common measure of trade protection:
tariff level, more specifically, theSimple Mean of Applied Tariff (World Bank, 2012b), which present mean of 8.8 and standard deviation of 5.7, varying from 0 to 32.8. The total number of tariff peaks adopted by a country each year is also used as an alternative dependent variable (World Bank, 2012a). In the sample, the mean and standard deviation of theNumber of Do- mestic Tariff Peaksis 292.8 and 366.4, varying from 0 to 2272; for theNumber of International Tariff Peaks, the mean is 1565.5, standard deviation 1416.7, varying from 0 to 10900.
Protectionit =β1IEDit+β2Presidentit+β3President∗IEDit+β4Areait+β5Populationit +β6Regionit+β7GDPit+β8Educationit+β9Tradeit+β10Manu f acturingit+β11Agricultureit +β12Serviceit+εit
The variablePresidentis a dummy for presidential democracies, being 0 for non-presidential countries – parliamentary and semi-presidential countries – and 1 for presidential countries.
53.3% of the observations in the sample are indeed of countries with elected presidents. For the IED, already discussed in section 3, I use the updated version compiled byGandrud(2012), who combined Gallagher’s updated data6 7. For the 368 observations in the sample, the IED varies from 0.6 to 31.5, with mean 8.7 and standard deviation of 6.8.
6An updated version is available at http://www.tcd.ie/Political_Science/staff/
michael_gallagher/ElSystems/index.php with data made available by Carey and Hix (2011)
7The countries included by Gandrud are: Argentina, Benin, Croatia, Colombia, Czech Re- public, Ecuador, Guatemala, India, Indonesia, South Korea, Mongolia, the Philippines, Taiwan, Thailand, Turkey, and Venezuela
Table 1: Descriptive Statistics
Variable Mean SD Min Max
Electoral Disproportionality (IED) 8.7 6.8 0.6 31.5
Simple Mean of Applied Tariff 8.8 5.7 0.0 34.2
N.of Tariff Peaks (domestic) 292.8 366.4 0.0 2272
N.of Tariff Peaks (international) 1565.5 1416.7 0.0 10900
GDP per capita 12684.8 11743.4 496.1 49420
Education 8.2 3.2 0.8 13.8
Total Trade 71.3 31.7 14.9 148.3
Area 1602174.9 2895662.8 620 9985000
Population 61281215.5 155346669 147062 1140000000
Manufacturing (%) 30.5 7.8 12.9 62.4
Agriculture (%) 9.9 7.7 0.3 55.4
Service (%) 59.7 9.0 23.3 77.2
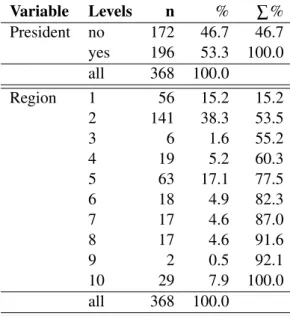
The variablesArea,Population,GDP,Trade,Region,Education,Manufacturing (%),Agri- culture (%), and Service (%) are controls for geographic and economic factors. Except for Region, that is available in Hadenius and Teorell (2005), indicating the geographic location of countries, they were all collected from the World Bank’s World Development Indicators (World Bank, 2012b). ByRegion, according to its codification, democracies are classified as:
(1) Eastern Europe and post Soviet Union (including Central Asia); (2) Latin America (includ- ing Cuba, Haiti and the Dominican Republic); (3) North Africa and the Middle East (including Israel, Turkey and Cyprus); (4) Sub-Saharan Africa; (5) Western Europe and North America (including Australia and New Zealand); (6) East Asia (including Japan and Mongolia); (7) South-East Asia; (8) South Asia; (9) the Pacific (excluding Australia and New Zealand); (10) the Caribbean (including Belize, Guyana and Suriname, but excluding Cuba, Haiti and the Dominican Republic).
Finally, I select democratic countries using the criteria employed by Przeworski et al.
(2000). The authors apply a dicononomous and minimalist concept of democracy, which is defined as "a system in which incumbents lose elections and leave office when the rules so
Table 2: Descriptive Statistics Variable Levels n % ∑%
President no 172 46.7 46.7 yes 196 53.3 100.0 all 368 100.0
Region 1 56 15.2 15.2
2 141 38.3 53.5
3 6 1.6 55.2
4 19 5.2 60.3
5 63 17.1 77.5
6 18 4.9 82.3
7 17 4.6 87.0
8 17 4.6 91.6
9 2 0.5 92.1
10 29 7.9 100.0
all 368 100.0
dictate" (2000, 24). The concept is operationalized as follows: a country is democratic when (1) the Chief Executive is elected by popular vote; (2) the Legislature is elected by the popular vote; (3) there is more than one party disputing power; and (4) alternation in power. When a country fails to meet one of the conditions, it is classified as a dictatorship. An updated version of the dataset is provided by Cheibub, Gandhi and Vreeland (2009). European Union (EU) member countries are excluded from the analysis, as they have adopted a common external tariff, which means that tariffs are the same across all EU member country on each product. In the end, the final sample consists of data from 59 countries8between 1996 and 2008.
8 Countries: Australia, Brazil, Paraguay, Argentina, Bolivia, Japan, Switzerland, United States, Chile, El Salvador, Canada, Colombia, Indonesia, Norway, St Lucia, Uruguay, Belize, Honduras, Mexico, New Zealand, Poland, Senegal, Trinidad and Tobago, Costa Rica,Dominican Republic, India, Nicaragua, Venezuela, Croatia, South Korea, Macedonia, Sri Lanka, Turkey, Albania, Bulgaria, Guatemala, Moldova, Czech Republic, Mauritius, Philip- pines, Romania, Thailand, Ukraine, Benin, Cape Verde, Hungary, Latvia, Lithuania, Peru, Suriname, Bangladesh, Nepal, Papua New Guinea, Guinea-Bissau, and Jamaica.
5 Preliminary Empirical Analysis
A summary of the results is presented in Table 39, where Models 1, 2, and 3 have distinct dependent variables. In model 1, the left-hand-side variable is theNumber of Domestic Tariff Peaks; in Model 2, theNumber of International Tariff Peaks; and in model 3, theSimple Mean of Applied Tariff. In the three models, the right-hand-side variable of interest isIEDandPres- ident. Additionally, a set of variables that identify certain country specific characteristics that could have an effect on the trade-policy outcomes, such asArea, Population,GDP per capita, Education,Total Trade, and the economy structure –Manufacturing;Agriculture, andService –, is included. The results confirm, to some degree, the theoretical predictions, which informs that, holding other factors constant, (1) democracies with highIED will present a lower level of trade protection; and (2) presidential democracies will present lower level of protection than non-presidential democracies.
Examining Table 3 in detail, the first noticeable information is thatIEDhas no effect on the Simple Mean of Applied Tariff. The coefficient in Model 3 is not statistically significant. The fact that theSimple Mean of Applied Tariff may be less sensitive to domestic influence – either governmental macroeconomic policies or domestic lobbies – is a possible interpretation for this scenario. The global trend towards lower tariffs over the past two decades was a direct result of international negotiations, which led to numerous regional agreements and the emergence to the WTO; thus, most national governments engaged in the process had their trade policy bound by thisnew international regulation.
When dealing with the Number of Domestic and International Tariff Peaks, however, the results are different, and, in many aspects, more coherent with the theoretical predictions be-
9The full result can be found in the Appendix, table 4.
Table 3: Regression Results1
Model 1 Model 2 Model 3
(Domestic Peaks) (International Peaks) (Simple Mean Tariff)
Selected Variables‡
log(IED) -0.98∗∗∗ -0.84∗∗ -0.06
(0.26) (0.27) (0.05)
President -4.89∗∗∗ -3.55∗∗∗ -0.58∗∗∗
(0.76) (0.79) (0.15)
President*log(IED) 0.97∗∗ 0.82∗ 0.13∗
(0.33) (0.35) (0.07)
Year-fixed effects Yes Yes Yes
N 368 368 368
R2 0.52 0.36 0.72
adj.R2 0.47 0.30 0.69
Resid. sd 1.90 1.98 0.38
Standard errors in parentheses
‡The full result is presented in the Appendix, table 4.
†significant atp< .10;∗p< .05;∗∗p< .01;∗∗∗p< .001
cause the number of peaks measure protection of sensitive products; is stable, regardless of the global trend towards lower tariffs; and is a more reliable proxy of the activism of domestic lobbies than other tariff-related variables (VanGrasstek, 2001). Substantively, both Models 1 and 2 inform similar results: a 10% increase in the level of electoral disproportionality – the IED– represents a 8% decrease in theNumber of Domestic Tariff Peaksand 7% decrease in the Number of International Tariff Peaks.
Regarding the effect of system of governments on trade protection, although the literature already predicts that presidential democracies tends to present a lower level of trade protec- tion, the consistence and magnitude of the results found in this work are worth mentioning. In the three models, the variablePresidentis statically significant and informs that being a pres- idential democracy can reduce in more than 90% the level of protection for both Number of
Domestic Tariff PeaksandNumber of International Tariff Peaks– 99% and 97%, respectively.
Presidential democracy, however, has lower, but significant impact on Simple Mean of Ap- plied Tariff – 44%. The result is consistent with theliberal presidentapproach (Destler,2005;
Schattschneider,1935); with theaccess point theory(Ehrlich,2007,2011); and with Nielsen’s (2003)presidential power hypothesis. However, the given explanation is a mere extrapolation ofChang et al.(2010)’s formalization of the S-P framework, thus not lying in theconstituency size assumption; in the lower cost of lobbies; nor in delegation. Since presidents are elected by the majoritarian system and the number of seats is one, a 1% increase in the number of votes may represent a 100% increase in the number of seats. In other words, under presidential sys- tems, votes have more value than under non-presidential systems, which empowers consumers, lowering a country’s level of trade protection.
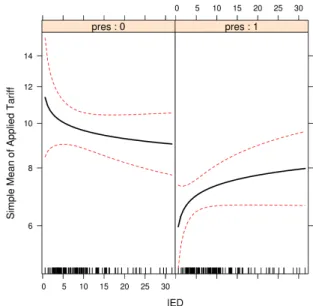
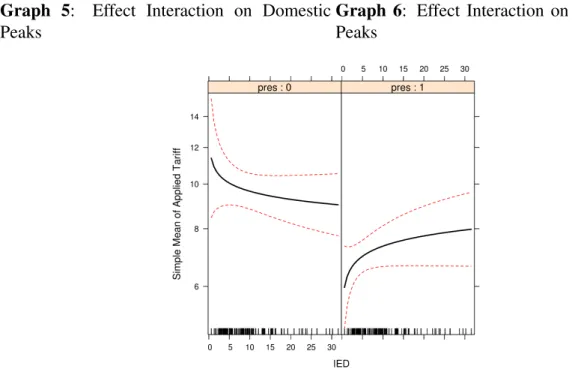
Taking into account the theoretical predictions and the empirical results forIEDandPres- ident, especially on the Number on Domestic and International Peaks reported in Models 1 and 2, I expected that a presidential democracy with high level of electoral disproportionality would provide lower levels of trade protection. As shown in Table 3, however, the interactive termPresident*log(IED)is statistically significant, but informs a different scenario. Analyzing the interaction in a graph display (Graphs 5, 6, and 7), it shows that the IED has no effect on theNumber of Domestic and International Peaksin presidential democracies; however, the theoretical predictions were found in non-presidential democracies because, in these cases, the IEDimpacts as predicted on the theNumber of Domestic and International Tariff Peaks.
These preliminary results may suggest two possible explanations: (1) that legislators under presidential systems are not concern – or are unable to deal with – trade-related issues; or (2) that under presidential systems, the very president would be able to assure lower levels of pro-
tection, making the work of legislators ineffective or unnecessary. This perspective confirms, in some degree, theaccess point theory, especially in the scenario of a strong presidency. The topic, however, demands a more careful examination.
Graph 5: Effect Interaction on Domestic Peaks
Graph 6: Effect Interaction on International Peaks
Graph 7: Effect Interaction on Simple Mean
Finally, relying on thegross differencebetween electoral systems, classified into three cat- egories, MAJ, PR, and mixed, it is possible to assert that the level of trade protection is not
embedded in MAJ systems, reinforcing the argument that the mechanism may lie in the seats- votes elasticity measured by theIED. Based on the results on Table 5 in the Appendix, which were estimated as the previous models, but using two different samples10, and a distinct pri- mary explanatory variable – electoral systems, having MAJ as the reference category –, MAJ countries did not show a higher level of protection than PR countries; on the contrary, when examining theNumber of Domestic and International Peaksfor both samples – Models 1, 2, 4, and 5 –, being a PR country increases the number of peaks when compared to MAJ countries;
and the results were not significant for theSimple Mean of Applied Tariff. In the case of mixed system, it does present lowerSimple Mean of Applied Tariff than MAJ countries, but the results concerning theNumber of Domestic and International Peaksare not statistically significant.
A better way to examine these results is to look at its graphic display11. Graph 8 and Graph 9 represent the effect of Electoral Systems on theNumber of Domestic and International Tariff Peaks; and both have the same pattern, with PR countries presenting higher number of tariff peaks, regardless of the difference in the confidence intervals, represented by the broken lines.
Graph 10 shows the effect of electoral system on theSimple Mean of Applied Tariff. Though the simple mean is slightly higher in MAJ countries, the level of confidence does not allow to much conclusion on the issue.
In sum, and despite the need of more robust checks, the preliminary results provide hints on a distinct perspective to evaluate the relation between representation and trade protection based on an underevaluated mechanism. So far, the findings indicate that democracies with a higher level of electoral disproportionality – highIED – will indeed present lower level of residual protection, measured by theNumber of Domestic and International Tariff Peaks. The
10Models 1, 2, and 3 were estimated using the original sample (N = 368); and Models 4, 5, and 6, based on a larger sample (N = 483), but from the same period, 1996 to 2008
11Based on Models 4, 5, and 6, from Table 5 in the Appendix.
results also reinforce the thesis that presidential democracies may be more prone to adopt lower trade protection than non-presidential ones. The argument, however, is not based on the size of its constituency, but due to the level of disproportionality imposed by electoral rules. More interestingly, it points out to an interaction between the theIEDand the type of political system not yet analyze in-depth by scholars.
Graph 8: Effect Electoral System on D.Peaks Graph 9: Effect Electoral System on I.Peaks
Graph 10: Effect Electoral System on Simple Mean
A Appendix
Table 4: IED as Primary Independent Variable
Model 1 Model 2 Model 3
(Domestic Peaks) (International Peaks) (Simple Mean Tariff)
Intercept -1176.91† -495.36 103.07
(632.83) (662.56) (126.97)
log(IED) -0.98∗∗∗ -0.84∗∗ -0.06
(0.26) (0.27) (0.05)
President -4.89∗∗∗ -3.55∗∗∗ -0.58∗∗∗
(0.76) (0.79) (0.15)
President*log(IED) 0.97∗∗ 0.82∗ 0.13∗
(0.33) (0.35) (0.07)
log(Area) 0.01 -0.53 -0.05
(0.58) (0.60) (0.12)
log(Population) 0.73∗∗∗ 0.58∗∗∗ -0.00
(0.16) (0.17) (0.03)
log(GDP Per capita) -0.21 1.27∗∗ 0.15†
(0.43) (0.45) (0.09)
Education 0.02 0.04 0.00
(0.10) (0.10) (0.02)
Trade flow 0.02∗∗ 0.01 0.00
(0.01) (0.01) (0.00)
Manufacturing(%) 11.73† 4.75 -1.05
(6.33) (6.62) (1.27)
Agriculture(%) 11.73† 4.86 -1.03
(6.33) (6.63) (1.27)
Service(%) 11.78† 4.85 -1.03
(6.33) (6.63) (1.27)
Year-fixed effects Yes Yes Yes
N 368 368 368
R2 0.52 0.36 0.72
adj.R2 0.47 0.30 0.69
Resid. sd 1.90 1.98 0.38
Standard errors in parentheses
†significant atp< .10;∗p< .05;∗∗p< .01;∗∗∗p< .001
Table 5: Electoral Systems as Primary Independent Variables
Model 1 Model 2 Model 3 Model 4 Model 5 Model 6 (Domestic (International (Simple (Domestic (International (Simple
Peaks) Peaks) Mean) Peaks) Peaks) Mean)
(Intercept) −895.33 −206.79 137.49 −942.75 −249.11 122.37
(616.80) (554.22) (123.99) (627.81) (566.13) (125.12)
PR 1.23∗ 0.72 −0.16 1.57∗∗∗ 1.21∗∗ −0.00
(0.58) (0.52) (0.12) (0.46) (0.42) (0.09)
Mixed −0.55 −0.91† −0.36∗∗∗ 0.63 −0.60† −0.22∗∗
(0.52) (0.47) (0.11) (0.39) (0.35) (0.08)
President −2.13∗∗∗ −4.65∗∗∗ −0.66∗∗∗ −1.02∗ −2.37∗∗∗ −0.18∗
(0.62) (0.56) (0.12) (0.46) (0.41) (0.09)
President*PR −1.33† 3.98∗∗∗ 0.35∗ −2.01∗∗ 1.67∗∗ −0.07
(0.78) (0.70) (0.16) (0.64) (0.58) (0.13)
President*Mixed −0.81 2.93∗∗∗ 0.53∗∗∗ −1.64∗∗ 1.20∗ 0.08
(0.72) (0.64) (0.14) (0.58) (0.53) (0.12)
Log(Area) −0.27∗ 0.04 0.14∗∗∗ −0.40∗∗∗ −0.04 0.12∗∗∗
(0.11) (0.10) (0.02) (0.09) (0.08) (0.02)
log(Population) 0.72∗∗∗ 1.04∗∗∗ −0.02 0.93∗∗∗ 0.98∗∗∗ −0.05†
(0.17) (0.15) (0.03) (0.14) (0.12) (0.03)
log(GDP per capita) −0.02 1.28∗∗ 0.17† 0.65∗ 1.40∗∗∗ 0.12†
(0.43) (0.39) (0.09) (0.31) (0.28) (0.06)
Education −0.26∗ −0.15 −0.02 −0.00 −0.18∗ −0.04∗
(0.11) (0.10) (0.02) (0.08) (0.07) (0.02)
Total trade 0.02∗∗∗ 0.02∗∗∗ −0.00 0.02∗∗∗ 0.01∗∗∗ −0.00
(0.01) (0.01) (0.00) (0.00) (0.00) (0.00)
Manufacturing (%) 8.90 1.79 −1.39 9.27 2.22 −1.22
(6.17) (5.54) (1.24) (6.28) (5.66) (1.25)
Agriculture (%) 8.86 1.85 −1.37 9.31 2.32 −1.21
(6.17) (5.54) (1.24) (6.28) (5.66) (1.25)
Service (%) 8.95 1.89 −1.37 9.30 2.32 −1.21
(6.17) (5.54) (1.24) (6.28) (5.66) (1.25)
Year-fixed effects Yes Yes Yes Yes Yes Yes
N 368 368 368 483 483 483
R2 0.54 0.55 0.73 0.51 0.49 0.70
adj.R2 0.49 0.51 0.70 0.47 0.45 0.68
Resid. sd 1.86 1.67 0.37 1.90 1.72 0.38
Standard errors in parentheses
†significant atp< .10;∗p< .05;∗∗p< .01;∗∗∗p< .001
References
Borisyuk, Galina, Colin Rallings and Michael Thrasher. 2004. “Selecting Indexes of Electoral Proportionality: General Properties and Relationships.”Quality & Quantity38(1):51–74. 8
Carey, John M and Simon Hix. 2011. “The Electoral Sweet Spot: Low-Magnitude Proportional Electoral Systems.”American Journal of Political Science55(2):383–397. 15
Chang, Eric C. C., Mark Andreas Kayser, Drew A. Linzer and Ronald Rogowski. 2010. Elec- toral Systems and the Balance of Consumer-Producer Power. Cambridge University Press.
6,7,8,9,10,20
Cheibub, Jose Antonio, Jennifer Gandhi and James Raymond Vreeland. 2009. “Democracy and dictatorship revisited.”Public Choice143(1-2):67–101. 17
Cingranelli, David and Mikhail Filippov. 2010. “Electoral Rules and Incentives to Protect Human Rights.”The Journal of Politics72(01):243–257. 3
Destler, I. M. 2005. American Trade Politics, Fourth Edition. 4 ed. Institute for International Economics. 3,20
Ehrlich, Sean. 2009. “Constituency Size and Support for Trade Liberalization: An Analysis of Foreign Economic Policy Preferences in Congress.”Foreign Policy Analysis5(3):215–232.
5
Ehrlich, Sean D. 2007. “Access to Protection: Domestic Institutions and Trade Policy in Democracies.”International Organization61(03):571–605. 20
Ehrlich, Sean D. 2011. Access Points: An Institutional Theory of Policy Bias and Policy Com- plexity. Oxford University Press, USA. 5,20
Epstein, David and Sharyn O’Halloran. 1996. “The partisan paradox and the U.S. tariff, 1877- 1934.”International Organization50(02):301–324. 3
Evans, Carolyn L. 2009. “A Protectionist Bias in Majoritarian Politics: an Empirical Investiga- tion.”Economics & Politics21(2):278–307. 4
Gallagher, Michael. 1991. “Proportionality, disproportionality and electoral systems.” Elec- toral Studies10(1):33–51. 9
Gandrud, Christopher. 2012. “Two Sword Lengths: Losers’ Consent and Violence in National Legislatures.”SSRN eLibrary. 15
Garland, Marshall W. and Glen Biglaiser. 2009. “Do Electoral Rules Matter?” Comparative Political Studies42(2):224 –251. 3
Hadenius, Axel and Jan Teorell. 2005. “Cultural and economic prerequisites of democracy:
Reassessing recent evidence.” Studies in Comparative International Development (SCID) 39(4):87–106. 16
Haggard, Stephan and Robert R. Kaufman. 1995. The Political Economy of Democratic Tran- sitions. Princeton University Press. 3
Hankla, Charles R. 2006. “Party Strength and International Trade.” Comparative Political Studies39(9):1133 –1156. 4
Karol, David. 2007. “Does Constituency Size Affect Elected Officials’ Trade Policy Prefer- ences?”Journal of Politics69(2):483–494. 5
Keefer, Philip. 2010. “Database of Political Institutions (DPI).”.
URL:http://go.worldbank.org/2EAGGLRZ40 10
Knutsen, Carl Henrik. 2011. “Which democracies prosper? Electoral rules, form of government and economic growth.”Electoral Studies30(1):83–90. 3
Kono, Daniel Y. 2006. “Optimal Obfuscation: Democracy and Trade Policy Transparency.”
American Political Science Review100(03):369–384. 3
Kunicová, Jana and Susan Rose-Ackerman. 2005. “Electoral Rules and Constitutional Struc- tures as Constraints on Corruption.” British Journal of Political Science 35(04):573–606.
3
Lijphart, Arend. 1990. “The Political Consequences of Electoral Laws, 1945-85.”The Ameri- can Political Science Review84(2):481. 8
Linzer, Drew A. and Ronald L. Rogowski. 2008. “Lower Prices: The Impact of Majoritarian Systems in Democracies Around the World.”The Journal of Politics70(01). 6
Lohmann, Susanne and Sharyn O’Halloran. 1994. “Divided Government and U.S. Trade Pol- icy: Theory and Evidence.”International Organization48(4):595–632. 3
Mansfield, Edward D., Helen V. Milner and B. Peter Rosendorff. 2000. “Free to Trade:
Democracies, Autocracies, and International Trade.”The American Political Science Review 94(2):305–321. 3
Mansfield, Edward D. and Marc L. Busch. 1995. “The Political Economy of Nontariff Barriers:
A Cross-National Analysis.”International Organization49(04):723–749. 4,13
McGillivray, Fiona. 2004. Privileging Industry: The Comparative Politics of Trade and Indus- trial Policy. Princeton University Press. 4
Milner, Helen V. and Keiko Kubota. 2005. “Why the Move to Free Trade? Democracy and Trade Policy in the Developing Countries.”International Organization59(01):107–143. 3
Nielson, Daniel L. 2003. “Supplying Trade Reform: Political Institutions and Liberaliza- tion in Middle-Income Presidential Democracies.” American Journal of Political Science 47(3):470–491. 4,20
Persson, Torsten and Guido Tabellini. 2005. The Economic Effects of Constitutions. The MIT Press. 3
Persson, Torsten, Guido Tabellini and Francesco Trebbi. 2003. “Electoral Rules and Corrup- tion.”Journal of the European Economic Association1(4):958–989. 3
Przeworski, Adam, Michael E. Alvarez, Jose Antonio Cheibub and Fernando Limongi. 2000.
Democracy and Development: Political Institutions and Well-Being in the World, 1950-1990.
1 ed. Cambridge University Press. 16,17
Rickard, Stephanie J. 2010. “Democratic differences: Electoral institutions and compliance with GATT/WTO agreements.” European Journal of International Relations 16(4):711 – 729. 4
Rickard, Stephanie J. 2012. “A Non-Tariff Protectionist Bias in Majoritarian Politics: Govern- ment Subsidies and Electoral Institutions1.”International Studies Quarterly56(4):777–785.
URL:http://onlinelibrary.wiley.com/doi/10.1111/j.1468-2478.2012.00760.x/abstract 4
Rogowski, Ronald. 1987. “Trade and the Variety of Democratic Institutions.” International Organization41(2):203–223. 4
Rogowski, Ronald, Eric C. C. Chang and Mark Andreas Kayser. 2008. “Electoral Systems and Real Prices: Panel Evidence for the OECD Countries, 1970-2000.”British Journal of Political Science38(4):739–751. 6
Rogowski, Ronald and Mark Andreas Kayser. 2002. “Majoritarian Electoral Systems and Con- sumer Power: Price-Level Evidence from the OECD Countries.”American Journal of Polit- ical Science46(3):526–539. 6
Schattschneider, E. E. 1935.Politics, pressures and the tariff;: A study of free private enterprise in pressure politics, as shown in the 1929-1930 revision of the tariff,. Prentice-Hall. 3,20
Taagepera, Rein. 1986. “Reformulating the Cube Law for Proportional Representation Elec- tions.”The American Political Science Review80(2):489. 8
Taagepera, Rein and Bernard Grofman. 2003. “Mapping the Indices of Seats–Votes Dispropor- tionality and Inter-Election Volatility.”Party Politics9(6):659–677. 8
VanGrasstek, Craig. 2001. The Political Economy of Residual Protection in the Trade Regime of the United States of America: A Report Prepared for the United Nations Conference on Trade and Development. UN. 19
Weinberg, Joe. 2012. “Do Majoritarian Electoral Systems Favor Consumers: Identifying Cross- National Consumer Bias1.”International Studies Quarterly56(4):820–826. 8
Wintrobe, Ronald. 2000. The Political Economy of Dictatorship. 1 ed. Cambridge University Press. 3
World Bank, World Bank. 2012a. “Trade Analysis and Information System (TRAINS) and
World Integrated Trade Solution) (TWITS).” http://wits.worldbank.org/wits.
URL:http://wits.worldbank.org/wits 15
World Bank, World Bank. 2012b. “The World dataBank (World Development Indicadors.”.
URL:http://data.worldbank.org/ 15,16
WTO, World Trade Organization. 2012. “Glossary.”
http://www.wto.org/english/thewto_e/glossary_e/tariff_peaks_e.htm. 12