Thanks to engineer Jo ˜ao Marques for all the support during the instrumentation and all the wise advice in programming and using sensors. Thanks also to professors and PhD students from Laborat ´orio de Ensaios Mec ˆanicos e de Materiais of the Mechanical Department for the use of facilities and equipment. To my family, for the love, kindness and presence throughout my academic life and all the happiness they displayed when I briefly explained my confusion work to them.
Nomenclature
Glossary
Introduction
- Motivation
- Aircraft Design, Scaling and Testing
- Objectives and Deliverables
- Thesis Outline
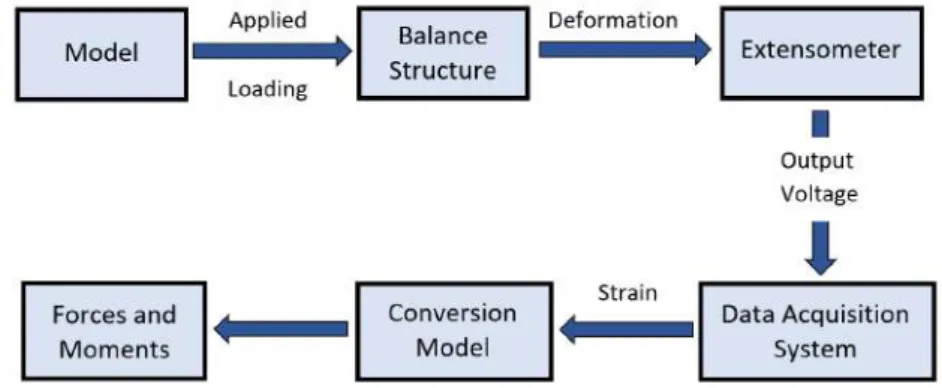
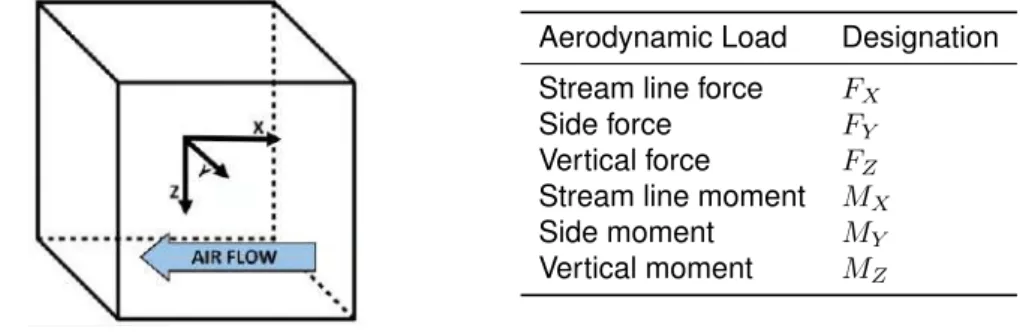
If some analysis of the aircraft is to be done numerically, a mathematical model is required. As shown earlier, wind tunnels are one of the most important experimental facilities, and an aerodynamic force balance is an essential instrument in aeronautical testing. The force balance must be able to achieve the three components of the aerodynamic forces (vertical, horizontal and lateral) and the aerodynamic moments (pitch, roll and yaw).
![Figure 1.1: The design wheel. Adapted from [1].](https://thumb-eu.123doks.com/thumbv2/123dok_br/19768375.0/28.892.257.637.618.775/figure-1-1-the-design-wheel-adapted-from.webp)
State of The Art
Wind Tunnels
- Open Circuit Wind Tunnel
- Closed Circuit Wind Tunnel
- Wind Tunnel Tests
This type of wind tunnel consists of an inlet, a test section, a diffuser, a fan section and an exhaust. These wind tunnels have the main advantage of lower acquisition cost requiring less material and since this construction is lighter than the closed loop wind tunnel. Through this technique, it is easy to identify areas of turbulence at a glance. a) Bushing and oil test in wind tunnel model.

Wind Tunnel Force Balances
In Figure 2.4 (b) a velocity field at a trailing edge of a wing is represented. a) Schematic of a typical PIV measurement system [7]. This introduces mechanical problems to the system due to the fact that there are two rods connected to each joint. This double joint is very difficult to manufacture and to ensure that there are no interference phenomena between the two bars connected to the joint is even more difficult.
Aircraft Model
- Aircraft Aerodynamics, Stability and Control
- Aircraft System Identification
A disturbance in the forces and moments acting on the aircraft may be a direct response to a change in motion or control surfaces. Forces and moments can be expressed in terms of state variables, such as linear velocities (u,v,w) and angular velocities (p,q,r). Lateral movement is characterized by a movement without loss of symmetry in the x-y plane of the plane.
Mechanical Design
- Requirements and Start-up Phase
- Wind Tunnel Specifications
- Testing Scenarios
- Load Set For Both Test Cases
- Design Review
- Mechanical Load Limits and Acceptable Displacements
- Computational Structural Analysis
- New Considerations and Additional Parameters
- Mesh Parameters and Convergence Study
- Simulation Results
- New Parts Design
- Sensing Bar Sizing
- Moving Platform, Flange and Strut
- Complete New Balance Assembly
- Structural Numerical Simulation
- Analytical Model and Application
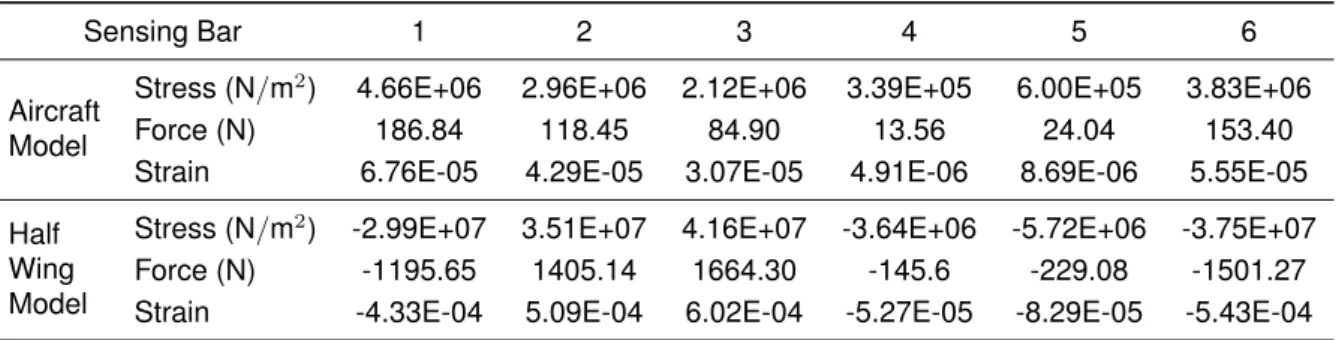
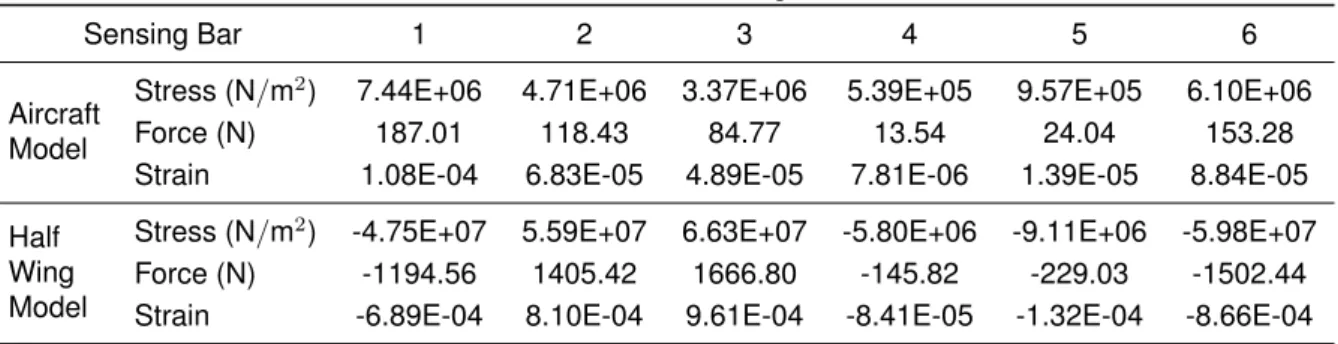
A schematic representation of this model aircraft is shown in Figure 3.3, and the model and airflow characteristics are detailed in Table 3.4. In the case of the half-wing design, the set loads correspond to the forces and moments obtained from the preliminary analyzes of the half-wing. The basic design of the force balance is the previous work done by Jo ˜ao Fernandes [18].
The top of the force balance makes the connection between the model and the Stewart platform. Force balance design depends on two design specifications: limit loads and allowable displacements. The critical mechanical parts of the force balance are the sensing rods, the extent of which will be measured and the strain will be calculated ().
Therefore, the first task was to reassemble each part of the balance of forces in accordance with the new one. In Figure 3.6, the simplified force balance structure is shown for both cases (plane and half-wing model) with applied loads. a) Force balance model for model aircraft. As such, the thickness of 0.5 mm was found to be inadequate for the required strength balance treatment.
To derive the equation that converts the sensing rod forces to moments applied to the.
Instrumentation
- Background and Purchased Instruments
- Strain Sensors
- Air Speed Sensor
- Temperature Sensor
- Attitude Sensor
- Data Acquisition System
- Strain Gauge
- Placement on the Sensing Bar
- Calibration of Each Sensing Bar Strain Gauge System
- Arduino Solution
- Speed, Temperature and Attitude Sensor Setup
- Coupling of the Three Sensors
- Strain Gauge Signal Amplification Tests
- Data Acquisition NI 9237 Board
- User Interface
To obtain the speed of air flow in the test section, a differential pressure sensor is required. The angles of the model relative to the airflow indicate the model's attitude. Weld a cable to each wire outlet of the strain gauge and attach it to the rod. A).
The duration of the step also depends on the inertia of the sensing rod together with the weight probe. The strain values for each increment are averaged in the most uniform part, the last 30-50 seconds of the time step. As expected, the response of the stress is not exactly linear, but is close for the six observation bars.
The R2 of the three types of regression for each detection bar are shown in Table 4.1. The complete connections of the strain gauge acquisition system using an Arduino, aHX711 modules and a half bridge are shown in Figure 4.15 (a). This translates to the high accuracy of the strain gauge, which introduces small voltage variations despite the sensor bar being static.
This op-amp was connected to the bridge read pins and Vout to an analog input on the Arduino.
![Figure 4.1: Schematic representation of strain gauge series 1-LY1 by HBM [22].](https://thumb-eu.123doks.com/thumbv2/123dok_br/19768375.0/60.892.397.512.106.240/figure-schematic-representation-strain-gauge-series-ly1-hbm.webp)
Manufacturing and Assembly
- Overview
- In House Manufactured Parts
- Sensing Bars
- Flange
- Pitot Tube Support
- Bill of Materials
- Assembly
- Mechanical
- Electrical
- Finalisation of the Aerodynamic Force Balance
The first step is to cut the tube to the correct length of the sensor rod plus a small tolerance. This cut is made with a hacksaw and the precision of the cut is not important. The next operation is also done on the lathe to reduce the center part of the detection bar by means of grooves.
The fixing part connects the plate to the table, and the pitot tube is placed on top of the plate. The highest cost is the electrical parts, and the data acquisition system is the most expensive component of the power balance. The lower base of the power balance was completed with the fixed platform and the 6 correspondent couplers.
The mark of each detection rod is made in the middle of the insulating tube. A good fit of the rod end bearing and sensing rod is critical because rotational movements can cause this system to loosen. A pitot tube is placed on top of the plate with a direction parallel to the flow lines.
The two tubes connecting the pitot tube to the pressure sensor were glued to the side of the plate not in direct contact with the flow to reduce drag and turbulence. mounting the Pitot tube on the plate and placing the tube. a) Storage of instruments and cables.

Calibration
- Calibration Methodology
- Ordinary and Weighted Least Squares Method Formulation
- Weighted Scheme
- Goodness of Fit
- Calibration Procedure
- Calibration Apparatus and Setup
- Calibration Results
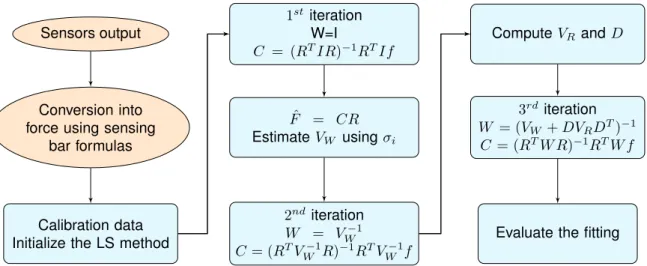
However, a calibration set of all possible combinations between aerodynamic components in the desired force balance operating range is an unrealistic approach. Equation (6.9) is a solution of normal least squares equations [30], which complements the system presented in equation (6.3) and defines the calibration model. The result of solving weighted normal least squares equations is a weighted least squares estimator.
The elements are based on the uncertainties of the weights used in the loading sequence and an estimate of the uncertainties caused by the calibration system. Each element of the diagonal corresponds to the coefficients of the corresponding aerodynamic force component. The least squares method meets the hypothesis that by minimizing the sum of square errors (ssE), the optimal fit of the data is obtained.
The errors can in turn be described as the deviation of the data observations (fi) and the estimated values from the fit function (fˆi) [34]. As mentioned, the first iteration requires the use of the identity matrix asW to enable the estimation of the standard deviation, Equation (6.13). The separation of the weighted scheme, Equation (6.12), is useful to quantify the improvement of the fit.
In the Z direction, weights can be applied directly on the force balance.
Testing
Experimental Procedure
- Experimental Apparatus
- Procedure Guide
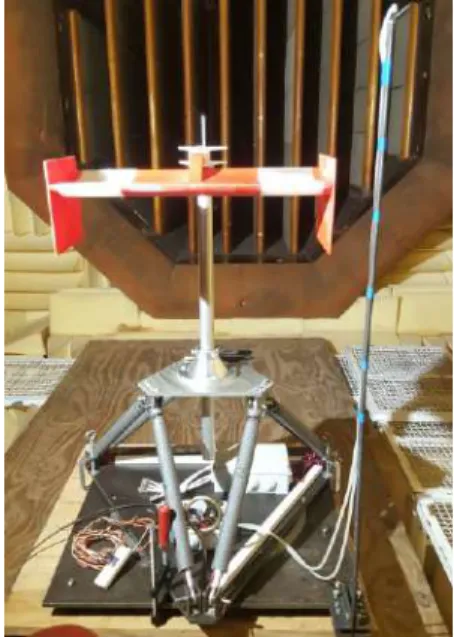
Place the aerodynamic force balance inside the wind tunnel test near the nozzle and on an additional structure to place the tip of the flange exactly below the lower edge of the nose;. Align the force balance with the nozzle so that the X-axis of the force balance is parallel to the nose's axis of symmetry. Then level the moving platform by adjusting the rubber supports at the bottom of the force balance, use a level or similar at all ends;.
Then run the attitude sensor calibration script with the sensor at the current position of the top surface and aligned with the side of the surface. Set the desired angle of attack using the pitch value of the attitude sensor as a reference. The rotating collar is secured with three clamps at each corner of the mounting platform.
If the position of the model during the experiment is a parameter of the study, the sensor should be placed in a part of the model that does not affect its aerodynamics (if possible inside the model). Place the pitot tube mount on the front of the force balance and adjust the height to ensure there is no flow disturbance between the plate and the model. Open the LabVIEWTM file and verify that the first psychic channel corresponds to the DAQ board with a detectable line and the second physical channel to the second and verify the order of the channels in each physical channel.
Remove the test model and repeat the correct sequence to obtain the contribution of the structure under the influence of flow to the forces and moments.
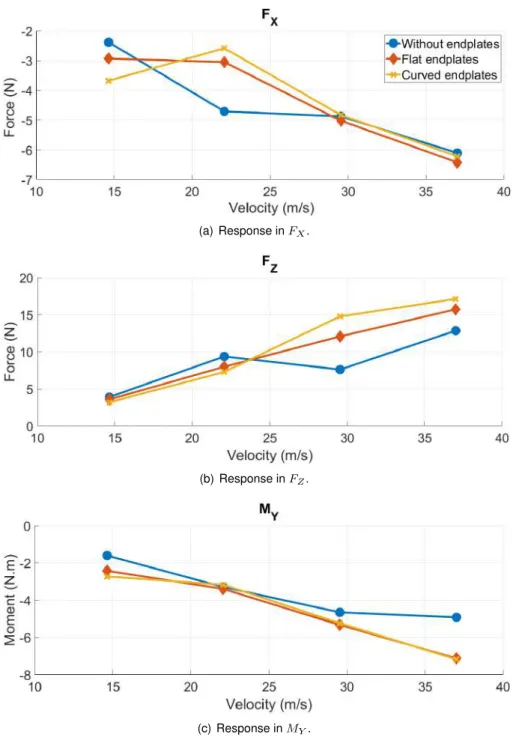
FST Rear Wing Demonstration
The length of the support arm is used to remove the contribution of the FZ for now, only the contribution of the wing geometry is required. Unfortunately, the last step of the procedure guide was not followed due to the time available to use the wind tunnel facilities. Therefore, drag values and drag coefficients cannot be interpreted in magnitude, because the influence of the force balance structure is correlated in the values.
However, it is possible to analyze the tendency of the values as well as the quantities with the same velocity or Reynolds number, the influence of the structure is the same if the same conditions are used. From the results obtained for CL and CD during speed variation, it is observed that the Reynolds number strongly affects the performance of the end plates. Further studies should be carried out to detail the effect of speed on the various rear wings and to analyze the range of speeds at which the racing car operates to achieve the results.
The use of simple loads in the calibration may be at the origin of the variation in the magnitude values. To validate the previous conclusions, a simple static test was performed to analyze the force balance response. This test consists of three 5N weight increments on the top of the balance, exactly the same procedure as that used in the static calibration of the FZ component.
This test demonstrates the good response of the aerodynamic force balance when simple axial loads are applied and shows the good accuracy of the force balance.
Conclusions
Achievements
Future Work
Bibliography
29] AIAA.Recommended Practice: Calibration and use of internal strain gauge balances with application to wind tunnel testing.
Appendix A
The selected rod end bearings are made by INA/FAG: the GAL8-UK and GAR8-UK, the former being a rod end bearing with left-hand male thread, and the latter a rod end bearing with right-hand male thread. The new convergence analysis for aircraft model force balance is shown in Figure A.5, revealing the total strain energy and time evolution during mesh refinement.
![Figure A.3 shows the response in C l of NACA 4412 airfoil to angles of attack from −10 ◦ to 20 ◦ , using XFLR5 v6.40 [17] as software.](https://thumb-eu.123doks.com/thumbv2/123dok_br/19768375.0/108.892.275.617.171.421/figure-shows-response-airfoil-angles-attack-xflr5-software.webp)
Appendix B
Technical Drawings
Appendix C
Technical Datasheets
Strain Gauges 1-LY13-6/350
Appendix D
Sensing Bar Strain Gauge System Calibration
Appendix E
Weighted Scheme Matrices
Calibration Loading values
Coefficients Matrix
Fitting Values for the Calibration Loading
![Figure 1.3: Multi-element grid with hexahedral, prism, pyramid and tetrahedral elements [5].](https://thumb-eu.123doks.com/thumbv2/123dok_br/19768375.0/29.892.226.669.673.946/figure-multi-element-hexahedral-prism-pyramid-tetrahedral-elements.webp)
![Figure 1.4: Force and moment comparison between experimental (–) and computational (◦ – ◦) for a CRM aircraft [5].](https://thumb-eu.123doks.com/thumbv2/123dok_br/19768375.0/30.892.148.738.176.624/figure-force-moment-comparison-experimental-computational-crm-aircraft.webp)