First of all, I would like to thank my supervisor, Professor Andr ´e Marta, for the wise guidance and patience during the last months, even when things seemed to fail to go as planned. I would like to thank my friends Marta for all the support and advice and Rute for the workplace and all the useful writing tips, with whom I share the adventures of working in a demanding master's thesis.
Nomenclature
Glossary
Introduction
- Motivation
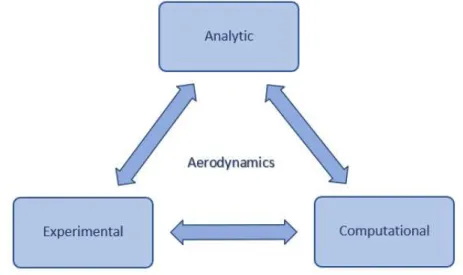
- The Role of Experimental Aerodynamic Testing
- Objectives and Deliverables
- Thesis Outline
Figure 1.4 shows a model of the DLR F-19 being tested in the Braunschweig low-speed wind tunnel (DNW-NWB), located at the DLR (Das Deutsche Zentrum f ¨ur Luft- und Raumfahrt) site in Germany. First of all, it is necessary to identify the measurement requirements of force balance to select the most adequate concept.
State of The Art
Wind Tunnels
- Open Circuit Wind Tunnels
- Closed Circuit Wind Tunnels
Due to the lower construction cost, this type of wind tunnel is suitable for schools or universities, for academic purposes [1]. Analogously, it is possible to ascertain the main advantages and disadvantages of this type of wind tunnel.
![Figure 2.1: Open circuit wind tunnel of Diamler-Benz Aerospace Airbus [1]](https://thumb-eu.123doks.com/thumbv2/123dok_br/19768384.0/32.892.264.622.108.384/figure-open-circuit-tunnel-diamler-benz-aerospace-airbus.webp)
Force Balances
- External Configuration
- Internal Configuration
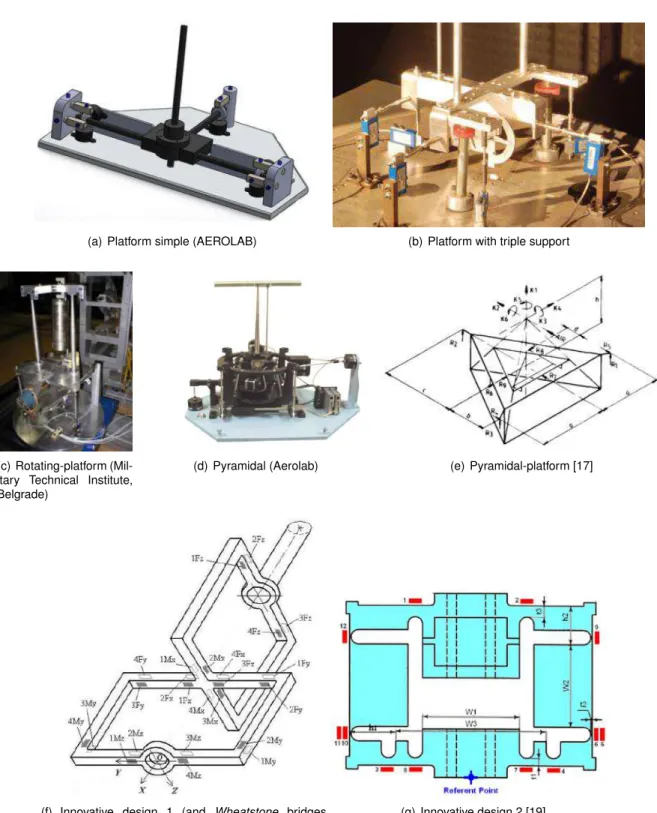
As for the remaining types of external force balances (platform, yoke and pyramid), they allow testing the support assembly of the model and differ in the assembly method. However, this type of force balance presents some structural deformations due to the large span of the measuring and support arm.

Sensors and Data Acquisition Systems
- Load Sensors
- Velocity Sensors
- Attitude Sensors
- Data Acquisition Systems (DAQ)
Connected to the other end of the manometer, there is a static pressure tube that measures. The first (β) is the angle between the longitudinal axis of the model and the flow direction in the horizontal plane (figure 2.12).
Requirements and Conceptual Analysis
Wind Tunnel Specifications
The triangular structure at the bottom and top is part of the anechoic chamber and works as an isolator. Above this structure, at the bottom, and fixed to the ground is a metal net that provides support for objects and a path to walk on.
Testing Scenarios
- Half Wing Model
- Full Aircraft Model
- Limit Loads and Displacements
In this case, we considered that it is placed on the trailing edge at an angle of 10◦ and that it is placed around 65% of the chord, as shown in Figure 3.7. It is quite common to test half-wing models by attaching the half-wing root and fitting. Although we do not know the exact position, it is located between the center of the wing and the fuselage.
In this case, we will consider the borderline situation of placing it in the middle of the half-arm, because it is a critical situation.
Concept Selection
- Selection Methodology
- Stewart Platform
In order to ensure the integrity of the force balance structure, it is also important to limit the linear displacement. Robustness (A) Assesses the strength and integrity of a balance of forces when subjected to various types of test conditions; Wind tunnel attachment (H) Evaluates the ease of installation of the force balance in the wind tunnel;.
This forces the connection of the two bars as close to the virtual vertex as possible.
Mechanical Design
Computational Structural Model
In terms of element type and considering the use of a high-quality mesh, tetrahedral parabolic solid elements will be used to discretize the domain by adopting a curvature-based mesh that will automatically refine the mesh near bends and edges of the structure. To evaluate the influence of the mesh size on the analysis results and considering the maximum load range expected for the test with the planar model acting in force balance and using coarser and finer meshes, it is possible to a certain point is fixed. in the structure (near the column region where the stress values are highest) and plot the variation of stress and displacement with the number of elements, as shown in Figures 4.3(a) and 4.3(b), respectively. a) Variation of stress with the number of elements (b) Variation of displacement with the number of elements. An analysis of both graphs (figure 4.3) leads to the conclusion that from a certain number of elements (approximately 80000) onwards, the stress and displacement values do not change significantly.
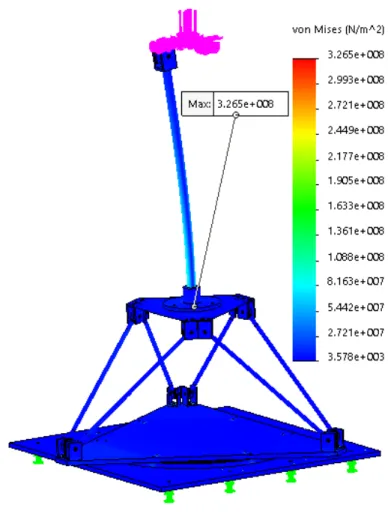
Considering the maximum load range previously found for the full aircraft model (table 3.10) and applying it to the preliminary design of the force balance, we obtain the stress results presented in figure 4.4.
Sizing and Material Selection
- Strut and Flange
- Fixed Platform
- Sensing Bars
- Rod End Bearing
- Moving Platform
- Coupler
- Sideslip Angle Adjustment: Rotating Platform
- Angle of Attack Adjustment
- Complete Assembly
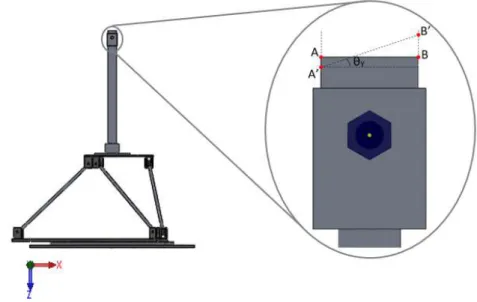
The schematic representation of the displacements at the ends of the mechanism is shown in Figure 4.7. It can be concluded that increasing the outer diameter of the strut is a good strategy to decrease the rotation values. Again, the mass values correspond to the height of the strut with a length of 400 mm.
This value of normal stress is of particular importance because it will be used to assess the structural integrity of the rod end bearings.
Computational Structural Analysis
Figures 4.22(a) and 4.22(b) show the stress distribution in the force balance while the associated load range for the half wing models shown in Table?. As for Figures 4.23(a) and 4.23(b), they represent the stress distribution in the force balance while applying the associated maximum load range for the complete aircraft model shown in Table??. Comparing the two test scenarios, the half wing and the full plane, the maximum stress values occur for the half wing model.
This makes sense as the order of magnitude for the expected values of forces and moments for the wing are significantly higher than the model aircraft values.
Sensors and Instrumentation
Strain Gauges
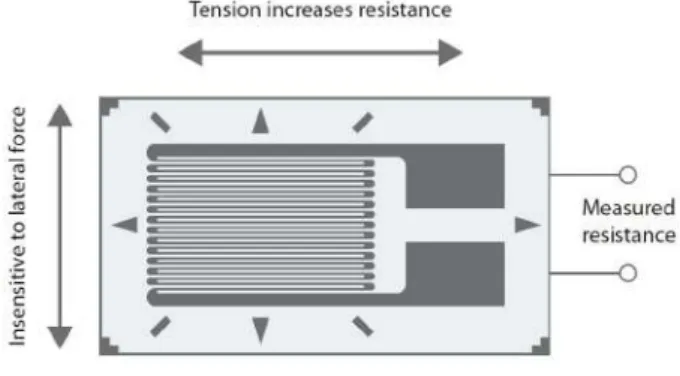
Ideally, the best option would be cable strain gauges, as they would simplify the assembly process and connection to the data acquisition system, however, this solution is very expensive. Based on this, lead strain gauges were found to be the best solution, as they are cheaper than prewired ones and easier to use when compared to solder pad strain gauges. As previously mentioned in section 2.3.1, to maximize the measuring efficiency of the strain gauges, they will be connected as a Wheatstone bridge where one pair of strain gauges will measure the axial strain of the bar and the other pair will measure the tangential displacement of the bar .
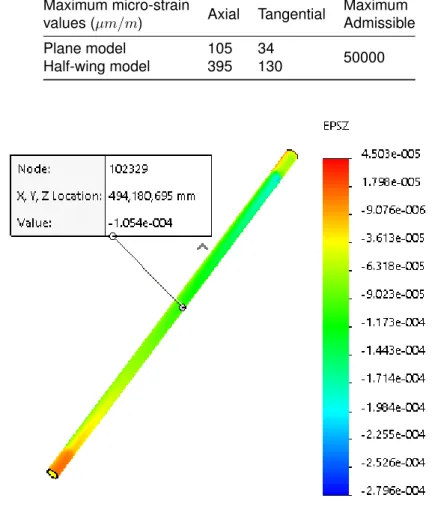
Based on these values, the problem that arises is that it is necessary to guarantee that the strain gauges have enough resolution to measure such small quantities since the maximum expected values of displacement are less than 1% of the maximum allowable extension of the strain gauges is.
Pitot Tube
Additionally, the use of Wheatstone bridges compensates for this effect, as it would be extremely difficult to quantify the change in resistance of a single isolated voltmeter when loaded.
Data Acquisition System (DAQ)
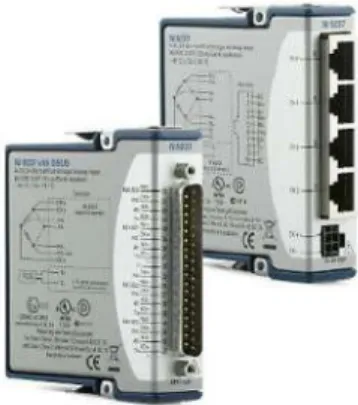
This means that, to fully obtain the charging conditions, it is necessary to have two of these systems of data acquisition. Now that both extensometers and data acquisition system (DAQ) have been selected, the connection mechanism between them needs to be clarified. Considering the data acquisition system, there are two possibilities that differ in the way the inputs are made (DSUBorRJ50).
Figures 5.6(a) and 5.6(b) show the NI 9237 data acquisition system with DSUB and RJ50, with detailed identification of input signal names.
Manufacturing, Cost and Assembly
Bill of Materials
Mechanical Components Manufacturing and Selection
Fixed platform
Couplers
Angle of attack adjustment mechanism
Rotary collar
Rod end bearings
Sensing bars
Moving platform
Flange
Strut
Mechanical Assembly
A flat head is used in this case due to the lack of space between the table, the fixed platform and the rotating collar. Similarly, 6 M4 flathead screws will be used to connect the swivel ring to the fixed platform. As for the flange, 3 M6 screw connections will be used to fix the movable platform and 3 M5 screws will be used to tightly fix the support.
Given the mechanism for adjusting the angle of attack at the top of the strut, an M10 bolt connection will be used to tighten both components together after selecting the desired angle of attack.
Instrumentation
To connect both fixed and movable platform to the couplers, a total of 24 M6 bolt connections are required. After the strain gauges are carefully attached to the rods, a wiring procedure must be performed. First, wires must be welded to the strain gauge wires to form the entire bridge circuit, which was presented in Section 2.3.1.
After completing the wiring process, it is possible to connect the complete bridges to the data acquisition device, as discussed in section 5.3.
Cost Breakdown
Handling voltage meters. The strain gauges must be handled with great care and since these components are very small, tweezers must be used. Further consideration of the strain gauge installation procedure can be found in the literature, but the one provided by the strain gauge manufacturer (HBM) [37] is most relevant in this case.
Calibration
- Calibration Methodology
- Least Squares Formulation
- Weighting Matrix Definition
- Fitting Evaluation
- Calibration Procedure
To obtain the calibration matrix coefficients, it is necessary to apply a series of known loading conditions, read the output voltages of the force transducers, and then connect the two. Having presented the VRandS matrices, it can be concluded that the SVRST term is related to the uncertainties of the full bridge readings affecting the measurements and has a dimension of To evaluate the efficiency of the method, a new variable, chi-squared, χ2, must be introduced.
Regarding this aspect, it is important to guarantee the alignment between these elements and the reference axis of the power balance.
Conclusions
Achievements
Future Work
Bibliography
Design and implementation of an aerodynamic balance in a subsonic wind tunnel and validation by numerical and experimental investigation of the lift and drag performance on airfoils.
Appendix A
XFLR5 Simulation Results
Stall Angles
Half-Wing Model
Full Aircraft Model
Half-Wing Model Coefficients
Without flaps
Appendix B
AHP Matrices
Appendix C
Stewart Platform Quality Index (λ) Evaluation
Appendix D
Structural Analysis
Strut & Flange
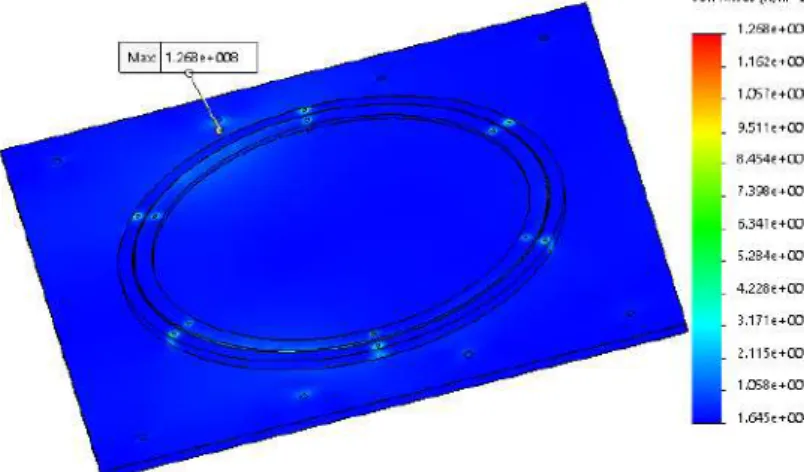
The stress distribution in the fixed platform is shown in Figure D.3 and the respective maximum value is marked. The yield stress of the material (structural steel 1.0037) is 235M P a, which is greater than the maximum value in the structure (109M P a). Figures D.4(a) and D.4(b) show the axial stress and displacement distribution along the beam, respectively. a) Axial stress distribution (b) Axial displacement.
This maximum value (31M P a) allows one to obtain the maximum expected axial stress, as suggested in table D.3.

Rod end bearing
The rod end bearings must be able to carry the maximum expected axial loads at the feeler rods. In this case, they present the ability to support a maximum axial load of 12900N, which is above the maximum expected value (11097N). In terms of stress values, Figure D.5 shows its distribution throughout the rod part bearing, presenting the maximum value of stress occurring near the housing area.
The maximum stress value occurs near the contact area with the couplers, where the loads are transferred.
Coupler
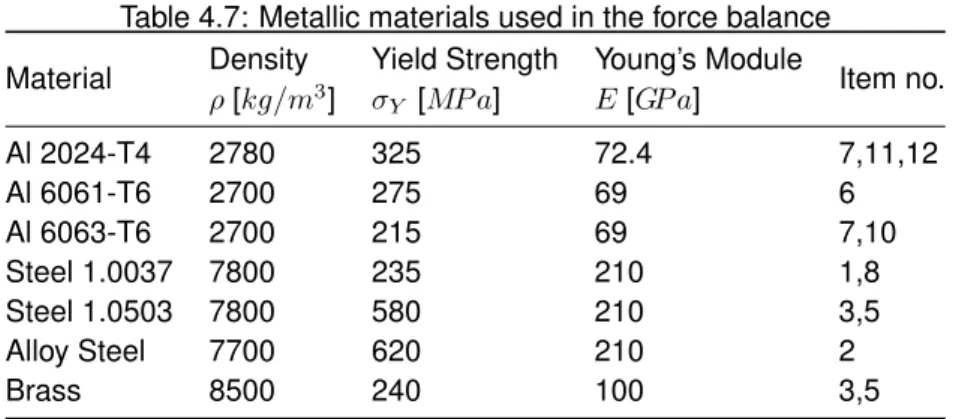
As mentioned earlier, the maximum stress values occur in the contact area between the links and the upper platform near the holes. The maximum stress value (127M Pa) is below the yield values of the table and the rotating collar, which are 235M Pa and 325M Pa, respectively. The maximum stress value (154M Pa) is below the yield strength of the considered aluminum alloy (Al 2024-T4), which has a yield strength of 325M Pa.
Appendix E
Technical Drawings
2 Coupler
8 Table
9 Flange
![Figure 1.3: Wind tunnel model of MAVion [3] Figure 1.4: Wind tunnel model of the DLR-F19 [4]](https://thumb-eu.123doks.com/thumbv2/123dok_br/19768384.0/27.892.134.762.524.742/figure-wind-tunnel-model-mavion-figure-wind-tunnel.webp)
![Figure 1.2: Schematic representation of the airfoil experimental set-up [2]](https://thumb-eu.123doks.com/thumbv2/123dok_br/19768384.0/27.892.231.655.101.462/figure-1-2-schematic-representation-airfoil-experimental-set.webp)
![Figure 1.5: Experimental set-up of a scaled Formula SAE car [5]](https://thumb-eu.123doks.com/thumbv2/123dok_br/19768384.0/28.892.222.669.107.399/figure-experimental-set-up-scaled-formula-sae-car.webp)
![Figure 1.6: Realistic scaled model of the terrain for wind tunnel testing at Construction Aerody-namic Laboratory, Brazil [6]](https://thumb-eu.123doks.com/thumbv2/123dok_br/19768384.0/28.892.464.777.645.876/figure-realistic-terrain-testing-construction-aerody-laboratory-brazil.webp)
![Figure 1.7: Wind tunnel set-up for concentration and velocity measurements (Niigata Institute of Technology) [7]](https://thumb-eu.123doks.com/thumbv2/123dok_br/19768384.0/28.892.114.424.647.872/figure-tunnel-concentration-velocity-measurements-niigata-institute-technology.webp)
![Figure 2.2: Closed circuit wind tunnel of Defense Establishment Research Agency (DERA) [1]](https://thumb-eu.123doks.com/thumbv2/123dok_br/19768384.0/33.892.249.641.115.370/figure-closed-circuit-tunnel-defense-establishment-research-agency.webp)

