As part of a larger study of the acoustic properties of Portuguese fricatives, a corpus is based on 154 Portuguese words with the fricatives /f, v, s, z, A, O/ in combination with the non-nasal vowels /i , i, e, , ?, a, 4, o, u/ is included. We were looking for a way to parameterize the fricatives that uses our knowledge of the underlying aeroacoustics.
Introduction
Shadle etc. 1996), acoustic analysis (frictional aeroacoustics) methods (Shadle and Scully 1995), and the incorporation of three-dimensional vocal tract data into speech synthesis (Davies et al. 1993). Researchers have used spectral moments and location equations on friction (Forrest et al. 1988; Jongman and Sereno 1995;
Analysis of Portuguese Fricatives
The acoustic and aerodynamic study of Portuguese consonant clusters of Andrade included an analysis of /asV/ sequences, where V was one of the vowels /i, ?, u/. Results of the analysis can also be used in the future to model and synthesize the fricatives, and compare with current formant (Wilde 1995) and articulatory synthesis (Narayanan and Alwan 1996; Riegelsberger 1997).
Thesis Overview
The phonetic and phonological evidence underlying the design of the corpus is described in the following sections.
Design
- Corpus 1: Sustained Fricatives
- Corpus 2: Nonsense Words
- Corpus 3: Real Words
- Corpus 4: Real Words in Connected Speech
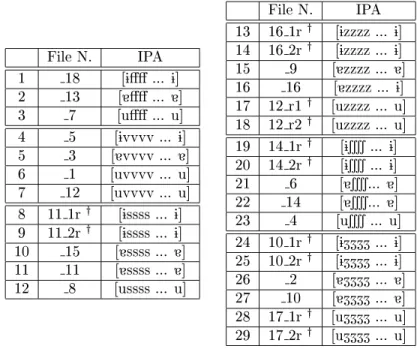
We recorded a set of VCV sequences, where V belongs to the reduced set of Portuguese vowels /i, ?, u/, and C is one of the Portuguese fricative consonants /f, v, s, z, A, O/ which be sustained for 5s (see Appendix B). We have chosen examples where the vowels in the VCV sequences are one of the Portuguese non-nasal vowels /i,i, e,?, a,4, o, u/.
Recording
Summary
Introduction
Segmentation and Annotation
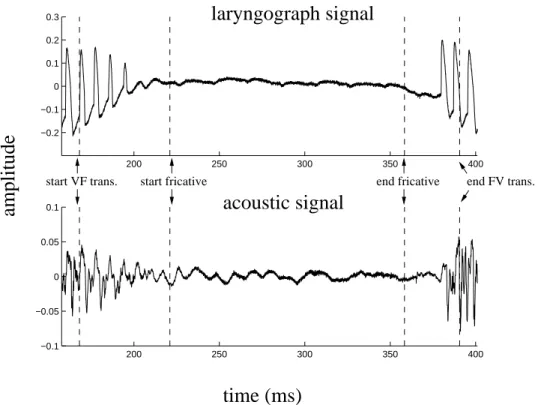
The time waveforms of all the corpus words were manually analyzed to detect the onset of the vowel-fricative transition, the onset of the fricative, the end of the fricative and the onset of the fricative-vowel transition. Therefore, the amplitude of the laryngograph signal is an important clue to determine the boundaries between the different phones.
Calibration
Therefore, the window length used to calculate the power spectra affects the overall amplitude. We will use a larger number of windows to calculate the spectrum of a longer signal segment (ambient noise and sustained fricatives).
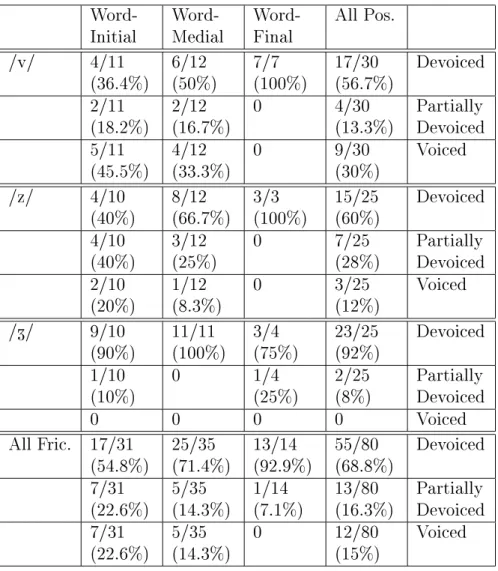
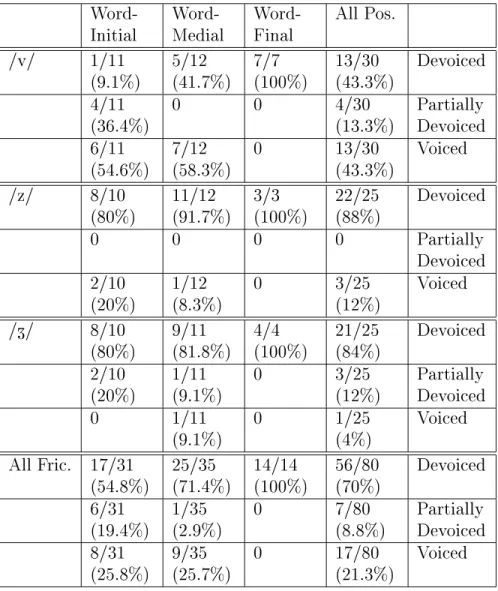
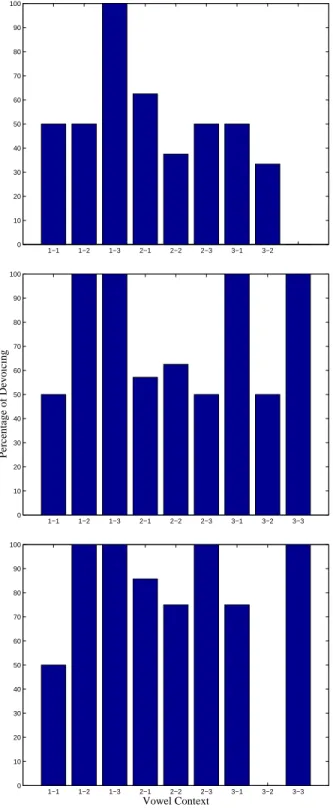
Devoicing
We used the relative value of the amplitude and duration of the acoustic signal, and the amplitude of the laryngograph signal to determine whether a rub is associated. Devoiced is defined as no periodic laryngograph signal structure in the fricative interval.

Automatic Criterion for Devoicing
Vowel Reduction
Spectral Analysis
Time-Averaged Spectra (Corpus 1a, 1b, 3 and 4)
The duration of the windows (10 ms) was chosen so that a reasonable number of windows could be used to adequately cover the wide range of fricative lengths in the corpora (from 35 ms to 200 ms). An example of the time-averaged spectrum of a Portuguese fricative is shown in Figure 3.10.

Ensemble-Averaged Spectra (Corpus 2)
This chapter presents a detailed discussion of results from temporal analysis of acoustic signals and laryngography. The results of the automatic devoicing measurement are compared with the manual ones and a consistent justification for the misclassification is presented.

Devoicing
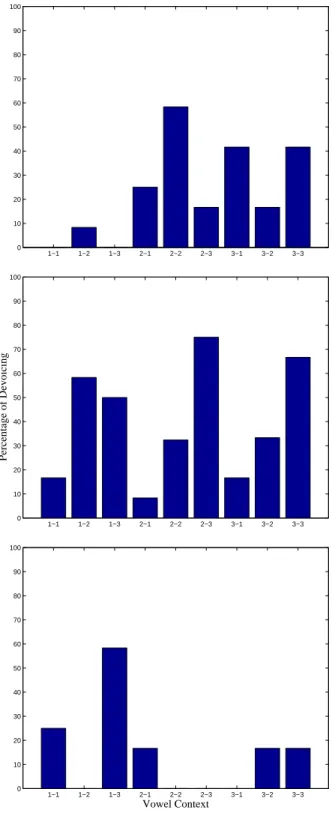
The values given are the number of dedicated or partial instances divided by the total number of instances. b~? . ^ditu/) in the re-recording session of the LMTJ speaker, to test the inuence of the phoneme that follows the word containing the fricative. The overall results from the devoicing analysis in Corpus 2, 3 and 4, using the manual criteria, show that more than 50% of the fricative device, see Figure 4.5, except for speaker ACC who has a very low percentage of arguments devoted to Corpus 2, as can be seen in figure 4.6.

Automatic Criterion for Devoicing
Although there is speech throughout the frication interval, the amplitude of the laryngograph signal during the frication is much lower than during the VF transition. The remainder of misclassified examples (8% { 3 out of 39) were due to a broad peak in the laryngograph signal during the fricative.
Duration Analysis
The average duration of the fricative is greater than the average duration of VF and FV transitions. Nevertheless, the average duration of fricatives is always greater than (or equal to) the duration of VF and FV transitions.

Discussion
This includes a detailed discussion of the time-averaged spectra of fricatives sustained at three different power levels (Corpus 1b) and a study of the average power spectra of sustained (Corpus 1a) and fricatives in real words (Corpus 3 and 4). The initial spectral analysis results of Corpus 1a, 1b, 2, and 3 for the LMTJ speaker are listed in the tables in Appendix E. Moving the articulators changes the shape of the vocal tract, which in turn changes its frequency response.
![Figure 5.1: Ensemble-averaged spectra at the middle of /s/ in [ ^ pus i ]. The dashed curve is the averaged spectrum of the room noise](https://thumb-eu.123doks.com/thumbv2/123dok_br/17600520.4189043/71.918.234.650.271.662/figure-ensemble-averaged-spectra-middle-dashed-averaged-spectrum.webp)
Fricative /f/
- Corpus 1a, 1b, 2, 3 and 4
- Speaker LMTJ
- Corpus 1a
- Speaker CFGA
- Speaker ACC
- Speaker ISSS
- Corpus 1b
- Speaker LMTJ
- Speaker CFGA
- Speaker ACC
- Speaker ISSS
- Corpus 2
- Speaker LMTJ
- Speaker ACC
- Corpus 3
- Speaker LMTJ
- Corpus 4
- Speaker LMTJ
- Speaker ACC
The spectrum of fricative /f/ has an identical amplitude in the low frequencies for all levels of exertion, but differs significantly at higher frequencies. The spectral amplitude is identical in the low frequencies (5 kHz) for all exercise levels, but differs by 10-15 dB at higher frequencies. If there is no stress, or the stress is placed in the syllable containing the fricative, the amplitude in the middle and at the end of the fricative drops out.

Fricative /v/
- Corpus 1a, 1b, 2, 3 and 4
- Speaker LMTJ
- Corpus 1a
- Speaker CFGA
- Speaker ACC
- Speaker ISSS
- Corpus 1b
- Speaker CFGA
- Speaker ACC
- Speaker ISSS
- Corpus 2
- Speaker LMTJ
- Speaker ACC
- Corpus 4
- Speaker LMTJ
- Speaker ACC
The difference in amplitude between high and medium effort spectra is 10-20 dB, and the amplitude of medium and low effort levels is identical, at higher frequencies. The two examples of fricative /v/ in sentence 12 have very similar peak spectral frequencies (1.6 kHz, 2.5 kHz and 3.6 kHz).
Fricative /s/
- Corpus 1a, 1b, 2, 3 and 4
- Speaker LMTJ
- Corpus 1a
- Speaker CFGA
- Speaker ACC
- Speaker ISSS
- Corpus 1b
- Speaker LMTJ
- Speaker CFGA
- Speaker ACC
- Speaker ISSS
- Corpus 2
- Speaker LMTJ
- Speaker ACC
- Corpus 4
- Speaker LMTJ
- Speaker ACC
The frequency of the broad peak for hard and soft eort levels in File N.2r1, shown in Figure 5.6, and File N.7r1 is higher (6.2kHz and 5.5kHz respectively) than for medium eort level (5.1kHz and 5kHz respectively) . The amplitude of the spectrum at the middle of the fricative is higher than at the beginning and end, for frequencies greater than the broad peak frequency, see Figure 5.7. The overall spectral amplitude at the middle of the fricative is higher than at the beginning and end, and the overall spectral amplitude at the beginning is higher than at the end.

Fricative /z/
- Corpus 1a, 1b, 2, 3 and 4
- Speaker LMTJ
- Corpus 1a
- Speaker CFGA
- Speaker ACC
- Speaker ISSS
- Corpus 1b
- Speaker LMTJ
- Speaker CFGA
- Speaker ACC
- Speaker ISSS
- Corpus 2
- Speaker ACC
- Corpus 3
- Speaker LMTJ
- Corpus 4
- Speaker LMTJ
- Speaker ACC
The frequency of the broad peak for high and soft eort levels in file N.6r2 is higher (5.9 kHz) than for medium eort level (5.2 kHz). There is an amplitude drop of 20-30dB on the spectra from the first broad peak to 20kHz. The top of the broad top is not as high as in central and front vocal contexts.
Fricative / A /
- Corpus 1a, 1b, 2, 3 and 4
- Speaker LMTJ
- Corpus 1a
- Speaker CFGA
- Speaker ACC
- Speaker ISSS
- Corpus 1b
- Speaker LMTJ
- Speaker CFGA
- Speaker ACC
- Speaker ISSS
- Corpus 2
- Speaker ACC
- Corpus 4
- Speaker LMTJ
- Speaker ACC
For back vowel contexts, the difference in amplitude between the broad peak and the first two peaks is larger. There is a 20-30dB drop in amplitude in the spectra from the first broad peak up to 20kHz. There is a 25-40 dB drop in amplitude from the first broad peak to the second broad peak.
Fricative / O /
- Corpus 1a, 1b, 2, 3 and 4
- Speaker LMTJ
- Corpus 1a
- Speaker CFGA
- Speaker ACC
- Speaker ISSS
- Corpus 1b
- Speaker LMTJ
- Speaker CFGA
- Speaker ACC
- Speaker ISSS
- Corpus 2
- Speaker ACC
- Corpus 3
- Speaker LMTJ
- Corpus 4
- Speaker LMTJ
- Speaker ACC
The relative amplitude of the cluster of peaks (around 2, 2.5 and 3.5 kHz) in the spectra of fricative /O/ shown at the top of Figure 5.13 is different from that shown at the bottom of Figure 5.13 where the spectral shape lies closer to that of /A/. In general, at high frequencies there is less amplitude difference between medium and high exercise than between low and medium exercise. Word-initial /O/ in // context has a peak around 4 kHz, which has a higher amplitude than the same peak in the spectra of fricative /O/ in back vowel contexts.
Comparing the Overall Spectra of Speakers LMTJ and ACC . 92
Syllable Stress and Eort Level
The other three such cases showed a different pattern, with spectral amplitudes missing in the main peak but roughly equal above 3 kHz, see Figures 5.19 to 5.21. Two of these cases matched in stress (one pair, both highlighted, shown in Figure 5.19; the other, both suppressed, shown in Figure 5.21), the third case, shown in Figure 5.20, did not match and the amplitude difference at the peak it was the largest (emphasized corpus 2 is 15dB above depressed corpus 3). Several vowel context differences were observed: the main peak in Figure 5.18, for the /uAu/ context, was at a significantly lower frequency than in, e.g., the /iAi/ context; this is as expected from previous work (Shadle and Scully 1995).
Discussion
The parameters, derived from previous studies, capture source-related changes mostly as predicted; for the persistent fricative they also separate fricatives by place.
Previous Studies Parameterising Fricatives
The corpus consisted of nonsense words produced by 3 speakers of American English (Jongman and Sereno 1995) and 20 speakers of American English (Jongman et al. 1998). The corpus consisted of a small number of nonsense words produced by 4 speakers of American English. However, the authors used a very limited corpus of 5 real words produced by 10 speakers of American English.
Parameterisation
The spectrum of the noise source depends on the shape of the constriction, the tract downstream of it and the speed of the flow through it. The F values used to calculate Sp and Sp0 were the same for each place of articulation of the 6 fricatives for all loudspeakers and corpora: F/f,v/ = 5kHz,. The F parameter must be associated with the site of the fricative and decreases as the site moves posteriorly.

Results
Sustained Fricatives
Voiced Lower source strength Ad, Sp and Sp0 lower High eort level Higher source strength Ad, Sp and Sp0 higher Medium eort level. Sp plot the fricatives cluster by place (labiodental, alveolar and postalveolar) as shown in Figure 6.10. Sp mark the fricatives produced by all four speakers cluster by place as shown in Figure 6.13.

Fricatives in Context
- Fricatives in Nonsense Words (Corpus 2)
- Fricatives in Real Words (Corpus 3 and 4)
- Correlations Between Duration, Word Posi-
Is there a significant difference in the overall amplitude of the spectra of the various examples of a particular fricative. The only significant difference appears to be the amplitude of the \voice-bar", which is 10-15dB higher for stressed than for relaxed fricatives. The vowel to fricative duration ratio, as previously cited, may be a better candidate than the duration of the fricative to capture the effects of devoicing duration correlations in Ad and Sp.

Conclusions
Future work
Conclusions
Further Work
Corpus 4: Real Words in Connected Speech
Example IPA notes English translation girar Oi^rar 48 to spin gelado Oi^ladu 127 ice. Example IPA Notes English Translation altivo al^tivu 124 haughty, arrogant dever di^ver 22, V1CV1 duty, to owe.
Corpus 1b
Corpus 2
Corpus 3
Corpus 4
This appendix lists the recorded material of Corpus 1a, 1b and 2 for all four speakers (LMTJ, CFGA, ACC and ISSS). This appendix reports the results of the temporal analysis of Corpus 3 and 4 fricatives and their VF and FV transitions for Speaker LMTJ. We also include an extensive phonetic transcription of all recorded material and a list of re-recorded examples for Speaker LMTJ.