PCC 6803 (cultura geral, meio nutriente, tolerância ao etanol e produção em escala piloto), sobre as metodologias disponíveis para testar a quantidade de etanol em uma cultura e como essas metodologias podem ser aplicadas à produção de Synechocystis. PCC 6803 em um fotobiorreator e investiga métodos simples e de rápida aplicação para determinar as quantidades de etanol na cultura.
Introduction
Literature review
Biofuels
It is widely expected that the production of biofuels globally will continue to grow in the coming years. In fact, investment and production capacity for biofuels has been extensive in recent years (Figure 1) (7).

Bioethanol
Bioethanol is a fuel with a high octane number and a low tendency to create knocking - premature combustion - in the internal combustion engine. Indeed, ethanol production has been steadily expanding, and Brazil and the US continue to hold a steady lead in its production (10).

Ethanol production through the use of microalgae
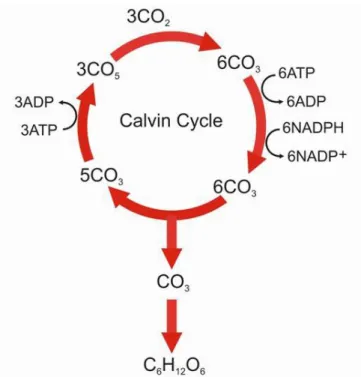
The end result is that the carbon flow from the pyruvate was directed towards the formation of the end product – ethanol – rather than biomass. This can be explained by the competing metabolic pathways: the microalgae produce ethanol and thus use less carbon for biomass formation, while absorbing the same amount of light.

Pilot unit scale cultivation methodologies
- Raceways
- Tubular photobioreactors
- Green wall panels
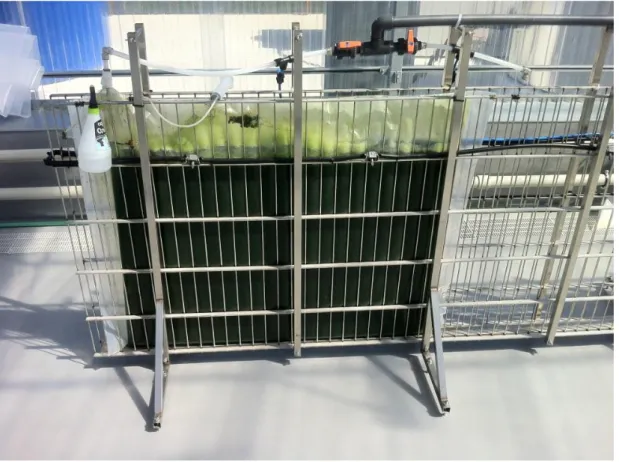
Tubular photobioreactors consist of straight, coiled or looped transparent tubes arranged in different ways to maximize sunlight incidence. Properly designed tubular photobioreactors are able to reasonably isolate the culture from potential contaminants and allow extended culture durations. Tubular photobioreactors are very suitable for both indoor and outdoor mass cultivation of microalgae as they have a large illumination surface.
However, this is also a drawback, as photoinhibition—the lack of cell growth due to excess light—is much more common (16). The first is due to very high levels of dissolved oxygen and the second is due to the lack of ability to control the temperature over the pipe extension as a whole. This technology is widely used because it has low cost, high transparency and acceptable levels of contamination at start-up.

Monitoring methods in a microalgae cultivation
- Optical density
- pH and conductivity
- Nitrogen measurement
- Dry weight
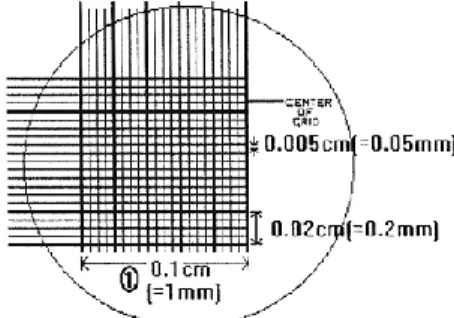
- Cellular concentration
- Flow cytometry
An essential factor in the preparation and administration of nutrient media is the form and amount in which the nitrogen is supplied to the culture. As such, the guiding values for the addition of nutrient media are the amount of nitrogen in the medium and the needs of the culture. The magnitude of the empirical correction is related to the nature and concentration of organic matter.
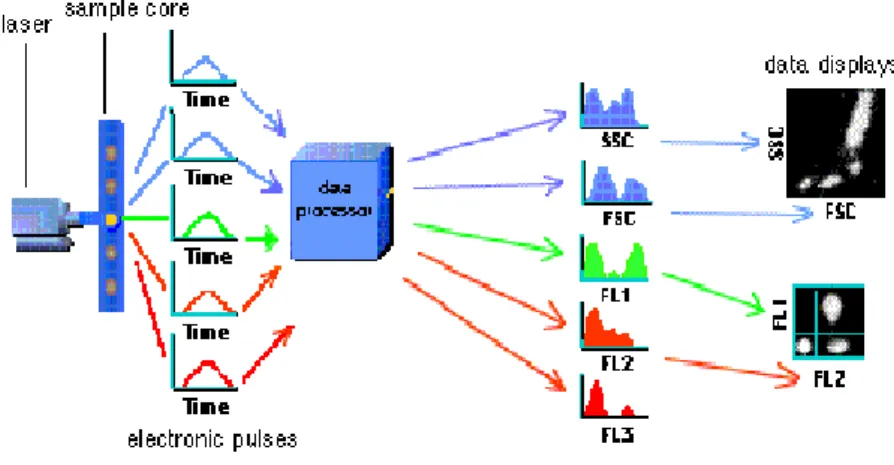
By determining the amount of nitrate in the sample, the required amount of nutrient medium to be added can be calculated. The optical system consists of lasers to illuminate the particles in the sample stream and optical filters to direct the resulting light signals to the appropriate detectors. A combination of beam splitters and filters sends the scattered and fluorescent light to the appropriate detectors.
Analytical methods for ethanol quantification in aqueous solutions
- Enzymatic method for ethanol determination
- Redox titration
- Refractive index
- Pycnometry
- Gas chromatography
- Near infra-red spectroscopy
Any manipulation of ethanol nearby may affect the test results. Therefore, different materials have different refractive indices, and in the case of a combination of materials, the refractive index will represent a value between the refractive indices of the two pure substances. Relative density or specific gravity is the ratio of the density (mass per unit volume) of a substance to the density of a given reference material.
Pycnometry allows the calculation of the composition of a mixture by considering that the ratio of volume to mass is constant. It makes the density of the substance proportional to mass addition, which makes it possible to calculate the mass fractions of the mixture. The gaseous compounds under analysis interact with the walls of the column - causing the different retention times.
Microalgae Production
- Optimisation of routine follow-up procedures for Synechocystis cultivation
- Optimization of nutritive media for Synechocystis sp. PCC 6803
- Experimental setting and conditions
- Experimental results
- Synechocystis tolerance to different types of ethanol
- Experimental conditions
- Discussion
- Conclusion
- Pilot-scale Production
- Experimental conditions
- Results
- Conclusion
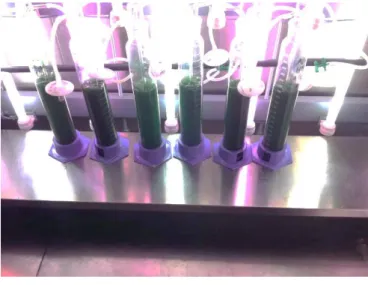
The setup consisted of 6 bubble columns with duplicates of the 3 nutrient media during the test (Figure 18 - Airlift set up with different nutrient media). In addition, and due to this fact, the water used at the beginning of the test was sterilized and demineralized. Using the established correlations and monitoring methods, it became possible to monitor and evaluate the productivity of the culture in different nutrient media over time.
The two recipes are very similar and so the behavior of the species grows towards the nutrient media. The results of such a test translate into a complete optimization of the nutrient media for an industrial large-scale application. However, it is noted that further optimization of the nutrient media on an industrial scale will be necessary.
Methodologies
Tested techniques
- Near-Infrared Spectroscopy
- Experimental set up
- First test
- Second Test
- Conclusion
- Refractometry
- Experimental setting
- Results
- Conclusions
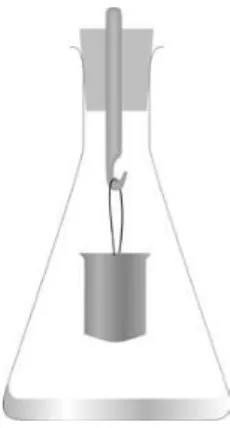
- Pycnometry
- Experimental setting
- Results
- Conclusions
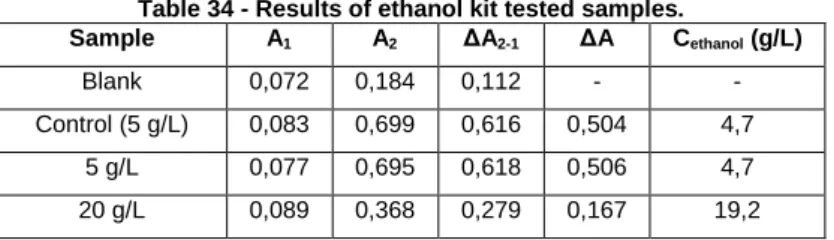
- Enzymatic method
- Experimental setting
- Results
Considerable consistency was observed for the amounts of ethanol in all calibration curves. The refractometry test was performed on a portable refractometer with the aim of verifying whether it was possible to establish a correlation between the measured refractive index and the amount of ethanol in the sample - of water and culture - and whether that correlation allowed to identify quantities . of ethanol. The first aimed to establish a calibration curve of ethanol in water and the second to test the impact of culture and nutrient media on the measurements.
However, since the smallest scale unit is 0.001, the smallest amount of ethanol the refractometer can measure is 2.5 g/L. Pycnometric tests were performed using a 100 mL pycnometer to determine the correlation between the measured density and ethanol concentration in the sample - again water and culture. The purpose was to determine whether the kit is suitable for analyzing the amount of ethanol in substances.

Ethanol evaporation testing
- Laboratorial scale application
- Experimental setting
- Results
- Conclusion
- Pilot Unit scale application
- Experimental setting
- Results
- Conclusion
A laboratory bubble column reactor was used to simulate the environment in the PBR to determine the amount of ethanol lost in the gas phase. For this, liquid phase measurements were performed on a time scale in order to determine the loss of ethanol from the bubble columns. For this, we added a large amount of ethanol to the PBR and performed the measurements throughout the day.
The result of this experiment gave us the conclusion about the amount of ethanol lost in the reactor. Similar to the conclusion of the previous test, the rate of ethanol evaporation is not significant to imply large evaporation losses. The temperature inside the PBR has not been shown to have a direct impact on the evaporation rate.

Conclusion
Bibliography
Annexes
Annex 1
- Correlation of optical density (microplate reader) with dry weight
- Correlation of optical density (microplate reader) with cellular density (Neubauer method) 50
Annex 2
- MMF industrial recipe
Enzymatic method first reaction
Enzymatic method second reaction
Enzymatic method absorvance calculation
Enzymatic method concentration calculation
Chromium oxidation of ethanol
Iodine reduction
Iodine oxidation
The main differences between GC, High-Performance Liquid Chromatography (HPLC) and Thin-Layer Chromatography (TLC) are in the stationary phase, which is usually solid, and the temperature control of the gas column. The biggest advantage of the technique is that NIR penetrates much further into a sample than mid-infrared radiation. The purpose of the setting was, as mentioned above, to study the growth and behavior of Synechocystis sp.
Biomass concentration is estimated using the correlation between OD730 and dry weight (Table 6). Elemental analysis of the supernatant at the end of phase 1 and phase 2 shows that the decrease in productivity of BG-11 is most likely due to the lack of phosphorus, iron and cobalt (Table 10). This conclusion may imply the need to add antibiotics to the process or a strict control of the ethanol concentration in PBR.
As part of the operational testing, it becomes necessary to monitor the behavior and development of Synechocystis sp. As the culture concentration decreases, contamination of ciliates, which feed the microalgae, occurred, leading to the death of the culture.
Correlation between Refractive Index and ethanol concentration (demineralized water). 38
It provides the additional advantage that it can be measured "in situ" accounting for fewer errors due to ethanol evaporation. However, due to the small volume and nature of the operations involved, errors were very common. For their reduction, the volume was increased through the use of a 100 mL pycnometer.
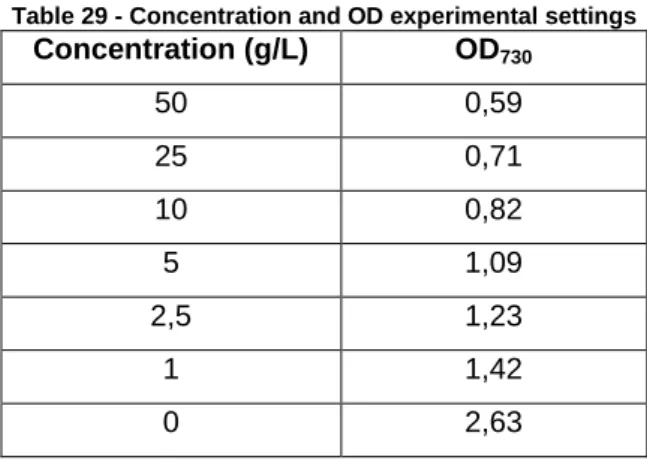
The first was aimed at establishing a calibration curve for ethanol in demineralized water, the second to create a similar calibration curve for ethanol in culture, and the third to create a calibration curve that allowed relating OD730 to sample density – as it is expected that different biomass contents will affect density in different ways. Although not as adequate as the first, the results also allow establishing a correlation. All three tests were successful in the sense that they allowed establishing effective correlations that allow the calculation of ethanol concentration based on density.
Correlation between ethanol concentration in a culture and density
Correlation between density and OD
Correlation between ethanol concentration in a culture, OD and density
The experiment leads us to the conclusion that at such a low air flow the evaporation rate of ethanol does not change significantly and that the losses of ethanol are relatively small. Taking into account that in the real case the ethanol concentration would be much lower, this also means that the ethanol loss under laboratory conditions would be much less – much more than it already is. After collecting the data from the previous experiences, it became necessary to test the evaporation of ethanol in the PBR.
Since the main objective of the test is to evaluate the ethanol evaporation rate, it was necessary to measure the temperature inside and outside the greenhouse and of the water/ethanol mixture in the PBR. Samples for the determination of ethanol using the enzyme test were stored in a refrigerator (-20ºC) and analyzed afterwards. However, the temperature inside the greenhouse was higher than inside the PBR and this could have an impact on the rate of evaporation - as the exhaust pipe of the PBR would not remove air from the deposit and equilibrium would be maintained there.
Dry weight correlation to OD
Similar to the previous case, it can be concluded that the cell number is satisfactorily correlated with optical density with the following ratio:.
Cell Count correlation with OD
In this case the correlation is worse than the previous one, but it still provides an acceptable approximation of the number of cells per mass of Synechocistis:.
Cell Count Correlation with Dry Weight
Cell number correlation with Dry mass