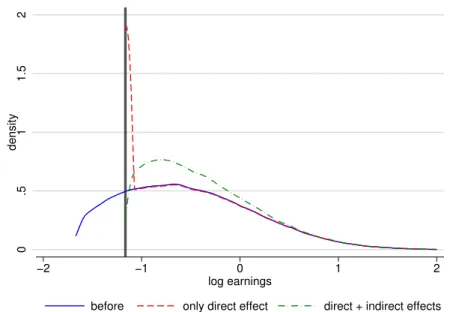
In the third step, we use our model to quantify the causal effect of the minimum wage on earnings inequality. Theories of such indirect effects of the minimum wage go back to at least Burdett and Mortensen (1998).
Three facts about Brazil’s inequality decline
Table1 reports results in such a decomposition of the observed 20 logpoint decrease in the variance of earnings over time. Panel (a) plots the relationship between inequality on the bottom side and the binding of the minimum wage for five selected years.
4 Model
- Environment
- Workers
- Firms
- Matching
- Equilibrium
- Equilibrium characterization
23 Consequently, as will become clear shortly, our model produces minimum wage spillover effects within θ markets, but not across all. Assume that worker types share the same mobility parameterκθ =κ and that the minimum wage is low enough to begin with, wmin/θ< p0. Since the minimum wage is more likely to be pegged in low-skill markets, it narrows the wage gap between high- and low-skill workers.
As a result, the minimum wage affects firms that initially pay above the wage floor, but its effects fade toward higher levels of productivity.
5 Estimating the model
- Estimation strategy
- Parameter estimates
- Model fit
- Policy experiment in the model
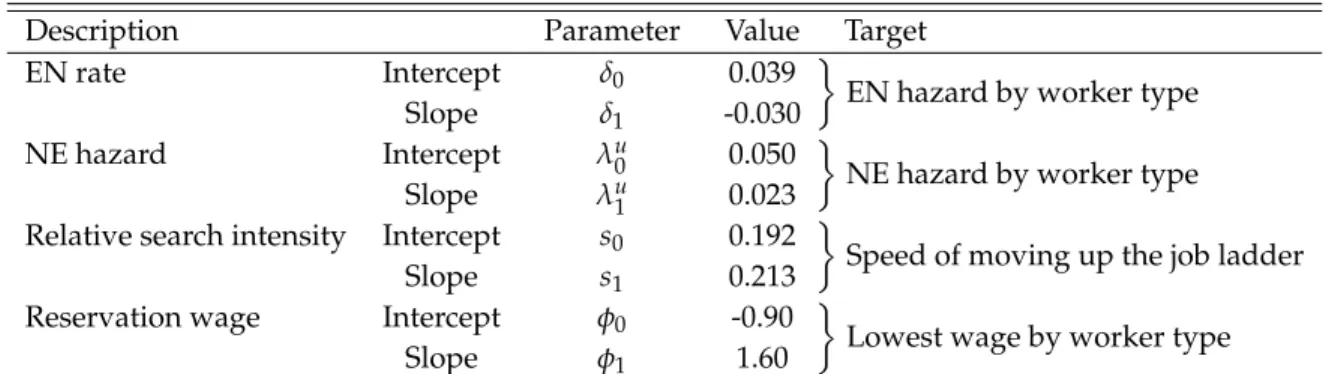
The remaining parameters of the model are estimated by indirect inference: the average ability of the workers, µ, the dispersion in the ability of the workers, σ, the shape of the distribution of the firm's productivity, ζ, and the cost of creating jobs, cθ. Table 6 shows the estimated structural parameters of our model, which accounts for the heterogeneity of workers and firms and the initial relative attachment of the minimum wage. The model also captures a significant proportion of the covariance between the worker effect and the firm effect.
Since the covariance is not straightforward. intended in our evaluation of indirect inference, this is a success of the model.
6 Quantitative results
Explaining Fact 1: Effects throughout the earnings distribution
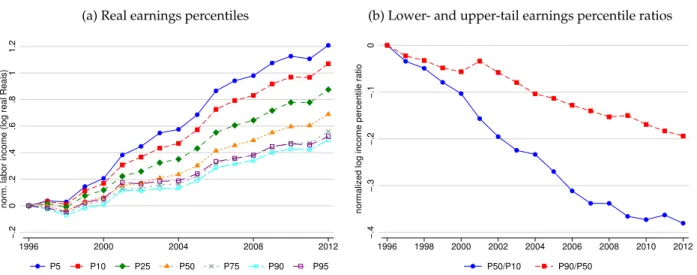
The model does a very good job of matching the empirical compression in earnings at different percentiles in response to an increase in the minimum wage. For example, the 50-10 log ratio compresses by 31 log points in the data versus 21 log points in the model (or 68 percent), while the log 90-50 ratio compresses by six log points in the model versus 13 log points in the model. data (or 46 percent). It is worth noting that, given the share of workers bound by the minimum wage below seven percent throughout this period, the compression in percentile ratios shown in Table 8 is reinforced by indirect effects of the minimum wage further up the earnings distribution.
Implementing this decomposition in the data and in the estimated model using the variance of log earnings as our measure of inequality, we find that about half of the overall decline in inequality is due to the direct effect (54.2% in the data and 42% in the model ) and half of that is due to the indirect effect of the minimum wage (45.8% in the data and 57.6% in the model).
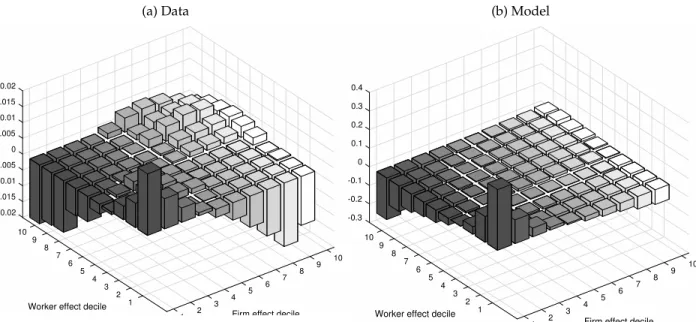
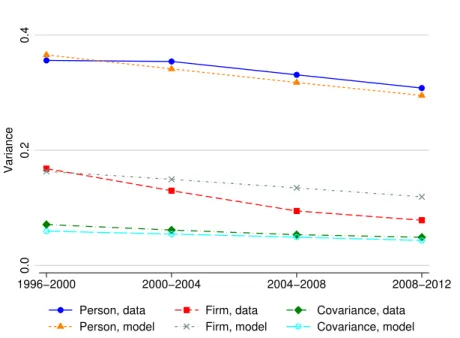
Explaining Fact 2: Changes in returns as the main driver of declining inequality Figure 8 plots the variance of worker effects, firm effects and their covariance in the model and the
In the model, the exogenous distribution of worker skill and firm productivity is held constant by construction. However, the model endogenously generates changes in the distribution of worker and firm characteristics among employed workers over time. In absolute terms, the variance of the explained fraction falls by 0.05 log points in the data and 0.03 log points in the model.
Also, on the worker side, there is no meaningful compression due to changes in the underlying distribution of working ability in the model or data.
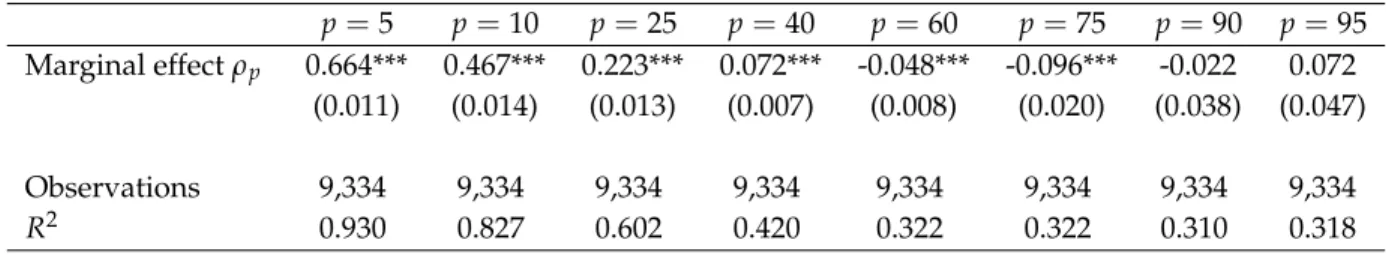
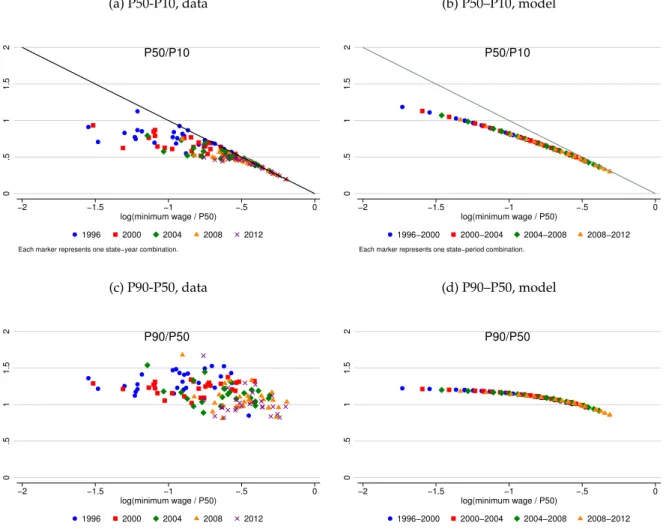
Explaining Fact 3: Spill-over effects identified off cross-regional variation
Notes: Each marker represents one state-year combination, with states corresponding to Brazil's 27 federal units (Unidades Federativas or UF) in the data, and 27 separate model simulations with estimated levels of initial minimum wage binding in the model. Both the data and the model produce significant carryover effects from the minimum wage below the median. Beyond the 90th percentile, the data suggests that minimum wage binding is positively correlated with inequality, in that the difference between the pth percentile and the 90th increases with the minimum wage.
But over most of the support, the model does a good job of capturing the heterogeneity of the response of inequality to the minimum wage in the data.
7 Discussion
Employment effects and welfare
Another explanation for the observed pattern involves factors affecting the top of the income distribution during this period, which are related to the initial minimum wage obligation, but not captured by our model. That our model provides a less than perfect fit to the top ten percent of the earnings distribution is not a major concern, given our focus on the bottom of the distribution and the common wisdom that more complex theories are needed to explain the top. of distribution of profits. . Relative to the top, the empirical job-finding rate at the bottom of the skill distribution fell by 11 percent, which is close to our model's prediction.
It is possible that such a response would further mitigate the impact of the minimum wage on job finding, while potentially leading to consumers ultimately paying higher prices for final goods.
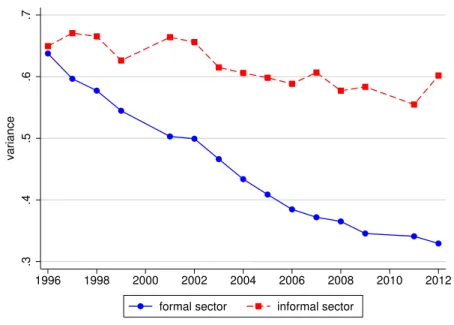
The informal sector
Notes: Job search rates are calculated from a proportional hazard model of re-entry into the formal sector with monthly frequency within 5-year periods in the RAIS data and from initial estimation plus equilibrium response of vacancies to the minimum wage in the model. First, the addition of an informal sector will significantly increase the complexity of the theoretical model and our estimation procedure. Second, we find that most of the decline in inequality occurred within Brazil's formal sector, which motivated our focus on this part of the economy.
To summarize, although we think that it would be very interesting to extend the model to include an informal sector that is not bound by the minimum wage, we consider our approach rich enough to capture the dynamics of the capturing the majority of Brazilian employment over this period. .
8 Conclusion
Clemens, Jeffrey, and Michael Wither, “The Minimum Wage and the Great Recession: Evidence on the Effects on Employment and Income Trajectories of Low-Skill Workers,” NBER Working Paper no. William Lester and Michael Reich, “Minimum Wage Shocks, Employment Flows, and Labor Market Frictions,” Journal of Labor Economics. Komatsu, Bruno Kawaoka and Naercio Aquino Menezes Filho, "Does the Minimum Wage Increase Explain the Fall in Wage Inequality in Brazil?", Working Paper, 2016.
Teulings, Coen N., "Aggregation Bias in Elasticities of Substitution and the Minimum Wage Paradox,"International Economic Review.
Appendix
A Data description and sample selection
Matched employer-employee data
Firm characteristics data
Comments: Sample includes all companies covered by the PIA dataset in the mining and manufacturing sectors.
Household survey data
The standard deviation is calculated by first collapsing the variables by year and then combining the years within the subperiod. Notes: All statistics are for adult male workers aged 18-49. Earnings statistics are multiples of the current minimum wage. The standard deviation is calculated by first collapsing the variables by year and then combining the years within the subperiod.
B Additional material on the minimum wage in Brazil
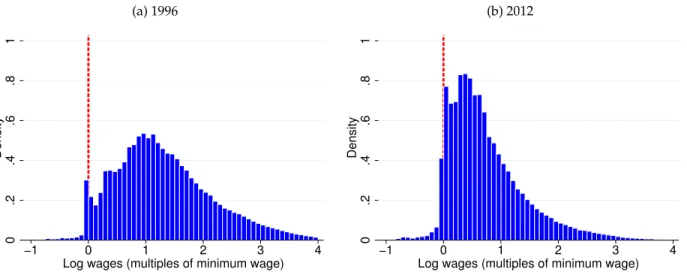
- Bindingness of the minimum wage
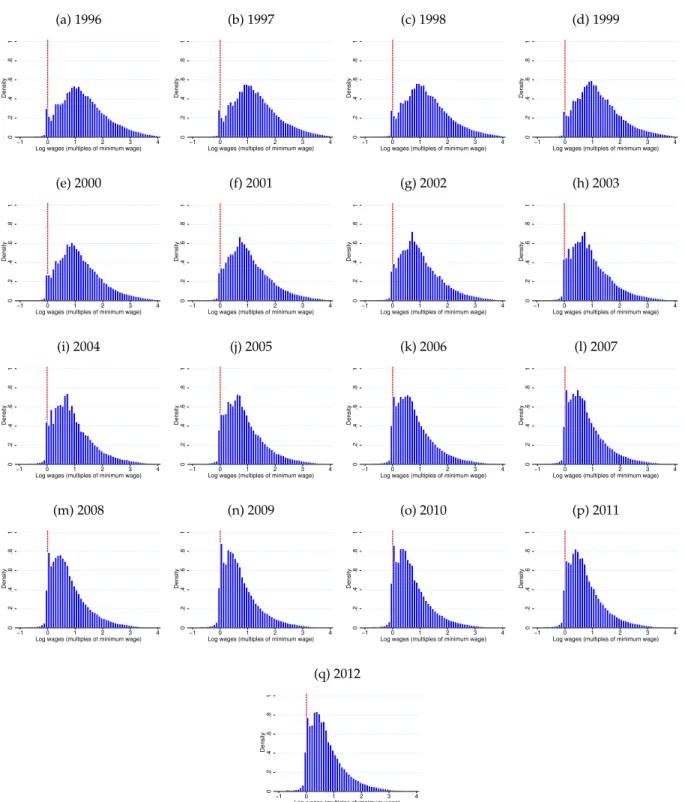
- Earnings distributions by year
- Additional exercises using cross-regional variation
- Relation to empirical literature
Since the minimum is initially more binding in regions, a region sees a larger relative increase in its median wage in response to the federal minimum wage increase. This is a robust prediction of the model - the minimum wage increases wages more than if it was initially more binding. Suppose further that the minimum wage is only somewhat binding in region ~s, so that lower tail inequality is relatively large.
Essentially, the model predicts a non-monotonic relationship between the initial binding of the minimum wage and the magnitude of the subsequent reduction in inequality at the bottom in response to an increase in the minimum wage.
C Proof of Proposition 1
Although the minimum wage has large spillover effects in our model, the within-region specification produces estimated marginal effects of the minimum wage that are positive at the bottom, quickly become statistically insignificant, and then begin to slope upward for higher earnings percentiles. . Differentiating equation (13) with respect to productivity yields that the gradient of productivity and payment is given by . Differentiating equation (13) with respect to ability yields that the gradient of the ability payoff is given by .
Thus, in markets where the minimum wage is binding, the workers' ability pay gradient coincides with the minimum wage.
D Solution algorithm
Instead of taking λuθ from the data and iterating cθ to match it, we keep cθ fixed at its "pre-period" estimate and then cycle through the new job search rate λuθ until the implied total vacancies are consistent with the firm's period-optimizing behavior after the end.
E Details of estimation routine
First stage: Labor market parameters
The implicit vacancy cost parameter cθ of the model that corresponds to estimated job arrival rates based on the data shown above is shown in Figure 22 as a function of worker ability. Note that this step takes as input the estimated distributions of work ability and firm productivity, as discussed in Section E.2. The falling cost relative to employee wealth (solid blue line) is implied by the higher rate of job seekers of high-capacity employees.
The rising absolute cost (red dotted line) is implied by the size of the estimated increase in the number of skills vacancies.
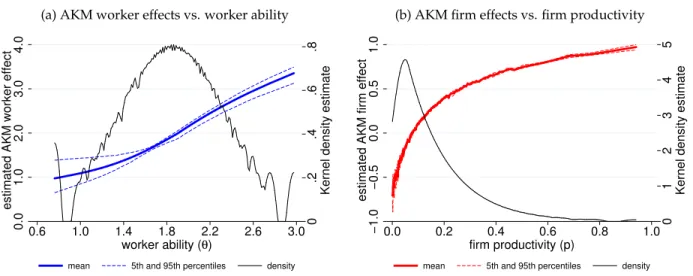
Second stage: Firm and worker heterogeneity
Notes: The worker skill density is approximated using an Epanechnikov kernel density estimate with 50 bins for 50 worker types. The estimated effects of AKA workers in panel (a) are on average strictly increasing in worker skill θ and have narrower error bands around the center of the skill distribution, with a correlation between worker skill and the estimated effects of AKK workers over 0.97. For the lowest productivity deciles of the firm, the relative wage premiums across worker skill scales become more compressed and the returns to finding a better employer vary by worker type, thus producing an error term as seen through the lens of AKK regression.43.
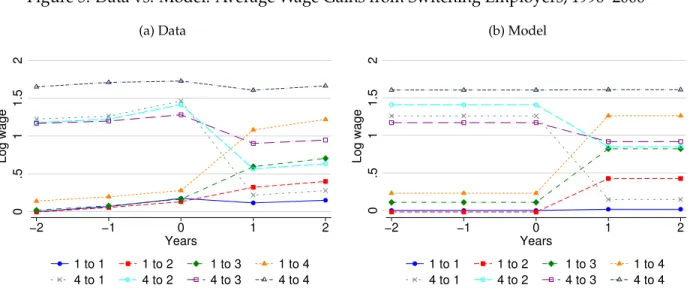
Notes: The figures plot average log wages by firm productivity decile and work ability decile from model-simulated data for the periods 1996-2000 and 2008-2012.